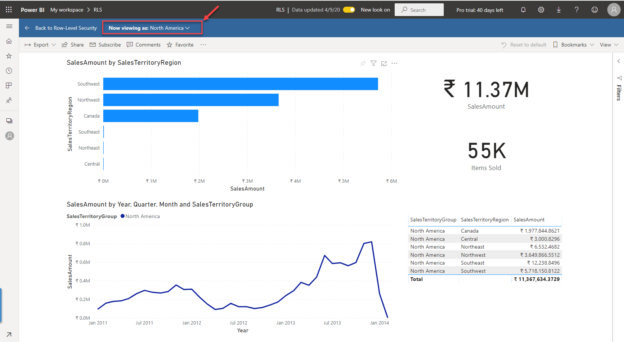
Aveek Das
Map Chart Types in Power BI

An overview of Chart Types in Power BI

April 9, 2020 by

In this article, I am going to give an overview of the most widely used chart types in Power BI. Power BI, as everyone might be aware, is one of the SaaS offerings from Microsoft in the field of BI and Analytics. It provides a very intuitive way for non-technical users to do analyses and create reports on their own without having to rely on a technical team. One of the main purposes of Microsoft behind Power BI is to promote self-service BI and it is one of the BI tools in the market with a comparatively lower learning curve as there are many similarities compared to Microsoft Excel.

Read more »
Aveek Das
Database Synchronization Completed

How to deploy SSAS cubes

April 9, 2020 by

In this article, I’m going to discuss the different ways in which we can deploy SSAS cubes. SSAS or SQL Server Analysis Services is an enterprise-grade analytical data engine which helps business to create semantic models that can be used for reporting and making better decisions. The semantic layer created by SSAS can be accessed by client tools like Power BI, or Excel and reports can be prepared from thereon. SSAS comes with a few different versions, which are as follows.

Read more »
Frank Solomon
Setting the target Directory

How to update the T-SQL Toolbox database

April 6, 2020 by

Introduction

In an earlier article, Solve Time Zone, GMT, and UTC problems using the T-SQL Toolbox database, I described T-SQL Toolbox, a free, open-source SQL Server database that handles time zone, date, and time calculations in a clean and efficient way. Available here at the CodePlex Archive, and here at GitLab, T-SQL Toolbox relies on time zone and time zone adjustment data in its two tables for many of its own calculations. However, T-SQL Toolbox does not update that data. I built primitive C-Sharp and VB.net applications that extract the latest time zone and time zone adjustment data from the Windows registry, and I discussed those applications in that earlier SQL Shack article. In the article, I explained that we can build SQL Server UPDATE statements with this extracted data, and then update the T-SQL Toolbox tables. This article describes a better approach and a better solution.

Read more »
Aveek Das
Dimension Error Configuration

Warnings in SSAS Cubes

April 3, 2020 by

In this article, I’m going to list out some of the most common warnings we encounter while developing SSAS Cubes and the reason for those warnings. As you are aware, SSAS cubes are developed using the SQL Server Data Tools (SSDT) for Analysis Services (Visual Studio), all the examples will be taken from Visual Studio 2017 only.

Read more »
Aveek Das
Pivot Table Example

Dynamic Pivot Tables in SQL Server

April 2, 2020 by

In this article, I am going to explain how we can create a dynamic pivot table in SQL Server. Pivot tables are a piece of summarized information that is generated from a large underlying dataset. It is generally used to report on specific dimensions from the vast datasets. Essentially, the user can convert rows into columns. This gives the users the ability to transpose columns from a SQL Server table easily and create reports as per the requirements.

Read more »
Aveek Das
Default Masking

Understanding Dynamic Data Masking in SQL Server

April 2, 2020 by

In this article, I’m going to explain the Dynamic Data Masking feature in SQL Server. As it goes by the name, Dynamic Data Masking is one of the security features that was introduced in SQL Server 2016. In an ever-growing digital era, the security of ones’ data has become one of the most important and expensive deals. Everyone expects their data to be protected as their own asset and like to treat it with the highest efficiency possible.

Read more »
Emil Drkusic
SQL Examples - the data model we'll use in the article

Learn SQL: SQL Query examples

March 31, 2020 by

In the previous article we’ve practiced SQL, and today, we’ll continue with a few more SQL examples. The goal of this article is to start with a fairly simple query and move towards more complex queries. We’ll examine queries you could need at the job interview, but also some you would need in real-life situations. So, buckle up, we’re taking off!

Read more »
Rajendra Gupta
Title in Power BI Desktop

Scroller visual for Stock price movements in Power BI Desktop

March 31, 2020 by

In the article, Candlestick chart for stock data analysis in Power BI Desktop, we explored Power BI Desktop to analyze stock prices. If you follow the stock market, you might have noticed a ticker (similar to the following image) showcasing stock prices and changes since the last close price. It shows an up and down indicator depending upon the positive or negative change in the stock price.

Read more »
Aveek Das
Selecting Data

Introduction to Row-Level Security in SQL Server

March 31, 2020 by

In this article, I’m going to discuss Row-Level Security in SQL Server. RLS or Row-Level Security as the name suggests is a security mechanism that restricts the records from a SQL Server table based on the authorization context of the current user that is logged in. This means the records from the tables are displayed based on who the user is and to which records do the user has access to. This is usually done to allow specific users to have access to their data only without permission to view other users’ data.

Read more »