OLAP cube

Dinesh Asanka
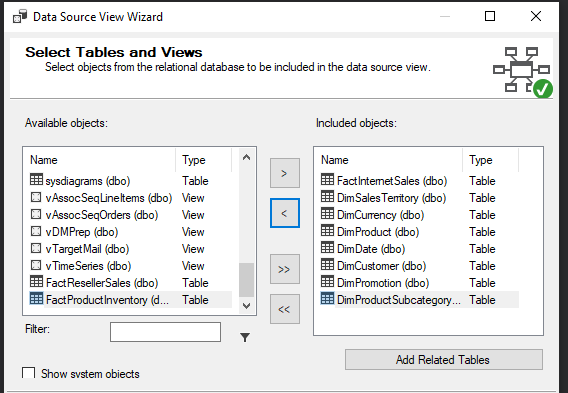
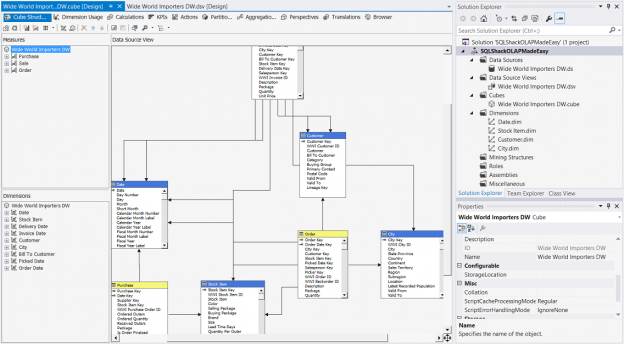
Select Tables and Views to create the OLAP Cube.

Multi-language support for SSAS

April 8, 2021 by

Introduction

After discussing many features in SQL Server Analysis Services (SSAS) in order to carry out much richer analytics activities, we are going to discuss another feature in SSAS named Multi-language support for SSAS. In a previous article, we discussed how to create SSAS OLAP Cubes and how to access the OLAP cube using Excel. Further, we discussed how to include hierarchies in SSAS in order to improve the data analysis capabilities. In addition to those features, we discussed how to create perspectives in OLAP Cubes and how to perform management activities in SSAS.

Read more »
Dinesh Asanka
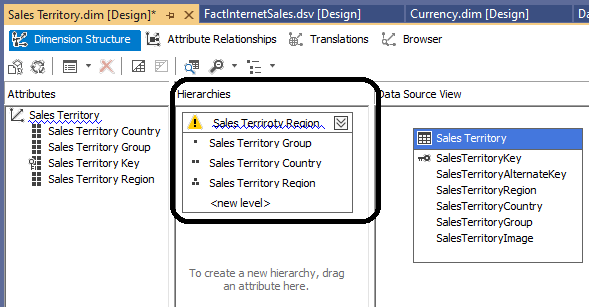
Example of SSAS Dimension Hierachies from Sale sterritory Dimension.

Enhancing Data Analytics with SSAS Dimension Hierarchies

July 22, 2020 by

Introduction

This article will discuss how SSAS Dimension Hierarchies can be used to analyze data much efficiently. If you are a data analyst, you want to start the analysis with a higher hierarchy. Then navigate the narrow attributes when required. For example, it will be better to start with analyzing revenue by year. If you need to analyze further into the data, you can choose the needed year and expand the Quarter -> Month, respectively. Let us see how we can create SSAS Dimension Hierarchies in OLAP Cubes to suit different requirements.

Read more »
Dinesh Asanka
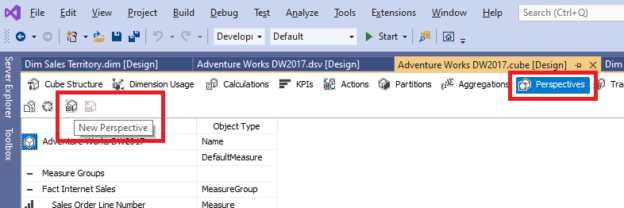
Creating OLAP Perspectives

Improve readability with SSAS Perspectives

July 9, 2020 by

Introduction

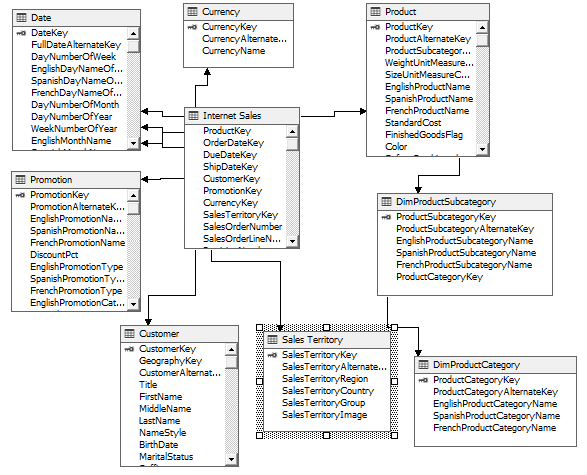
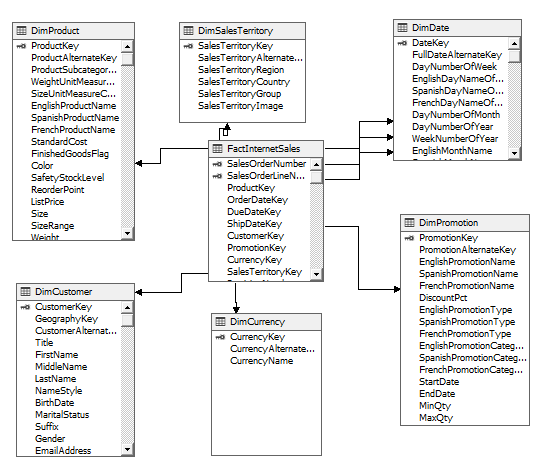
In this article, we will be looking at a feature of SQL Server Analysis Service (SSAS) OLAP Cube that is SSAS Perspectives. We discussed creating SSAS OLAP Cubes in a previous article: OLAP Cubes in SQL Server. In an SSAS OLAP cube, there can be a large number of measures, dimensions and dimension attributes. The following screenshot is the star schema for the selected example that was created from the AdventureWorksDW sample database that can be visible at Data Source View.

Read more »
Aveek Das
Database Synchronization Completed

How to deploy SSAS cubes

April 9, 2020 by

In this article, I’m going to discuss the different ways in which we can deploy SSAS cubes. SSAS or SQL Server Analysis Services is an enterprise-grade analytical data engine which helps business to create semantic models that can be used for reporting and making better decisions. The semantic layer created by SSAS can be accessed by client tools like Power BI, or Excel and reports can be prepared from thereon. SSAS comes with a few different versions, which are as follows.

Read more »
Hadi Fadlallah
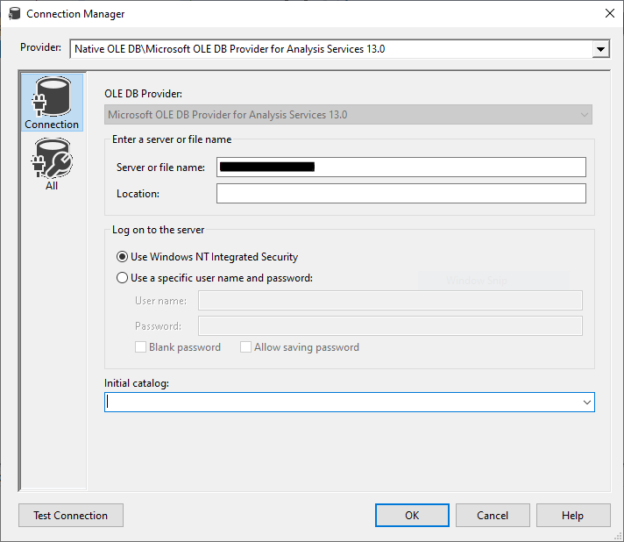
connecting to SSAS OLAP cube using SSIS connection manager

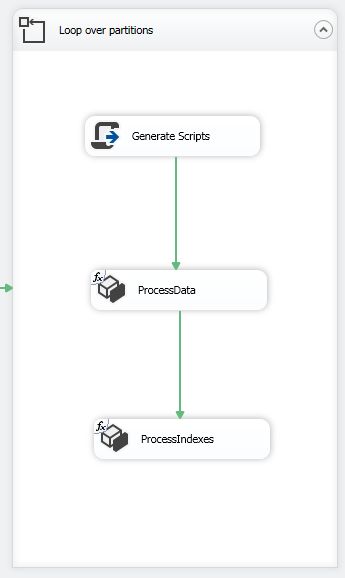
Manipulating SSAS OLAP cubes using SSIS

February 12, 2020 by

There are many operations that we may run while working with OLAP cubes such as cube and partitions processing, executing administrative tasks, performing analysis and more… Three query languages that are used to run these operations: multidimensional expressions (MDX), data mining expressions (DMX) and XML for Analysis (XMLA). We can mainly write and execute these queries in SQL Server Management Studio, but many times we need to implement them within a flow that executes other tasks over other services (database engine, file system…)

Read more »
Sifiso Ndlovu

How to resolve Excel Timeline Filter Errors caused by SQL Server OLAP Data Sources

January 31, 2017 by
Over the course of my career, I have developed and deployed to production several business intelligence solutions. These solutions have been consumed using numerous data visualisation tools. One of those data visualisation tools, is Microsoft Excel – which remains a popular data visualisations tool for many of my end users. Like many software products, newer version releases of Excel usually introduce new features. One such feature is the Timeline filter control which was first introduced in Microsoft Office 2013. The Timeline filter control enables end users to visually filter Excel PivotTables using fields defined as dates. The Timeline filter has several benefits compared to the traditional Excel dropdown filter. Figure 1 illustrates one of those benefits whereby the Timeline filter allows end-users to easily apply a filter (i.e. using a scroll bar) again a PivotTable. It also has useful annotations that describes what you have filtered on – in this case, we have chosen sales period between February and March 2011. Read more »
Steve Simon

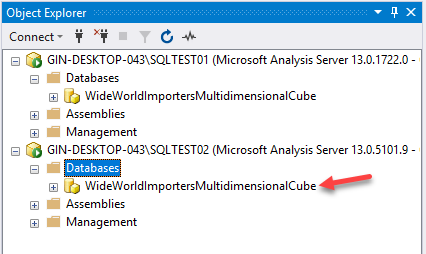
How to effectively extract data from an OLAP cube by relying upon T-SQL

October 19, 2016 by

Introduction

Last month I ran two Business Intelligence pre-conferences in South Africa. A interesting request arose during the course of the preconference in Cape Town. The individual wanted an approach to extracting data from an OLAP cube that would avoid intensive utilization of MDX and more reliance upon T-SQL. His main concern was with filtering the data at run time, via the report front end.

In this “fire side chat” we shall do just that, utilizing the cube that comes with the new Microsoft database “WideWorldImporters” and we shall learn how we can get from this

Read more »
Sifiso Ndlovu

How to filter multidimensional OLAP cubes in SSRS reports

September 28, 2016 by

Ever since the early days of my career, SQL Server Reporting Services (SSRS) has been one of my preferred data visualization tools simply because end users and developers alike use it for free. Although a majority of my SSRS solutions have been based off a relational dataset that uses Transact SQL (T-SQL), I have also produced several reports that used Multidimensional Expressions (MDX) to connect and retrieve data from SQL Server Analysis Services (SSAS) multidimensional OLAP cube. Recently, I found myself having to refactor some of these SSAS based SSRS reports, particularly converting a single value SSAS-populated parameter into a multi-value parameter. In this article, I explore how you can go about making these changes using SSRS query designer’s design and query modes.

Read more »
Evan Barke

SQL Server Business Intelligence features – creating reports based on OLAP cubes

May 19, 2014 by

Introduction

In order to build a SQL Server business intelligence solution one needs to:

  1. Design a de-normalized data warehouse
  2. Build and schedule an Extract, Transform and Load (ETL) package that will feed the data warehouse at regular intervals with new data from the OLTP database.
  3. Setup, personalize and process a cube based on the data warehouse.
  4. Add the processing step to the ETL schedule to ensure the whole chain is automated.
Note: These steps are covered in detail in other articles in the series. If you do not yet have an OLAP cube set up and automated and you need more info as to how to do so; please refer back to the relevant step.
Read more »
Evan Barke

SQL Server Business Intelligence Features – Creating a Simple OLAP Cube

May 9, 2014 by

Introduction

Multidimensional cubes and transactional databases are two very different things. From experience I have seen even veteran DBAs avoid the subject of cubes completely because it is too much of an unknown area for them. Often cube work is passed on to developers because of their comfort with using Visual Studio. This is a great pity because it is, in reality, not very difficult at all to create an OLAP cube. It is safe to say that most of the work needs to be done in a traditional SQL Server database engine / SSIS environment from creating the data warehouse model to keeping it fed with ETL packages. This article assumes you already have a data warehouse and uses AdventureWorksDW2012 as an example. Following these steps should put you on the road to a decent SQL Server business intelligence solution based on a read-optimized OLAP cube. Read more »