This article shows you how to use Power BI conditional formatting and apply different color schemes to reports in the Reports View of Power BI desktop. The same process can be applied for Power BI conditional formatting in the cloud.
Read more »
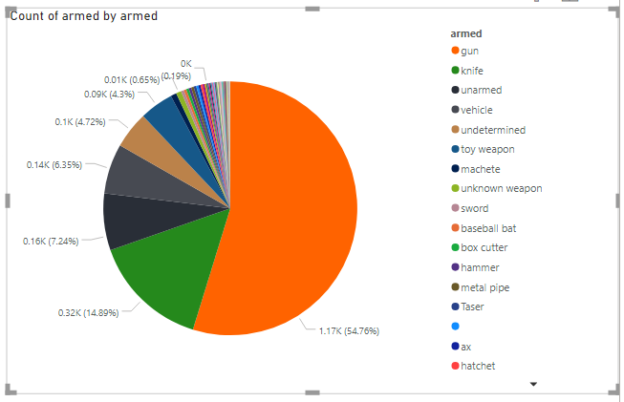
This article shows you how to use Power BI conditional formatting and apply different color schemes to reports in the Reports View of Power BI desktop. The same process can be applied for Power BI conditional formatting in the cloud.
Read more »
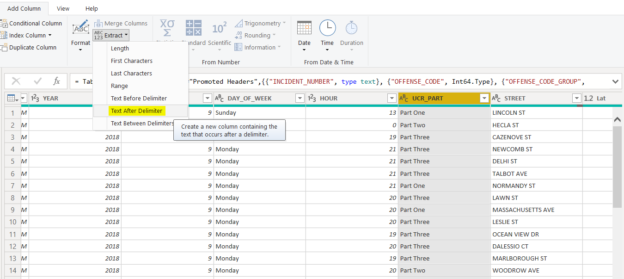
In this article, you will see how to use the Extract function in Power BI to extract information from columns in a Power BI dataset.
Read more »
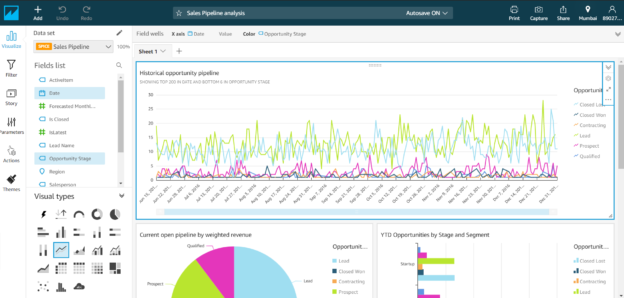
In this article, I am going to introduce Amazon QuickSight and how to visualize data using it. Amazon QuickSight is a data visualization tool offered by Amazon hosted on AWS and is available across multiple locations. As per the statement provided on the official website it says: “Amazon QuickSight is a fast, cloud-powered business intelligence service that makes it easy to deliver insights to everyone in your organization.” Using QuickSight, users can create different analyses and then integrate those in a dashboard and share them with people within the organization.
Read more »
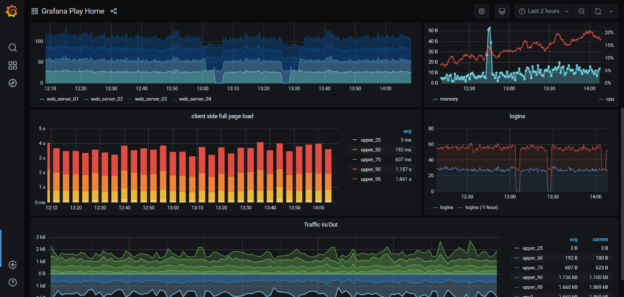
In this article, I am going to demonstrate how to set up Grafana Dashboard for real-time analytics or data monitoring purposes. Grafana is an open-source, cross-platform analytics service tool that can be used to fetch data from several data sources, and then the data can be visualized in a much intuitive way in the form of bars and graphs. This is quite a useful feature for the DevOps or the IT team as it can make their job easier to find abnormalities or spikes in the production environment by observing the logs generated.
Read more »

In this article, we will be discussing Microsoft Neural Network in SQL Server. This is the seventh article of our SQL Server Data mining techniques series. Naïve Bayes, Decision Trees, Time Series, Association Rules, Clustering, and Linear Regression are the other techniques that we discussed until this article.
Read more »
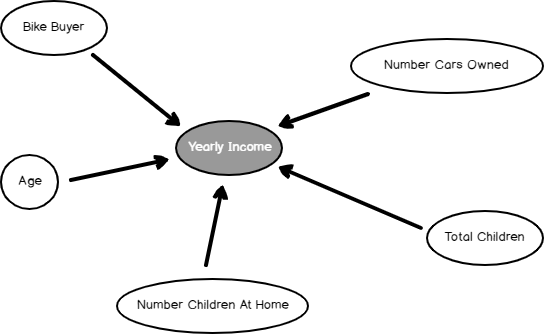
In this article, we will be discussing Microsoft Linear Regression in SQL Server. This is the next data mining topic in our SQL Server Data mining techniques series. Naïve Bayes, Decision Trees, Time Series, Association Rules, and Clustering are the other techniques that we discussed until today.
Read more »
In this article, you will see how to implement a star schema in Power BI. Microsoft Power BI is a business analytics tool used to manipulate and analyze data from a variety of sources.
Read more »
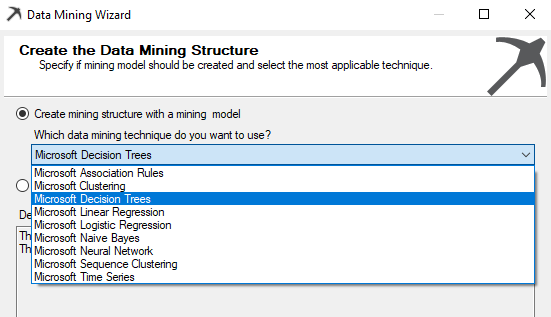
Decision trees, one of the very popular data mining algorithm which is the next topic in our Data Mining series. In the previous article Introduction to SQL Server Data Mining, we discussed what data mining is and how to set up the data mining environment in SQL Server. Then in the next article, Microsoft Naïve Bayes algorithm was discussed. In this Article, Microsoft Decision Trees are discussed with examples. The Microsoft Decision Trees algorithm is a classification and regression algorithm that works well for predictive modeling. The algorithm supports the prediction of both discrete and continuous attributes.
Read more »
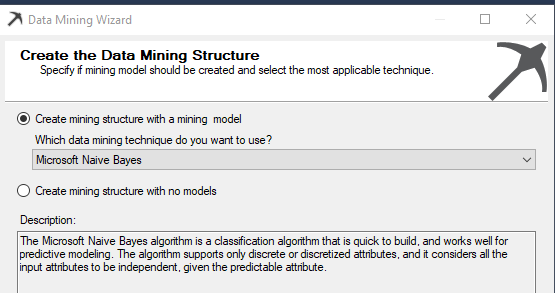
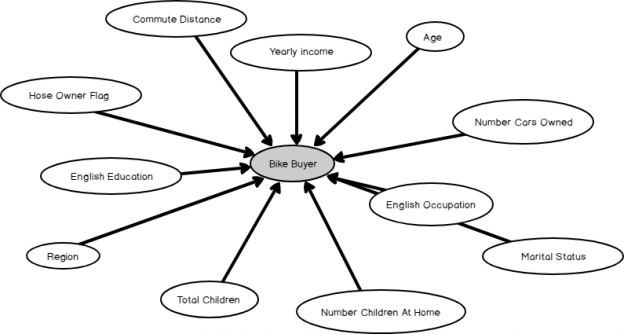
In this article, we will walk through Microsoft Naive Bayes algorithm in SQL Server.
Read more »
Prediction, is it a new thing for you? You won’t believe you are predicting from the bed to the office and to back to the bed. Just imagine, you have a meeting at 9 AM at the office. If you are using public transport, you need to predict at what time you have to leave so that you can reach the office for the meeting on time. Time may vary by considering the time and the day of the week, and the traffic condition etc. Before you leave your home, you might predict whether it will rain today and you might want to take an umbrella or necessary clothes with you. If you are using your vehicle then the prediction time would be different. If so, you don’t need to worry about the rain but you need to consider the fuel level you need to have to reach to the office. By looking at this simple example, you will understand how critical it is to predict and you understand that all these predictions are done with your experience but not by any scientific method.
Read more »
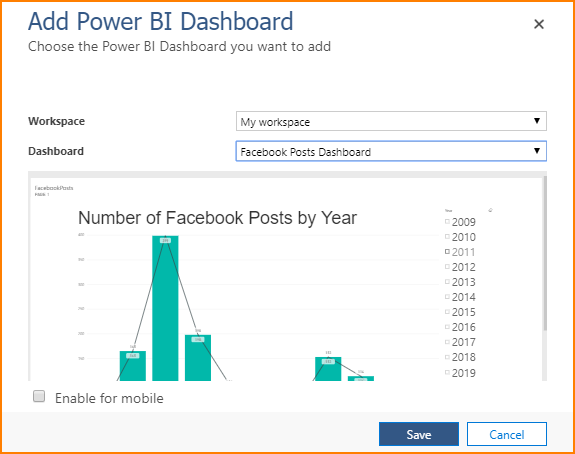
Whilst Power BI continues to be the leading data visualisation tool in Gartner’s BI quadrant, Dynamics 365 for Customer Engagement (formerly Dynamics CRM) remains one of popular business platforms for driving sales and facilitating customer communications. Thus, an integration of Power BI into Dynamics 365 for Customer Engagement ensures that you get to explore your Dynamics 365 for Customer Engagement data via a powerful and rich data visualisation tool. However, as indicated in Figure 1, Dynamics 365 for Customer Engagement plans often come with a Power BI free license thereby limiting the type of Power BI features available to you. In this article, we look at how you can get the best out of your Power BI free license for the purposes of embedding Power BI artefacts into Dynamics 365 for Customer Engagement. Going forward, any references to Dynamics 365 for Customer Engagement plan in this article will be shortened to Dynamics 365.
Read more »
Power BI Desktop is a useful reporting and analytical tool to represent data in various formats. These presentations help us to quickly understand information and circulate it to stakeholders in a visual fashion.
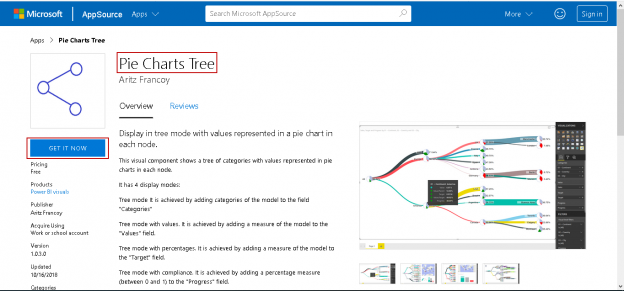
Power BI Desktop amplifies the value of data. We can connect to multiple data sources and visualize the data interactively. One of the best parts of Power BI Desktop is the custom visual feature. It allows developers to create custom visuals and users can then download these visuals from the marketplace and use it as per the data set requirements. We can prepare reports using Power BI Desktop and share the reports using the Power BI service.
Read more »
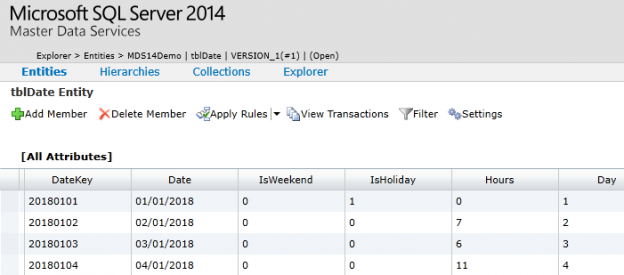
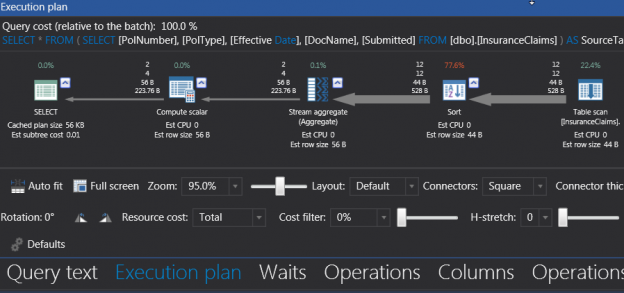
One calculation that you are almost guaranteed to have to produce in your career as a T-SQL developer relates to the calculation of a turnaround time. This is often a key KPI for measuring the performance of both individuals and teams, particularly when the business operates within a service-oriented sector i.e. customer support, transportation, healthcare etc. Turnaround time calculation does not only refer to business metrics rather any activity (i.e. ordering a pizza) with a recorded start and an end time can have its own turnaround time calculated. In this article we evaluate different options for calculating a turnaround time including using DATEDIFF function, creating your own user-defined function (UDF) as well as an integration with SQL Server Master Data Services.
Read more »
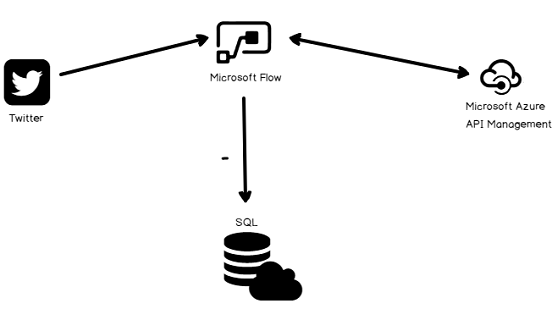
Twitter is a very popular social media platform which generates millions of tweets a day. These tweets include very valuable data for marketers or social media analyzers because they can analyze these tweets with specific algorithms and find out the sense of social media users.
Read more »
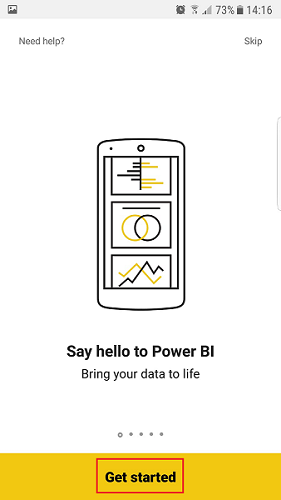
Over the past three years, I read some interesting news about Microsoft which was “Microsoft acquires mobile business intelligence leader Datazen”. This news made me excited because showing Reporting Service reports in mobile devices can be painful and often not effective for end users. After this acquisition, Microsoft developers worked quickly to adapt the Datazen application to SQL Server Reporting Services and this effort culminated in Microsoft SQL Server Mobile Report Publisher.
Read more »
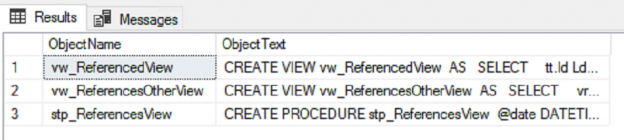
We’ve recently had production failures because our developers changed an important reference. In this case, we had a view which several procedures and views referenced. A developer made a change to the referenced view by removing columns, which caused several procedures and a view that referenced it to fail. We’re considering whether we should stop this practice, or if there are other ways we can prevent changes to an object that’s being referenced by other objects (in our case, a view).
Read more »

4K resolution, AKA Ultra HD, refers to a horizontal screen display resolution in the order of approximately 3,840 pixels. On two-dimensional display devices such as computer monitors, it represents display resolution of 3840×2160 pixels which is four times as many pixels as regular Full High Definition (1920×1080). What this means for users is the more pixels per inch (PPI) the higher resolution on the monitor. In other words, you can be closer to the monitor and still enjoy a crisp, clear picture.
Read more »
As with everything else, all good things must come to an end. After hanging around for a good decade SQL Server 2008 and SQL Server 2008 R2 has started the countdown to its End of Life.
D-day for SQL Server 2008 and SQL Server 2008 R2 is set to the 19th of July 2019. Which is approximately a year from now, give or take a couple of months.
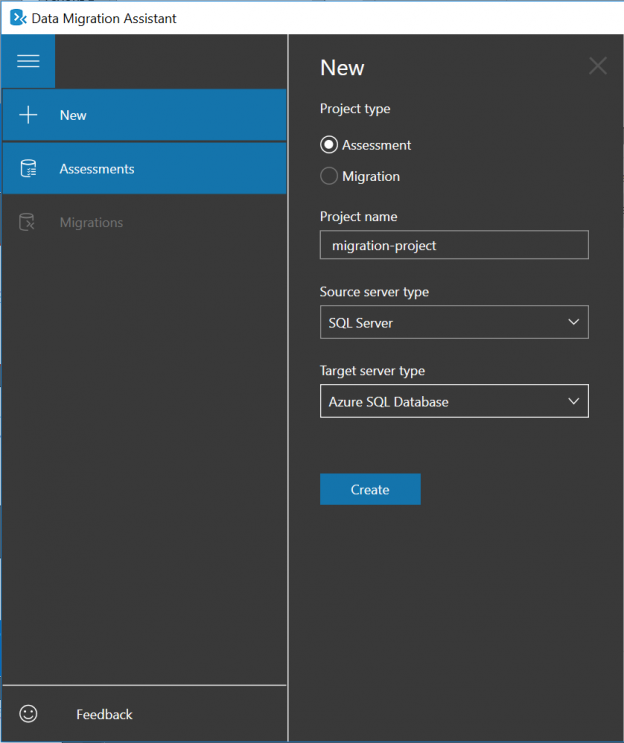
If you are still running SQL Server 2008 or SQL Server 2008 R2, now is definitely the time to upgrade. In this article; I am going to tell you why you would want to upgrade to a newer version of SQL Server (2016 or 2017) or Azure SQL Database. I will also discuss some of the tools that you might use to make the upgrade as painless as possible.
Read more »
A few weeks back I had been working on an interesting proof of concept for a client within the food/grocery industry. The objectives were to be able to provide the client with information on sales patterns, seasonal trends and location profitability. In our previous “get-together” we discussed how to create a tabular model project and how to create efficient and effective reports utilizing Excel.
Read more »
A few weeks back I had been working on an interesting proof of concept for a client within the food / grocery industry. The objectives were to be able to provide the client with information on sales patterns, seasonal trends and location profitability. The client was an accountant and was therefore comfortable utilizing spreadsheets. This said, I felt that this was a super opportunity to build our proof of concept utilizing a SQL Server Tabular Solution and by exploiting the capabilities of Excel and Power Reporting for the front end.
Read more »
Introduction
One of the primary functions of a Business Intelligence team is to enable business users with an understanding of data created and stored by business systems. Understanding the data should give business users an insight into how the business is performing. A typical understanding of data within an insurance industry could relate to measuring the number of claims received vs successfully processed claims. Such data could be stored in source system as per the layout in Table 1:
Read more »
In a past chat back in January 2015, we started looking at the fantastic suite of data mining tools that Microsoft has to offer. At that time, we discussed the concept of a data mining model, creating the model, testing the data and running an ad-hoc DMX query. For those folks that may have missed this article, the link may be found immediately below;
Read more »
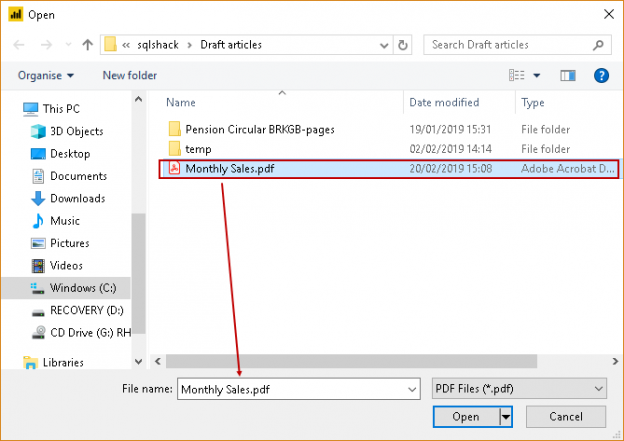
A few days ago I received an interesting challenge from one of our clients. The lady was attempting to estimate her potential monthly revenue recognition for the fiscal year beginning January 1, 2015, through December 31, 2015. The lady named Linda sells goods and services (each class yielding differing sales margins).
In the first portion of this two-part discussion, we shall be looking at the revenue projections for goods.
Read more »
A few days ago I received an email from a gentleman in the healthcare industry. He had read an article that I had previously published a few years back on a well known SQL Server website. Based on the original article, he requested a few ideas on how to expand the sample code to do a rolling three-month revenue summary, in addition to a rolling three-month revenue average.
In today’s get together, we shall be looking at doing just this!
Read more »© Quest Software Inc. ALL RIGHTS RESERVED. | GDPR | Terms of Use | Privacy