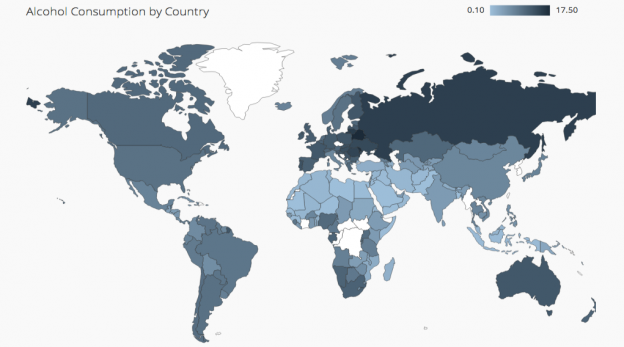
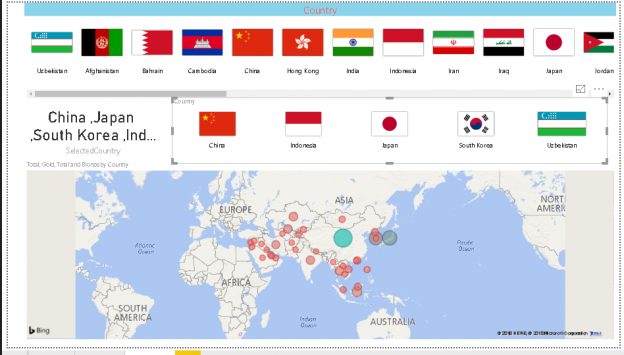
This article demonstrates Power BI visuals for visualizing Coronavirus impact worldwide using various visuals such as a filled map, Word Cloud, Slicer, Q&A.
Read more »
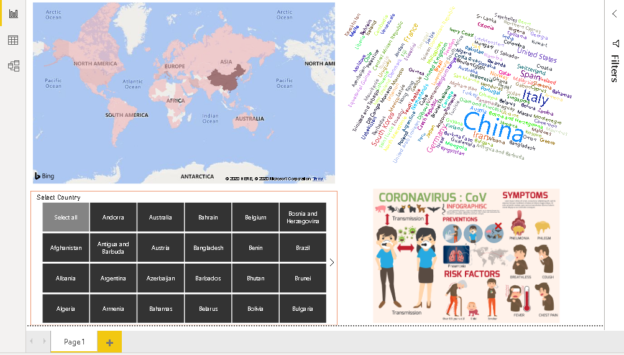
This article demonstrates Power BI visuals for visualizing Coronavirus impact worldwide using various visuals such as a filled map, Word Cloud, Slicer, Q&A.
Read more »
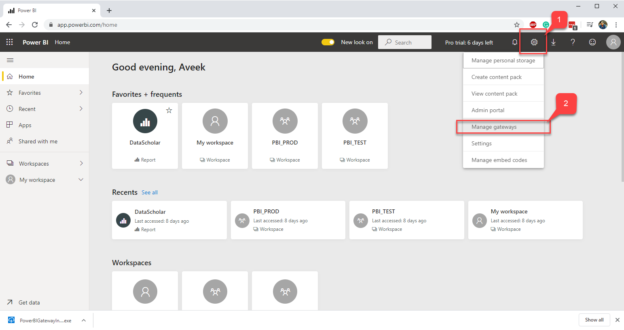
In this article, I’m going to explain what a Power BI Data Gateway is and how to set it up. I’ll also cover the underlying architecture that the gateway uses and how to manage on-premise data using the Data Gateway.
Read more »
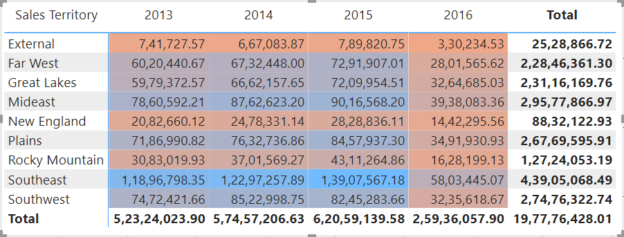
In this article, I’m going to explain what conditional formatting in Power BI is. Conditional formatting, as the name suggests, is a way of visualizing data that applies special format rules based on some pre-defined conditions on the values of a selected metric. It is mostly used when the data is presented in a tabular format; however, it can also be used in any charts such as bar charts, line charts, etc.
Read more »
In this article, I am going to explain how we can access the data from the Azure Blob Storage using Power BI. To do that, we are going to use the below tools:
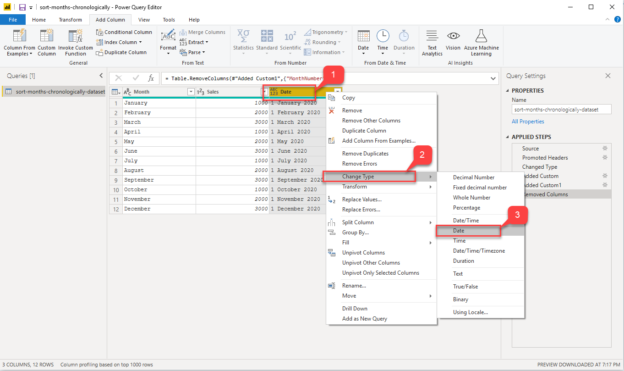
In this article, I’m going to demonstrate how to sort months chronologically in Power BI. Visualizing sales data in a time period is one of the most influential ways of reporting. Often, at times it is essential that you design charts that show the trend or growth of a metric over time. The time period can be anything for example days, weeks, months, or years. It basically gives you the idea of how the metric has increased or decreased over the specific period.
Read more »
In this article, you will see how to implement a star schema in Power BI. Microsoft Power BI is a business analytics tool used to manipulate and analyze data from a variety of sources.
Read more »
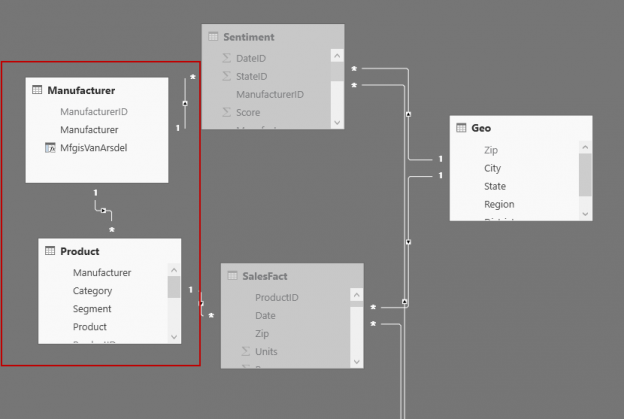
In this article, we look at how to create different types of relationships between two or more tables in the Power BI data model.
Read more »
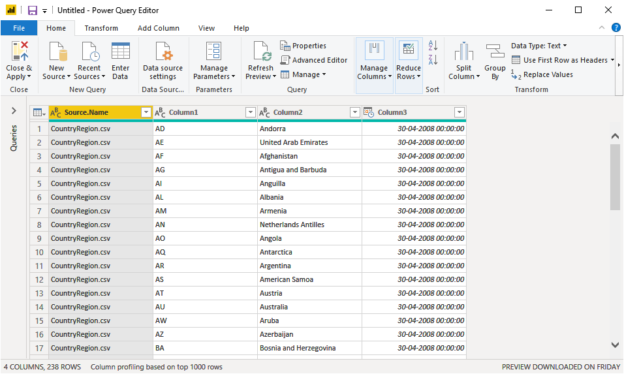
Power BI is a data analytics tool developed by Microsoft used to visualize data and find useful insights. In this article, you will see how to work with the Query Editor in Power BI desktop. Power BI comes in various versions, i.e., Power BI Desktop, Power BI Service, Power BI Mobile, and Power BI Developer. Power BI desktop is the free version, and the query editor is available in all three versions.
Read more »
Power BI Desktop provides many useful visualizations with simple configurations. You can represent data visually in different forms that help users and management in data interpretation. You can explore a broad category of Power BI articles here on SQLShack.
Read more »
Power BI is enriched with many useful visualizations and helps to represent data in various forms. We have explored many use cases of PowerBI in SQLShack articles.
Read more »
This is the fifth article of a series dedicated to discovering geographic map tools in Power BI.
Read more »
One shared characteristic among popular data visualization tools such as Power BI is the ease at which data can be extracted from a variety of disparate data sources, usually at a click of a button, as shown in Figure 1. Such convenience, though, tends to come at a cost as you often have little control over how background scripts used to extract data are generated. Yet, this should be of utmost concern for data architects and BI developers alike as rarely do you find auto-generated scripts that are efficient and optimal. In this article, join me as I put on my DBA hat and trace, monitor and review SQL batch statements that are auto-generated by the Get Data feature in Power BI using SQL Server Extended Events.
Read more »
Whilst Power BI continues to be the leading data visualisation tool in Gartner’s BI quadrant, Dynamics 365 for Customer Engagement (formerly Dynamics CRM) remains one of popular business platforms for driving sales and facilitating customer communications. Thus, an integration of Power BI into Dynamics 365 for Customer Engagement ensures that you get to explore your Dynamics 365 for Customer Engagement data via a powerful and rich data visualisation tool. However, as indicated in Figure 1, Dynamics 365 for Customer Engagement plans often come with a Power BI free license thereby limiting the type of Power BI features available to you. In this article, we look at how you can get the best out of your Power BI free license for the purposes of embedding Power BI artefacts into Dynamics 365 for Customer Engagement. Going forward, any references to Dynamics 365 for Customer Engagement plan in this article will be shortened to Dynamics 365.
Read more »
Power BI Desktop is a useful reporting and analytical tool to represent data in various formats. These presentations help us to quickly understand information and circulate it to stakeholders in a visual fashion.
Power BI Desktop amplifies the value of data. We can connect to multiple data sources and visualize the data interactively. One of the best parts of Power BI Desktop is the custom visual feature. It allows developers to create custom visuals and users can then download these visuals from the marketplace and use it as per the data set requirements. We can prepare reports using Power BI Desktop and share the reports using the Power BI service.
Read more »
Power BI Desktop helps to visualize complex data with the help of inbuilt and custom visualizations. It allows integrating data from the various data sources and preparing visualization from it.
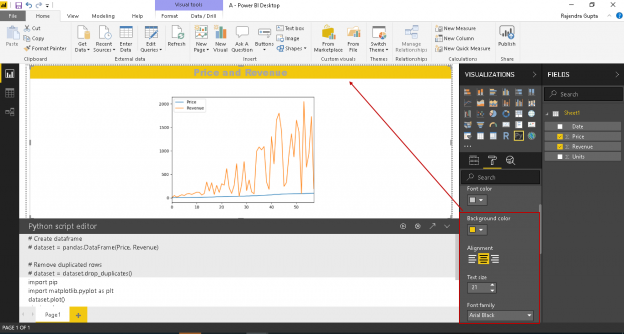
Microsoft recently integrated the Python programming language in the Power BI. Python is a powerful object-oriented language and is used by the data analyst and scientist to analyze complex datasets. We can now use the Python as a preview feature in the Power BI August 2018 release onwards. We can now use Python scripts to generate custom visualization. The combination of these technologies is akin to 1 + 1 = 3 or like the famous ad for Reese’s Peanut butter cups, when chocolate was introduced to Peanut Butter 😉
Read more »
The Q&A feature in Power BI desktop provides a way to move towards Artificial Intelligence. In my previous article, we learned about the prominent Q&A in Power BI Desktop feature. We can get the desired result from Power BI Desktop by asking a question in Natural language. It converts the result set in tabular, chart format based on the requirement. It also helps users to build the question with its intelligence. It is one of the most incredible features of Power BI.
In this article, we are going to learn how to use Power BI Desktop Q&A functionality to enable users to ask the question from the data set and easily get the results without any configuration or write complex codes.
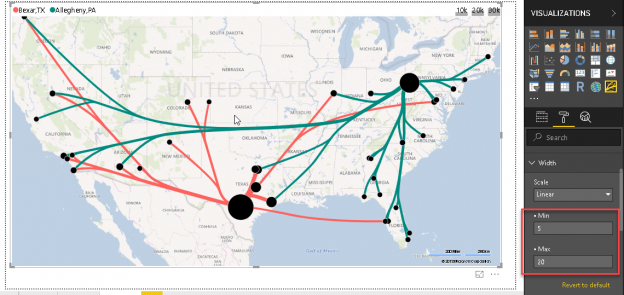
In this article, we will explore the Flow Map chart in Power BI Desktop. Power BI is helpful to visualize the data through various form of the inbuilt and the custom charts. We have explored few such important charts in previous articles. Below is the list of articles for reference

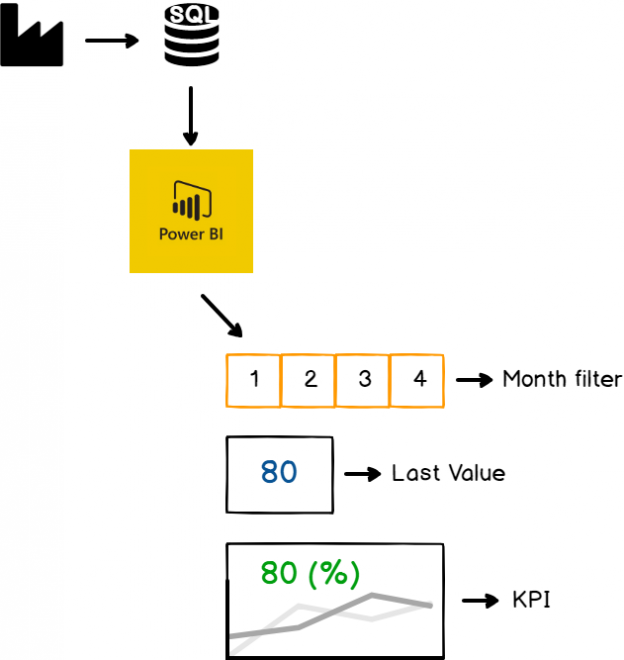
In this article, we will learn Key Performance Indicators usage in Power BI and solve a business case problem through Power BI.
Read more »
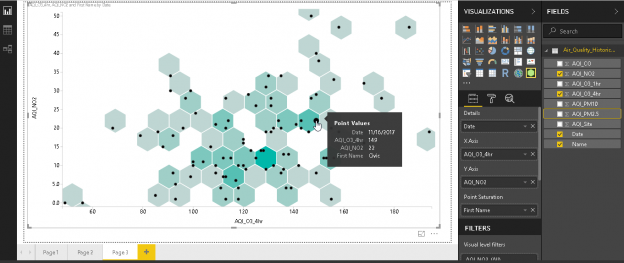
Power BI has a rich set of visuals to represent data according to our requirements. These custom visuals make it easy for us to highlight data effectively to understand and share the data in reports. We have learned many customized visuals so far in ongoing series of Power BI Desktop.
Read more »
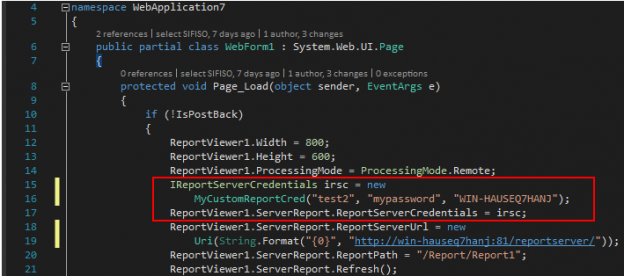
In the article, How to embed a Power BI Report Server report into an ASP.Net web application, we looked at available options for embedding a Power BI Report Server report into an ASP.NET web application. Since the publication of the article, I have received several questions relating to how one goes about programmatically passing credentials for report server connection within an embedded Power BI Report Server report. The simple answer to such questions is that it is currently not possible to implement user impersonation in an embedded Power BI Report Server. However, like in most scenarios, there are workarounds that one could temporarily employ – at least until Microsoft comes up with a permanent solution to what is becoming a top requested feature at ideas.powerbi.com.
Read more »
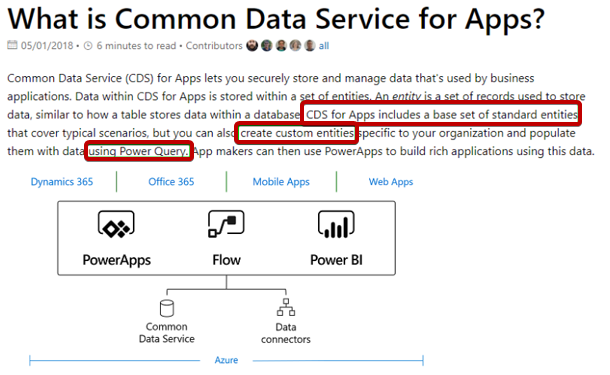
CDS for Apps VS Power Query – is there a difference? If so, what is that difference? Are they mutually exclusive or complement each other? Later I briefly outline Common Data Services for Analytics no, Power BI Datapools no again, actually Power BI Data Flows. It is difficult to keep up with the correct naming.
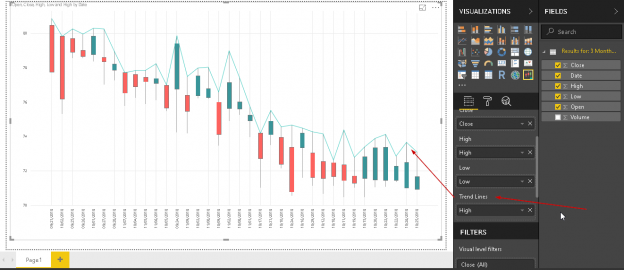
Candlestick chart for stock data analysis in Power BI Desktop
Power BI Desktop contains a wide range of custom visualizations which helps to represent and analysis of the data with extensive formatting options. You can effectively showcase your data and save time as well by creating complex data chart with simple configuration options.
Read more »
We have explored useful visualizations in Power BI Desktop with my previous articles that covered:
Read more »© Quest Software Inc. ALL RIGHTS RESERVED. | GDPR | Terms of Use | Privacy