
Power BI is a data analytics tool developed by Microsoft used to visualize data and find useful insights. In this article, you will see how to work with the Query Editor in Power BI desktop. Power BI comes in various versions, i.e., Power BI Desktop, Power BI Service, Power BI Mobile, and Power BI Developer. Power BI desktop is the free version, and the query editor is available in all three versions.
Power BI Desktop has several components to transform, model, and visualize data and also generate reports from data. The Query Editor in Power BI is used to transform or edit data files before they are actually loaded into the Power BI.
The Query Editor plays the role of an intermediate data container where you can modify data by selecting rows and columns, splitting rows and columns, pivoting and unpivoting columns, etc. The changes made by the Query Editor in Power BI are not reflected in the actual dataset. Once you have pre-processed the data and have transformed it into the required format, you can load the data into the Power BI environment.
In this article, you will see how to use the Query Editor in Power BI desktop to transform data and then load it into the Power BI desktop.
Connecting Power BI to a Data Source
Before you can reprocess data using Query Editor in Power BI, you have to connect Power BI to a data source. Power BI can take data from various data sources such as MS Excel, Text/CSV, SQL Server, Web, etc. In this article, you will see how to connect to a data source located on the internet.
If you are working with a SQL dataset see this article.
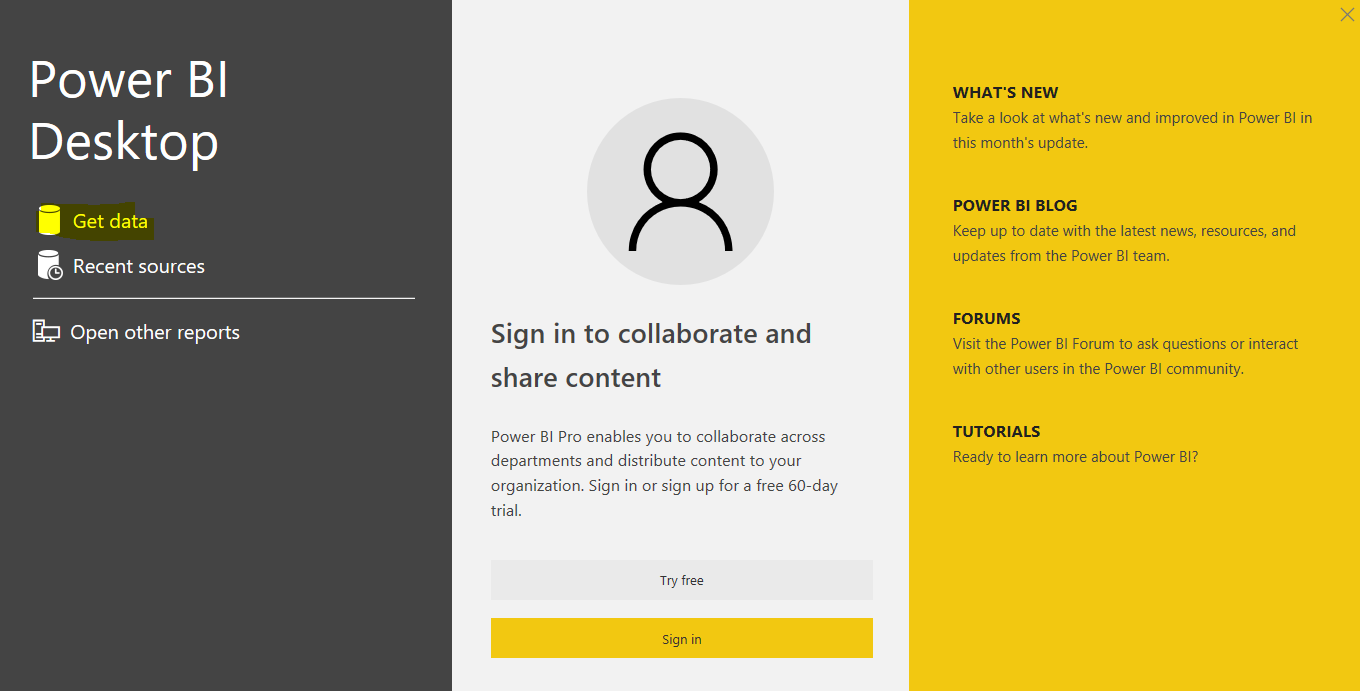
To do so, open Power BI Desktop and from the Sign In dialogue box shown below, select on the “Get data” button located on the left-hand side of the dialogue box.
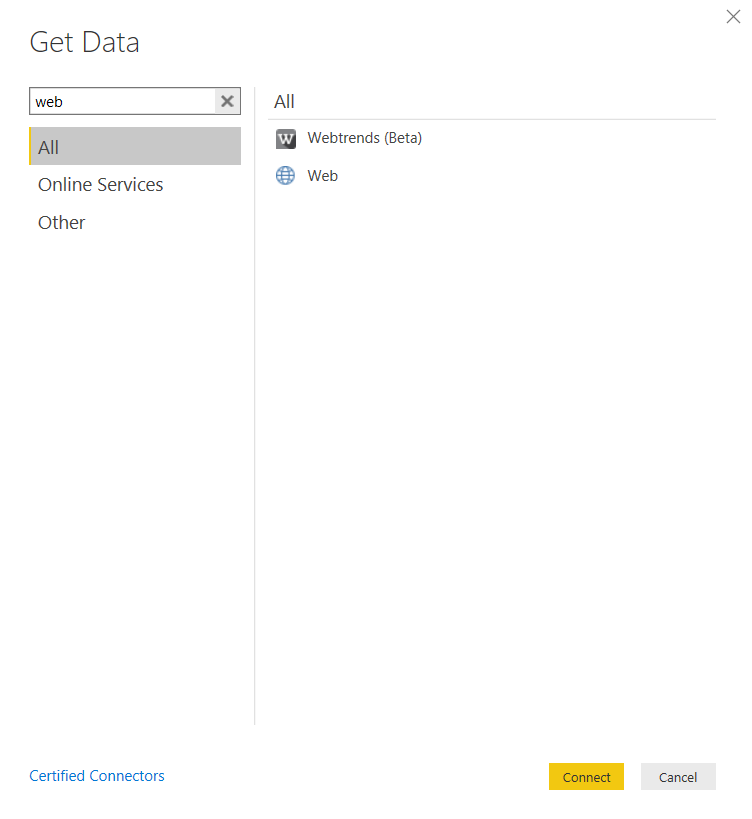
A window will appear listing all the data sources for Power BI. Type “web” in the search box. You will see the “Web” data source appear in the All data source list. Select “Web” and click the “connect” button, as shown in the following screenshot:
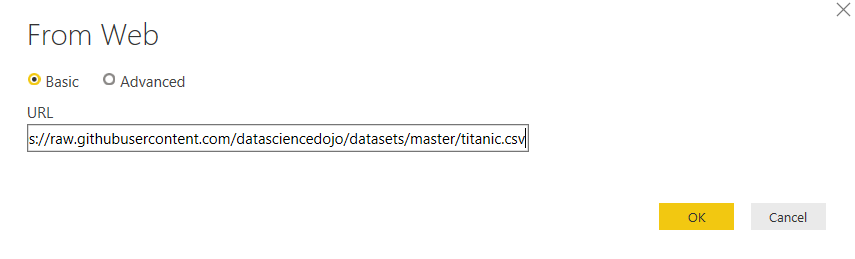
You will see the following dialogue box. In the URL field, enter the following URL:
https://raw.githubusercontent.com/datasciencedojo/datasets/master/titanic.csv
This URL points to a CSV file located at Github. The file contains the Titanic dataset, which contains information about the passengers who traveled on the unfortunate ship Titanic that sank in 1912.
Power BI might take some time to establish a connection with the online data source depending upon the size of the file. Once the connection is established, you should see the following window:
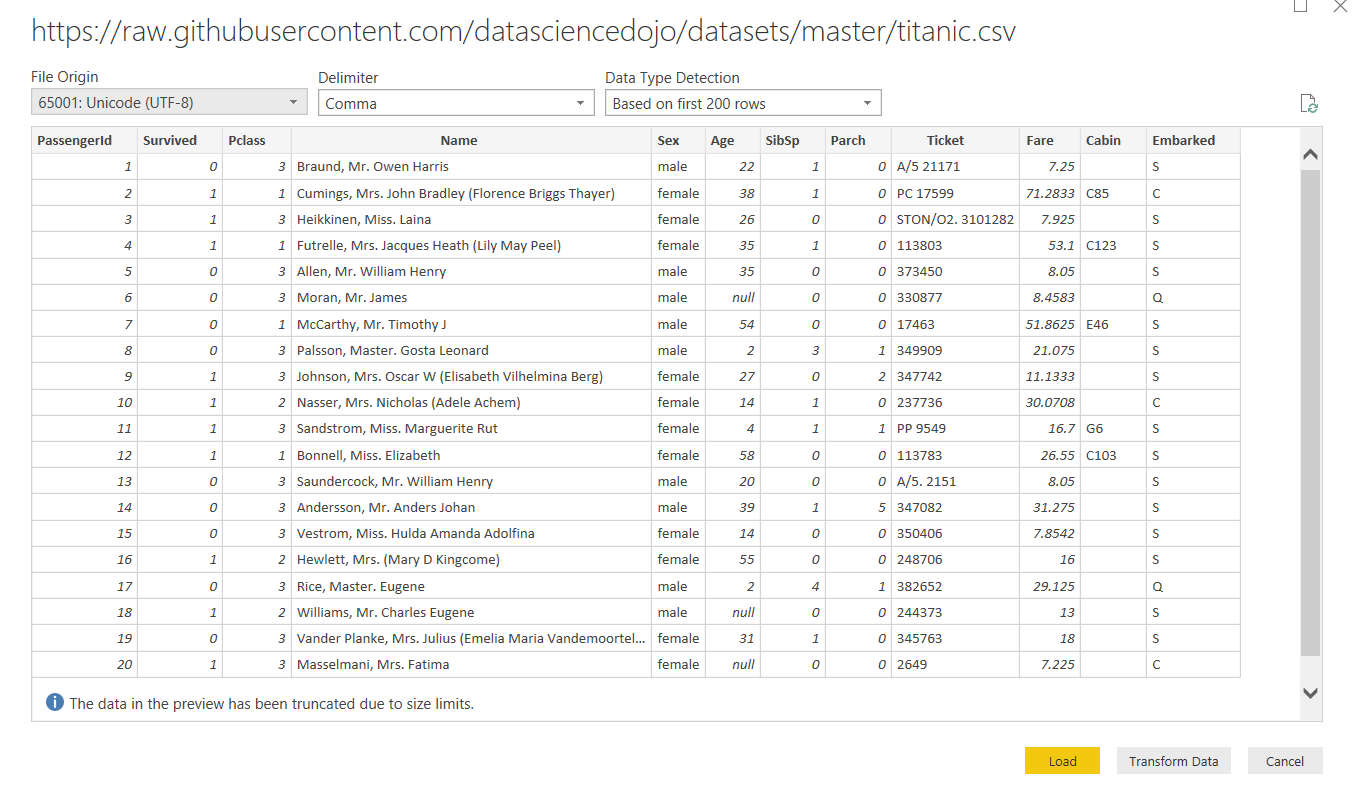
At this point in time, if you click the “Load Button”, the dataset will be loaded into Power BI. If you want to open the data in the Query Editor in Power BI and perform some pre-processing, you need to click the “Transform Data” button.
Data opened in the Query Window looks like this:
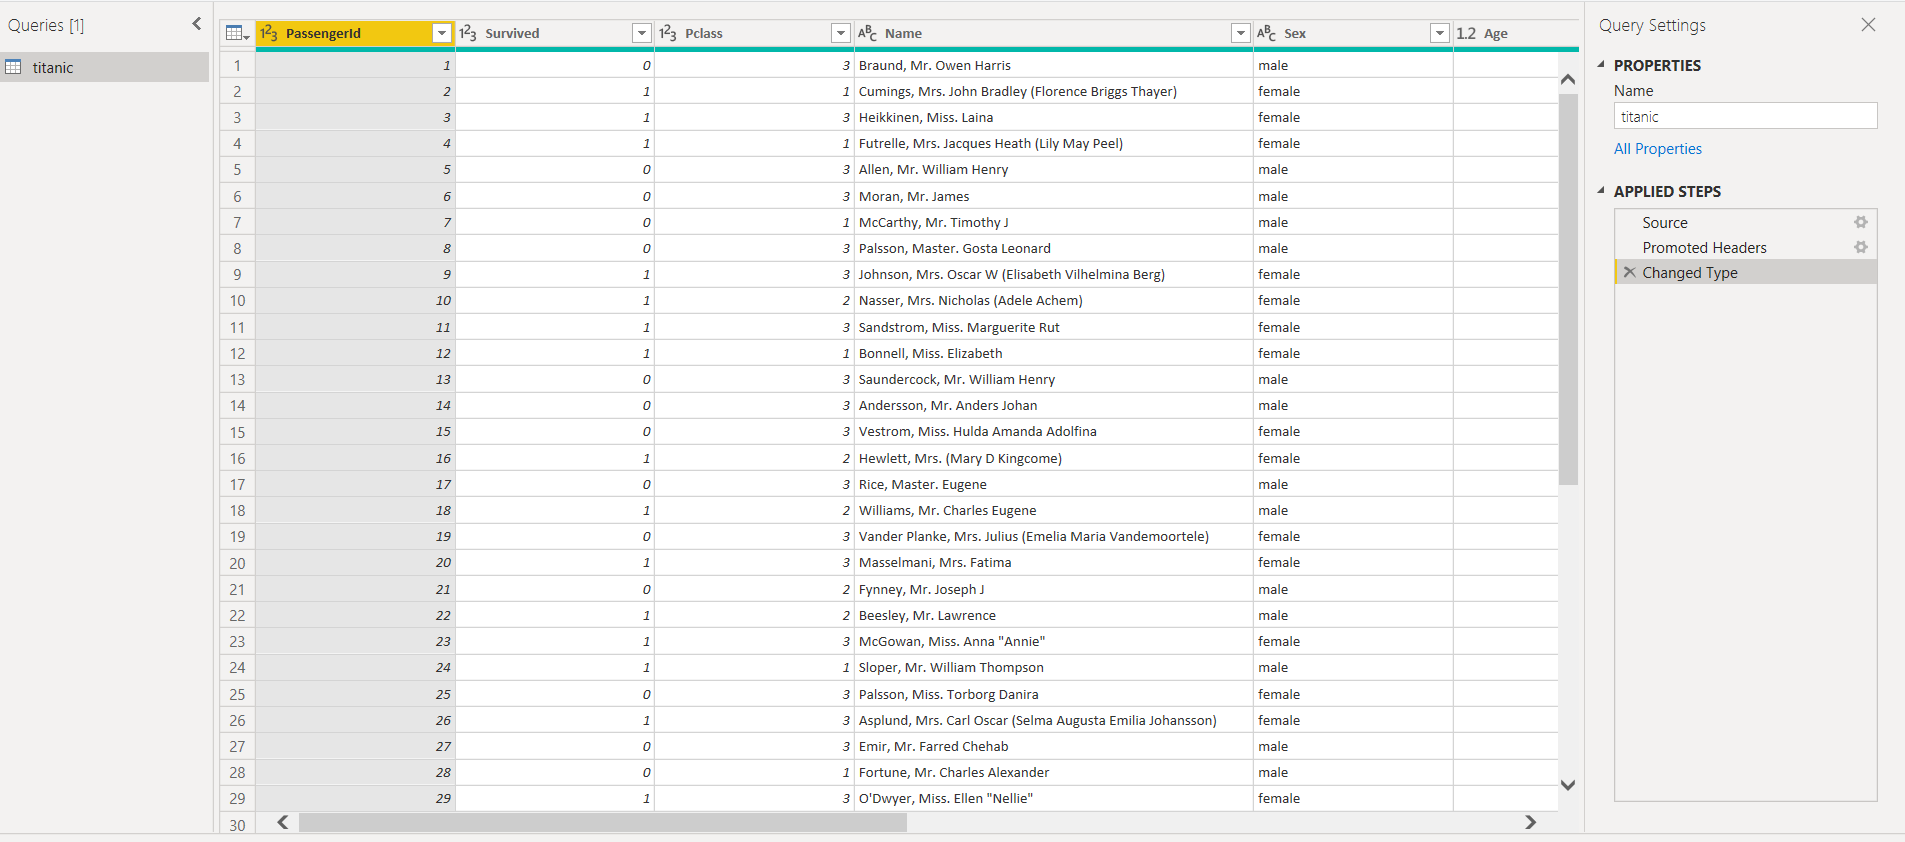
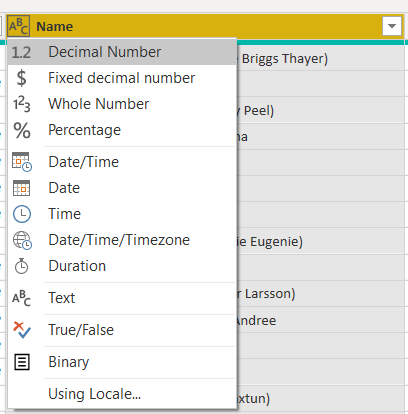
You can see all the columns in your dataset along with the column type. For instance, the Name column has type ABC, which means the column contains the text. You can actually click on the column type to see all the column types and their names as shown in the following screenshot:
Working with Query Editor
Now that we have opened the data in the Query Editor in Power BI, we can apply several pre-processing functions on the data. Let’s see some of these functions:
Removing and filtering rows
Query editor allows you to remove or filter the rows from a dataset.
Removing rows with Null values
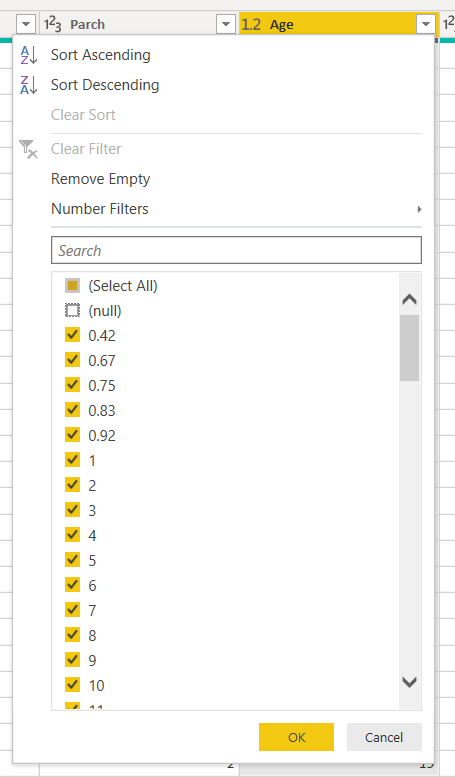
If you look at the Titanic dataset in the Query Editor, you can see that the Age column contains some null values as shown below:
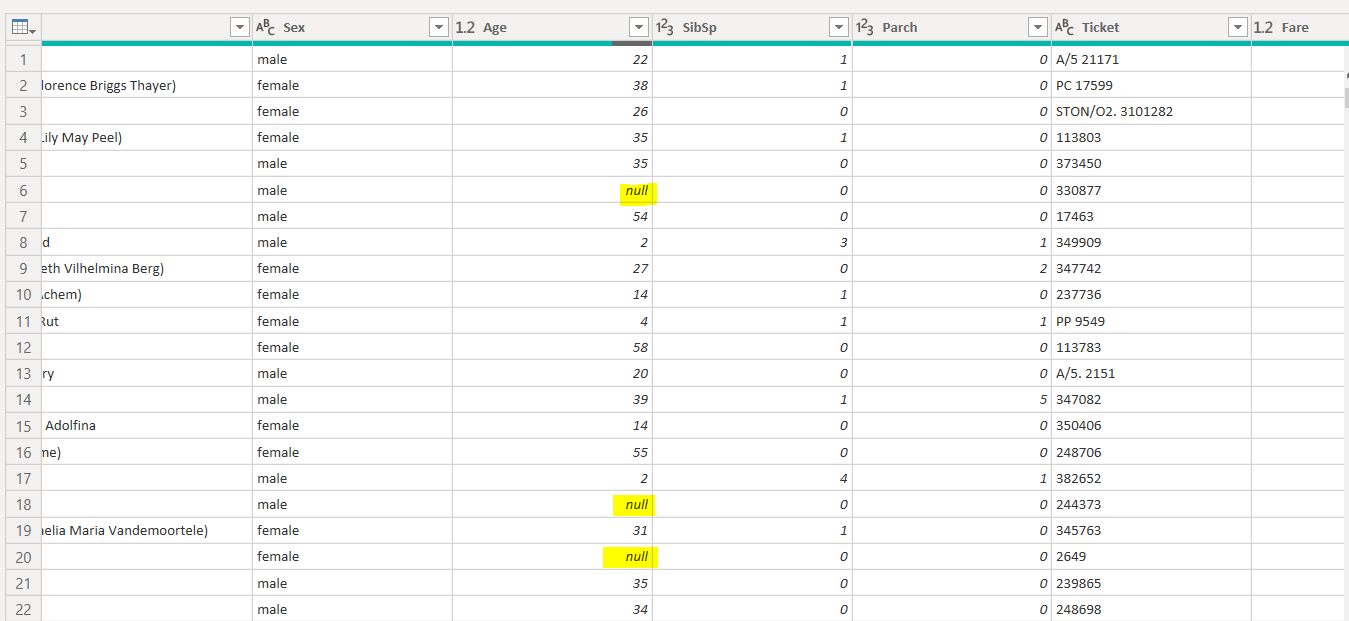
You can remove the rows where Age contains null values. To do so, click on the button containing the inverted triangle at the extreme right of the Age column. And then uncheck the “null” from the list of all the unique values in the age column as shown below:
Click the OK button, and you will see that the rows where the Age column contains null values have been removed.
Removing rows with blank values
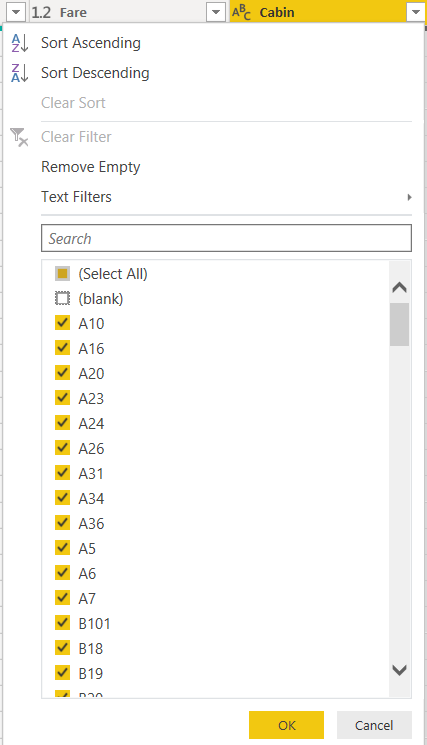
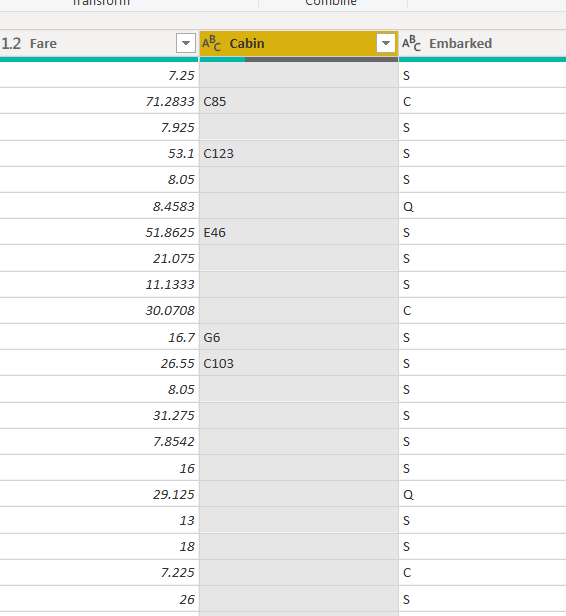
Similarly, you can repeat the same procedure to remove the rows where the Cabin column contains blank rows, as shown below:
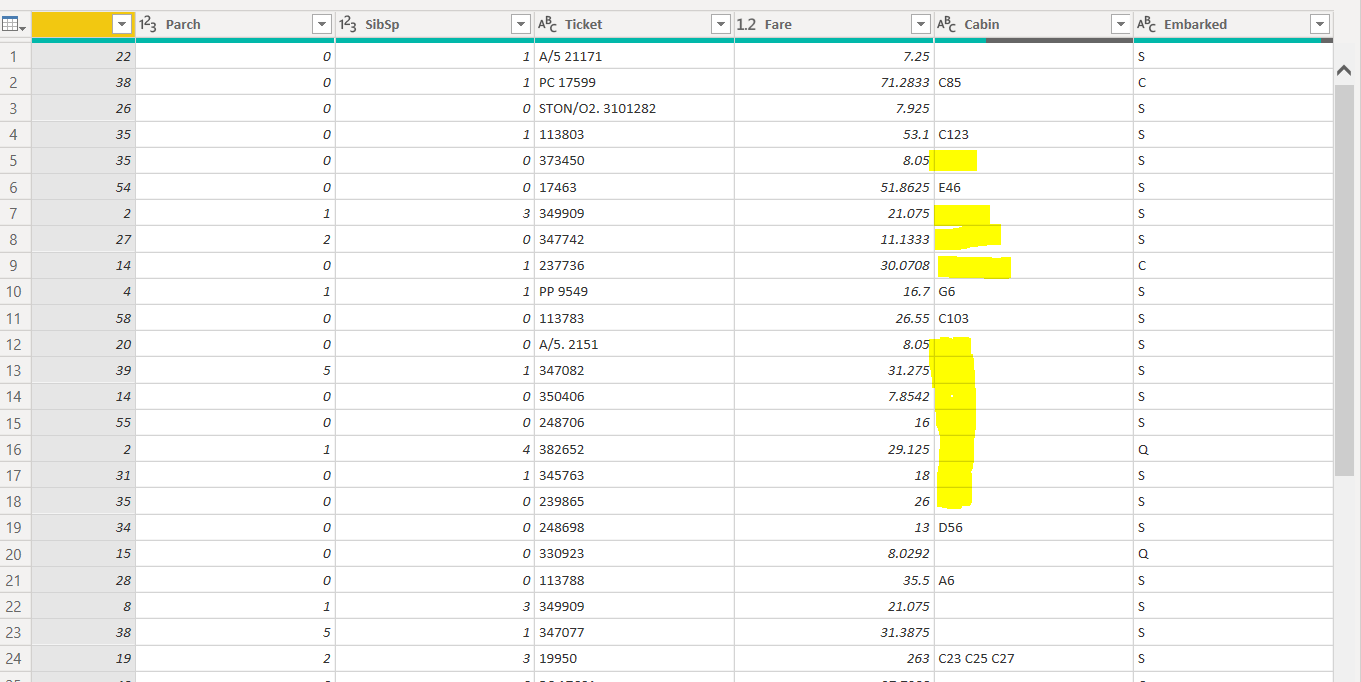
You have to again open the list of unique values for the Cabin column and then uncheck the checkbox to the left of the “blank” option.
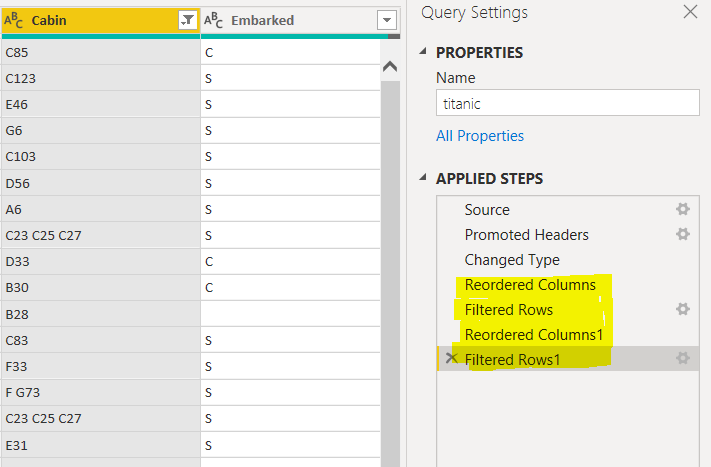
Click the OK button and you will see that all the rows where the Cabin column contains empty values will be removed.
You can also undo the operations that you perform on your dataset in Query Editor in Power BI. In the “APPLIED STEPS” window in the following screenshot, you can see the operations that you have performed on the dataset. You can remove the operations by clicking the cross icon to the left of each step.
Filtering rows based on condition
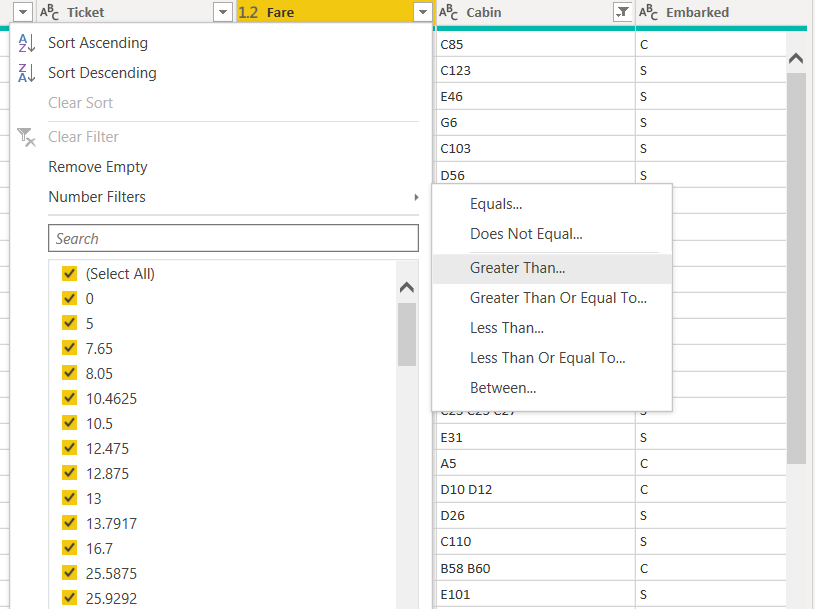
You can also remove rows based on values in a particular column. For instance, if you want to only keep the rows where the Fare column has values either greater than 40 or less than 10, you can use the Number Filter property. To do so, click on the triangle on the left of the Fare column name and then click on the “Number Filters” property. A dropdown list will pop up, select “Greater Than” from the list as shown below:
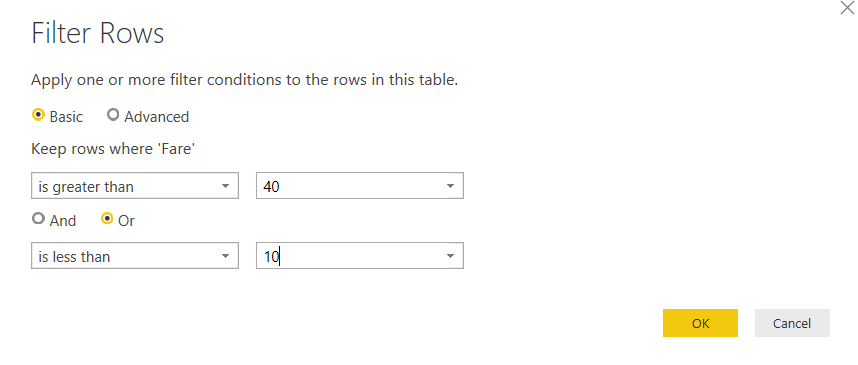
You should see the following window. Add 40 and 10 in the corresponding fields and click OK button. You will see that the dataset will now contain only the rows where the Fare column has a value greater than 40 or less than 10.
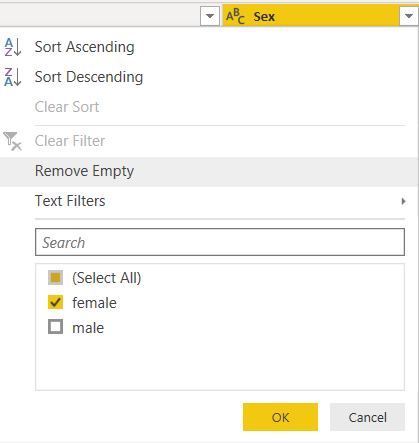
You can also apply filters on the text column. For instance, if you only want to keep the records of the Female passengers, uncheck “male” checkbox from the Sex column filters, as shown below.
Removing columns
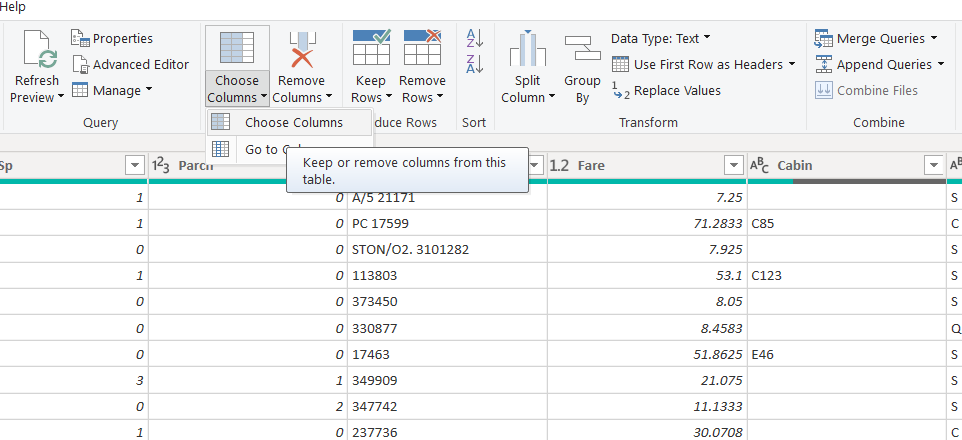
Like rows, you can also remove columns that you do not want in your dataset. For instance, the Cabin column in the Titanic dataset contains many null values. We can remove it. To do so, click the “Choose Column -> Choose Columns” option from the top menu, as shown below.
You will see a list of all the columns in your dataset. Uncheck the checkbox to the left of the column that you want to delete as shown below:
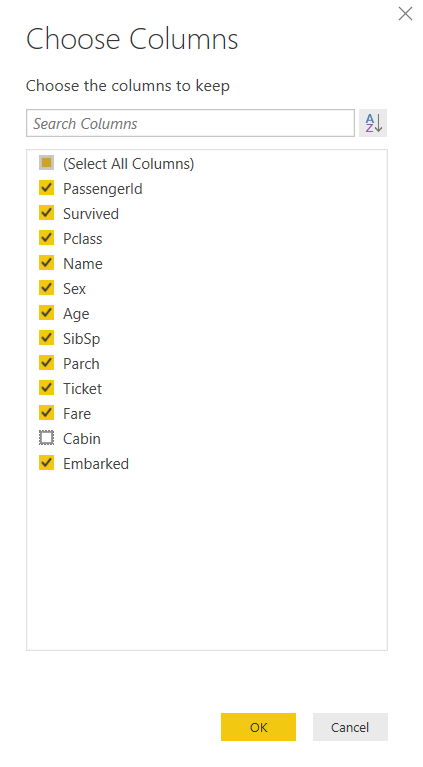
Click the “OK” button and you will see that the Cabin column has been removed from the dataset.
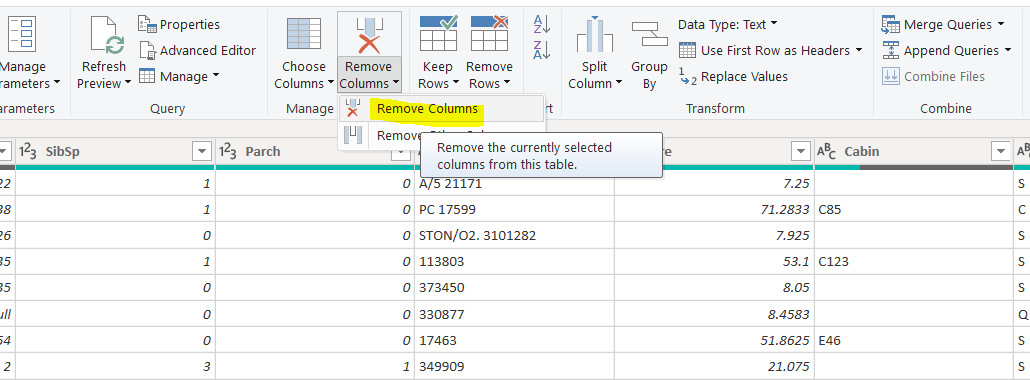
Another way to remove a column is by simply selecting the column and then clicking the “Remove Columns -> Remove Columns” option from the top menu, as shown in the following two screenshots:
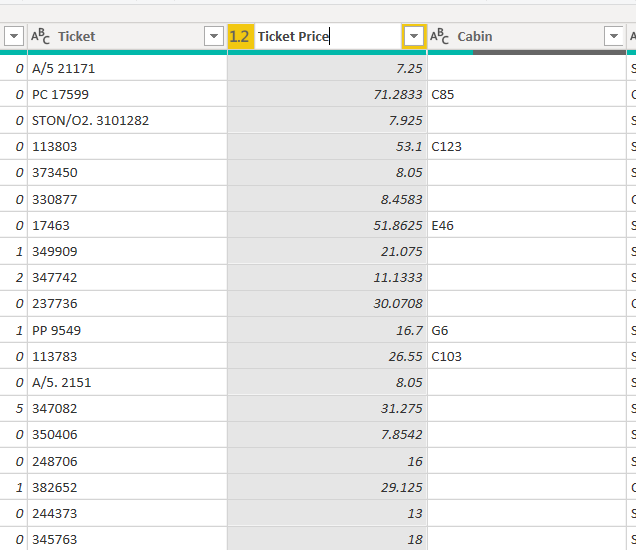
You can also rename a column. To do so, simply double click the column header and write the new name of the column. For instance, in the following screenshot, the Fare column has been renamed as Ticket Price.
Replacing values
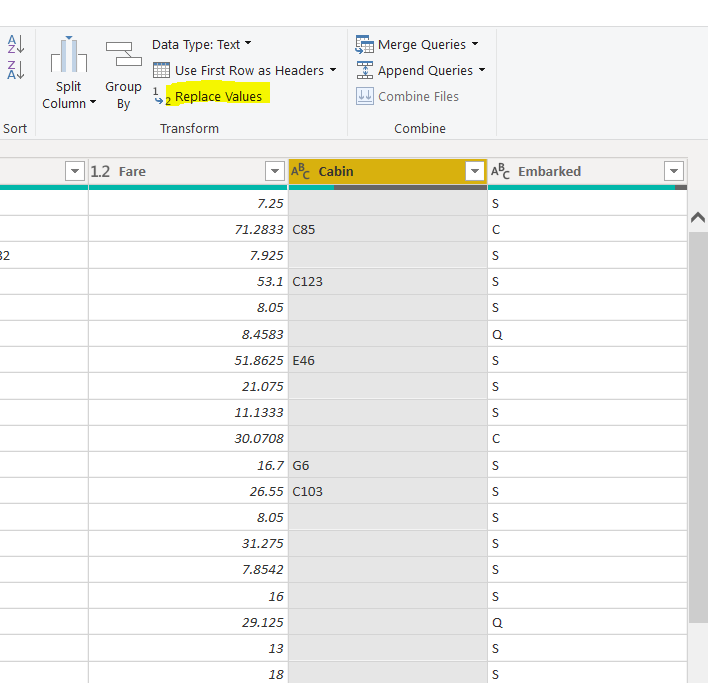
You can replace values in a particular column via the Query Editor in Power BI. For instance, to replace the blank rows in the Cabin column containing a null value, you first need to select the Cabin column and then click the Replace Value option from the top menu as shown below:
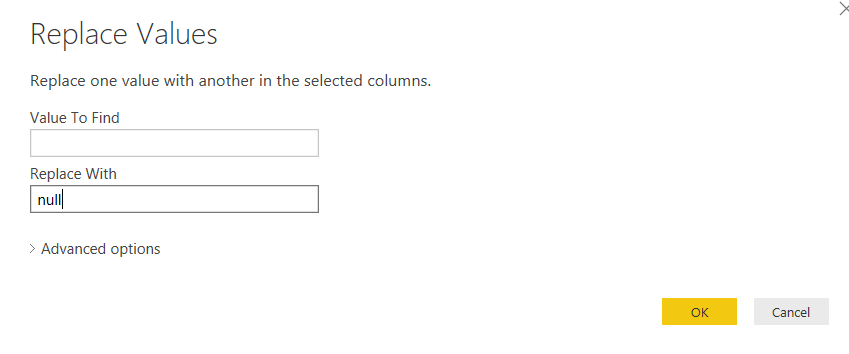
You will see the following window. Here you can specify the original value and the new value in the “Value To Find”, and “Replace With” fields, respectively.
Here is a screenshot of the output:
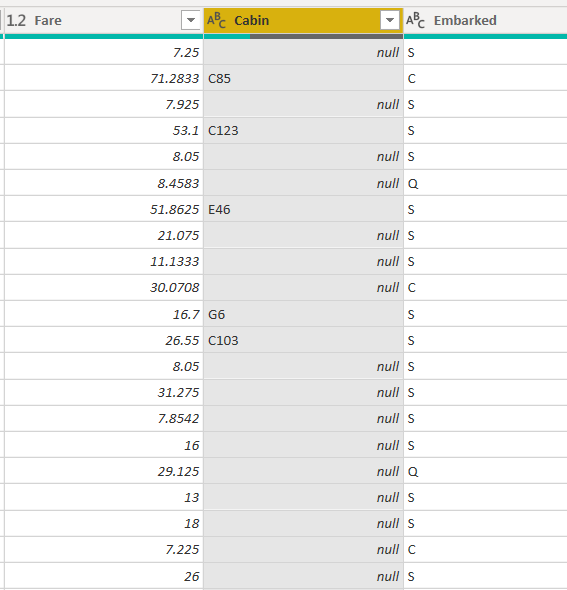
You can see that blank values have been replaced by null values.
Splitting columns
You can split one column into more using a number of different options.
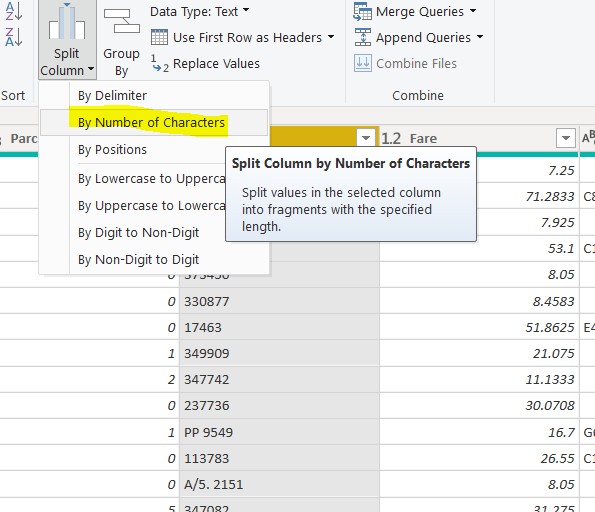
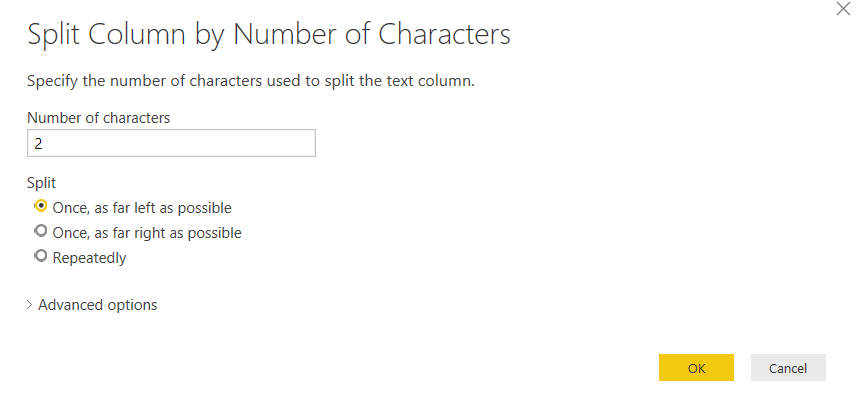
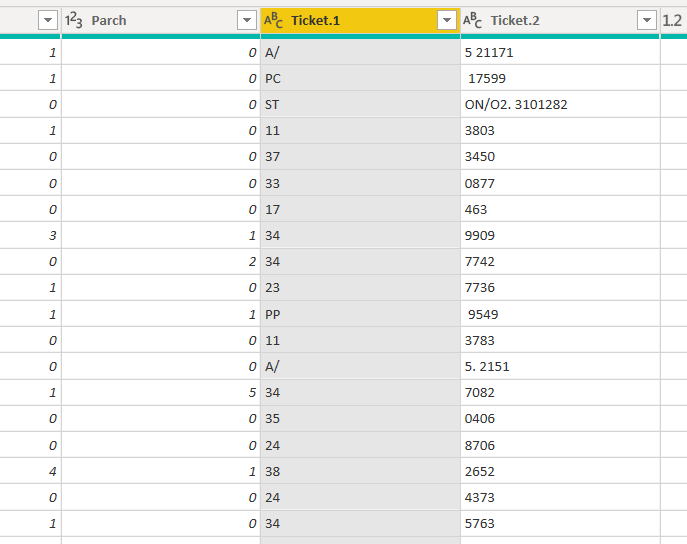
For example, if you want to split the Ticket column into two columns where the first new column contains the first 2 characters of the original column and the second new column contains the remaining characters from the original column, you need to select the Ticket column and then click “Split Column -> By Number of Characters” option from the top menu as shown below:

Next, specify the number of characters after which you want to split the values in the original column, as shown below:
Once you split the columns, you should see two new columns, Ticket.1 and Ticket.2, as shown below:
Conclusion
Query Editor in Power BI is a very useful tool to transform data before it is actually loaded into the Power BI environment. In this article, we covered some of the most basic Query Editor in Power BI operations. We saw how to remove and filter rows and columns, how to replace values in the dataset and how to split columns based on certain conditions.

View all posts by Ben Richardson
- Working with the SQL MIN function in SQL Server - May 12, 2022
- SQL percentage calculation examples in SQL Server - January 19, 2022
- Working with Power BI report themes - February 25, 2021