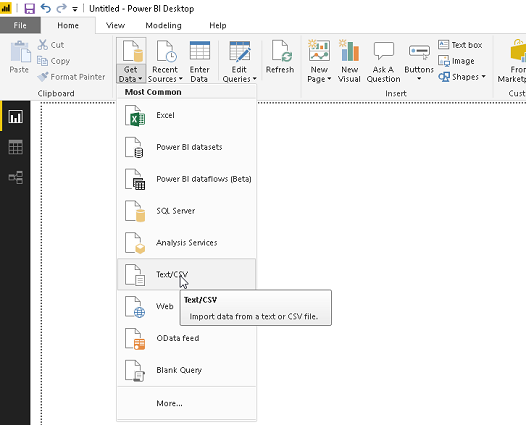
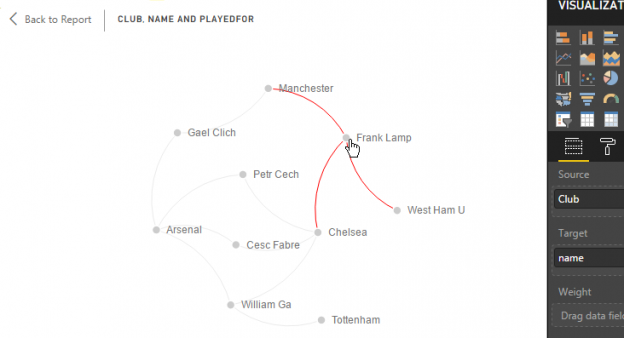
In this article, we will discover how to find the associations and hidden patterns in a dataset. The tool we will use for this is Power BI and not use any statistical functions or calculation.
Explanation
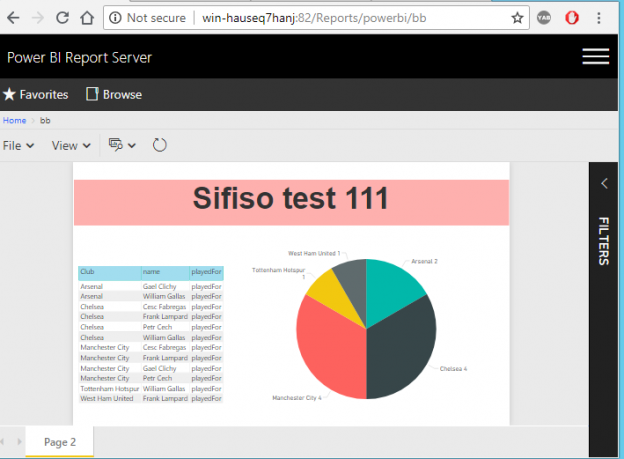
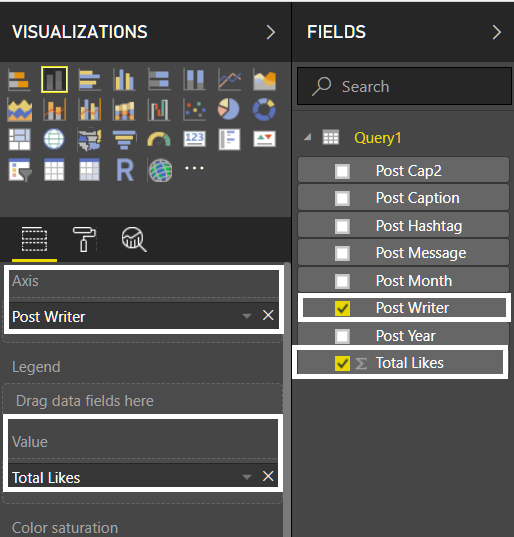
Power BI is one of the most powerful business intelligence solutions in the market. A cloud-based, user-friendly interface and basic development abilities provide this solution to be more convenient for people to use.
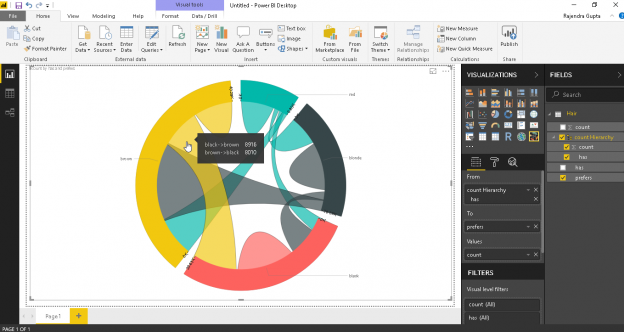
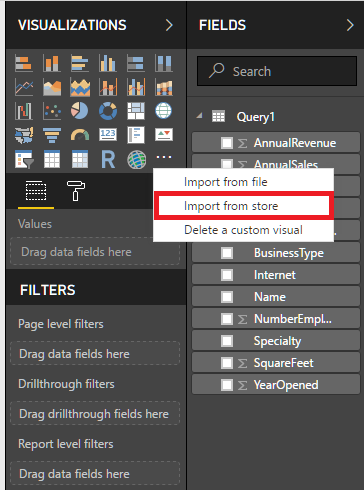
As you may know, Microsoft now supports R script in SQL Server and Power BI. R script support opens magical gates of statistics world to Power BI. Custom Visual offers very useful and interesting visual components for Power BI. In this store, many useful visualizations have been created by Microsoft or the community itself. Some of these visuals use R script infrastructure and this feature allows us to create advanced visual analytic in Power BI. Only a Power BI account is enough to connect and download theses visuals. We will use these visuals in our examples.
Read more »