

In this article, we look at how to create different types of relationships between two or more tables in the Power BI data model.
Anyone who has worked with a relational database management system knows that tables are related to each other via foreign key constraints. Table relationships are implemented to normalize the database, which is crucial to data integrity and avoids data duplication.
There are four main types of relationships between database tables: One to Many, Many to One, Many to Many, and One to One. A full explanation of these types is beyond the scope of this article. See Learn SQL: Types of relations article for a full explanation.
Creating a dummy dataset
In this section, a dummy dataset will be created in SQL Server. In the next section, you will see how to connect Power BI with SQL Server and then import the dummy dataset into Power BI. We will create a simple database for a fictional book store. The name of the database will be the BookStore.
For details of creating a dummy dataset, please refer to the ‘Creating A Dummy Database’ section of SQL JOIN TABLES: Working with Queries in SQL Server
Setting Autodetect Relationships to False
By default, depending upon the column names of the table, Power BI may assume relationships between different tables by default. We do not want that.
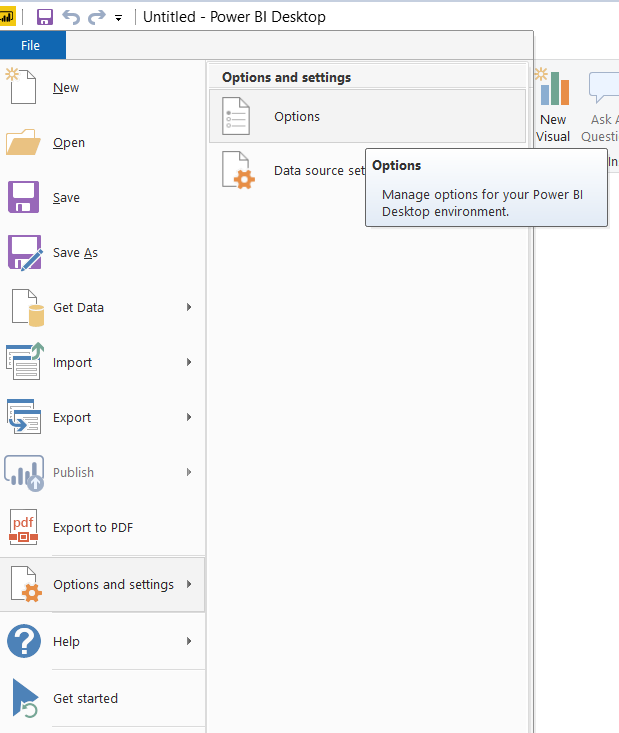
To disable this option, on Power BI Desktop, go to “File -> Options & Settings -> Options” as shown below:
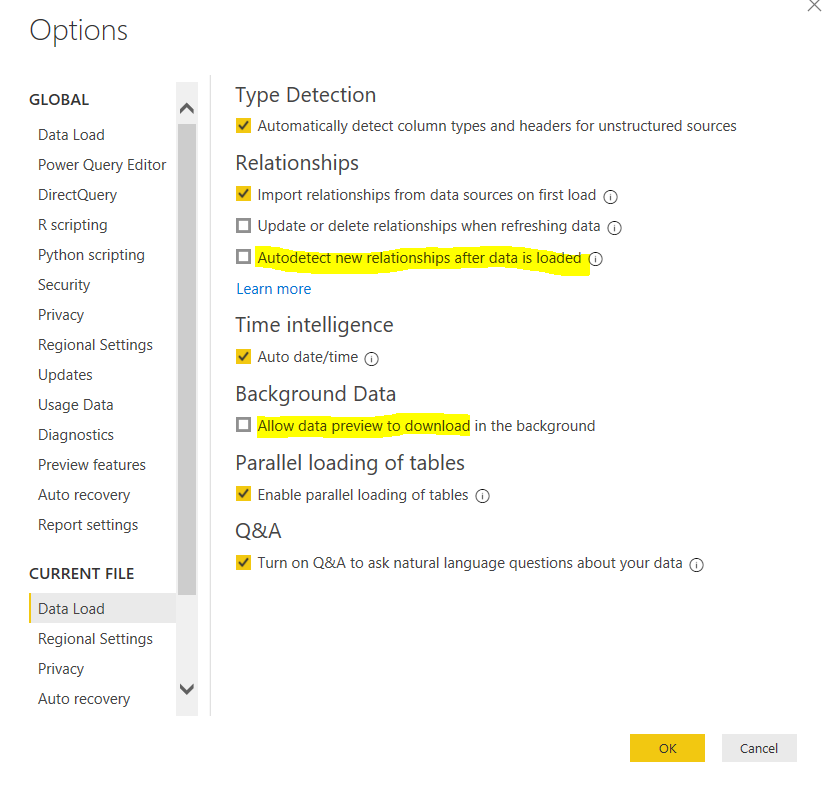
From the dialogue box that appears, uncheck the option “Autodetect new relationships after data is loaded” option as shown in the following screenshot:
Connecting Power BI with SQL Server
We have created a dummy dataset; the next step is to connect Power BI with SQL Server and then to import the BookStore dataset into Power BI. To see the detailed explanation for how to connect Power BI with SQL Server, have a look at this article.
Implementing Relationships in the Power BI Data Model
It is extremely easy to create relationships between two or more tables in a Power BI data model.
Let’s first see the effect on the visualization when there is no relationship between tables.
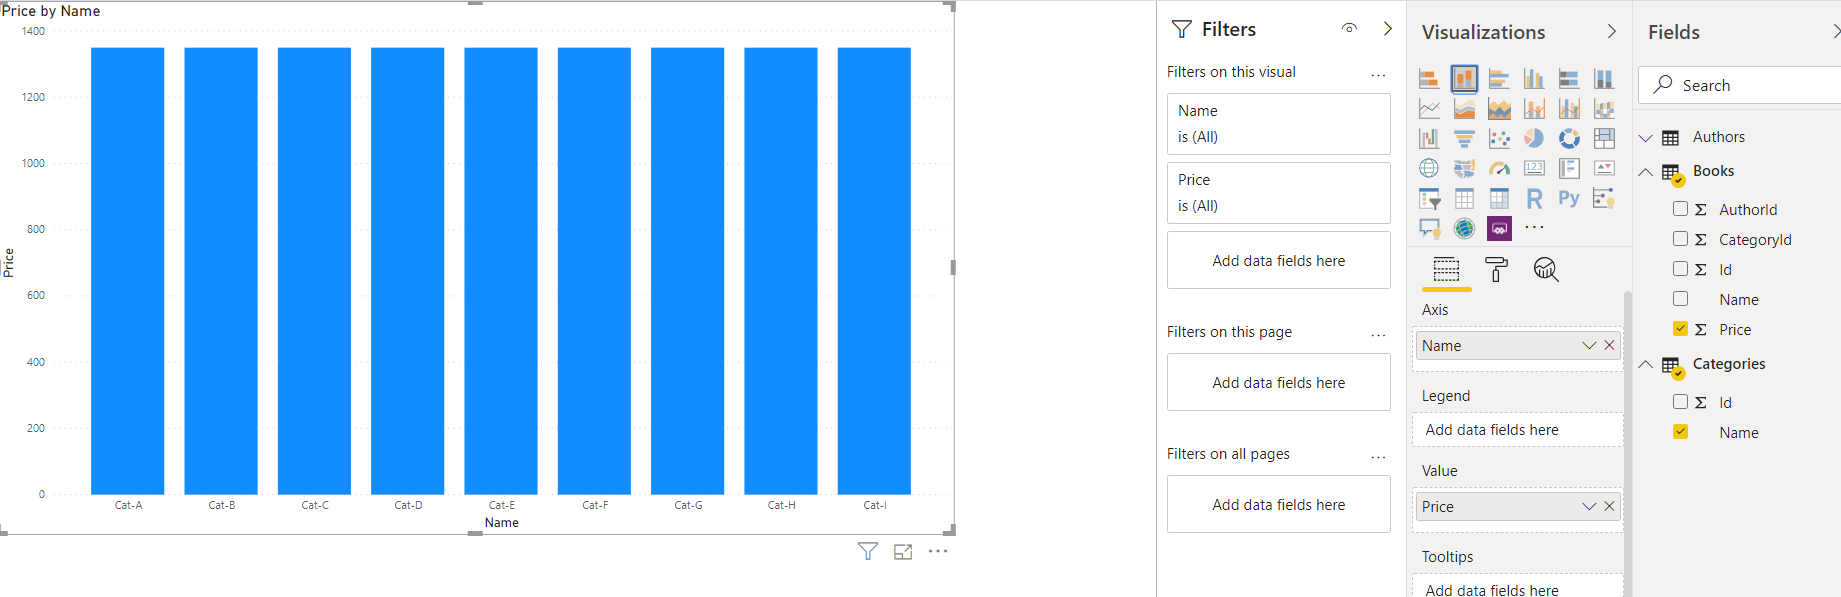
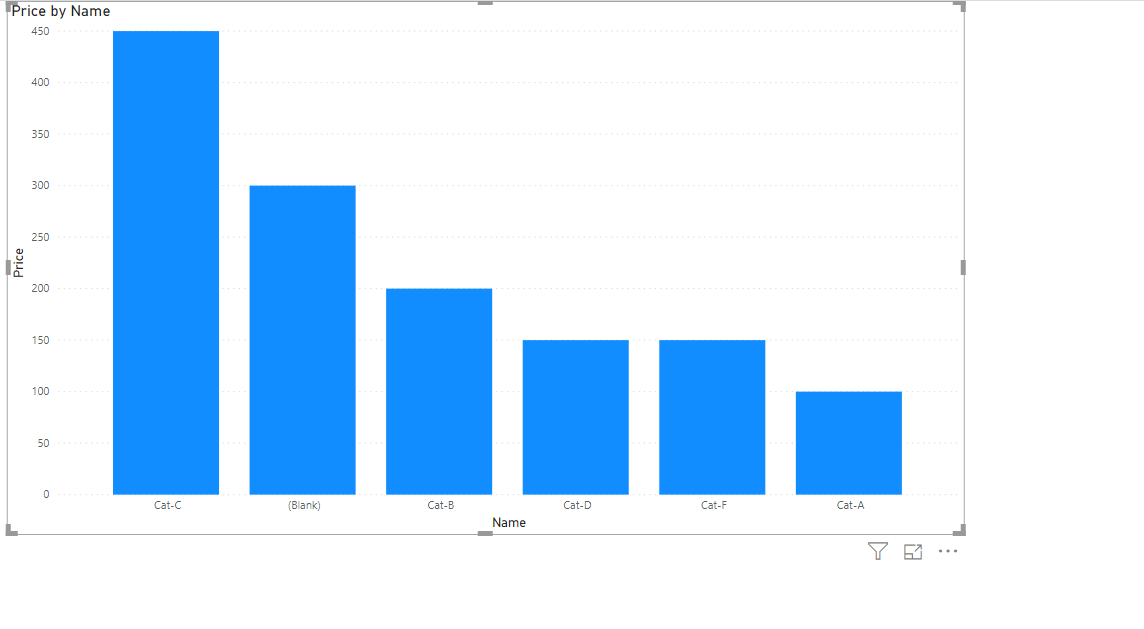
In the figure below, we plot a “Stacked Bar” chart where the x-axis contains the names from the Categories table and the bars correspond to the price of the book. Since there is no relationship between the Books and Categories columns currently in our Power BI data model the bars show the total price for all the books against all the category names. We want to show the price of books per category. To do so, we need to define a relationship between Books and Categories tables:
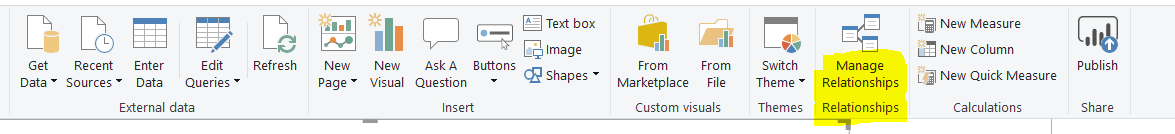
To define a relationship, click the “Manage Relationships” option from the top menu as shown below:
You should see the following window. Since there no relationship exists between the tables in the dataset, the window is empty:
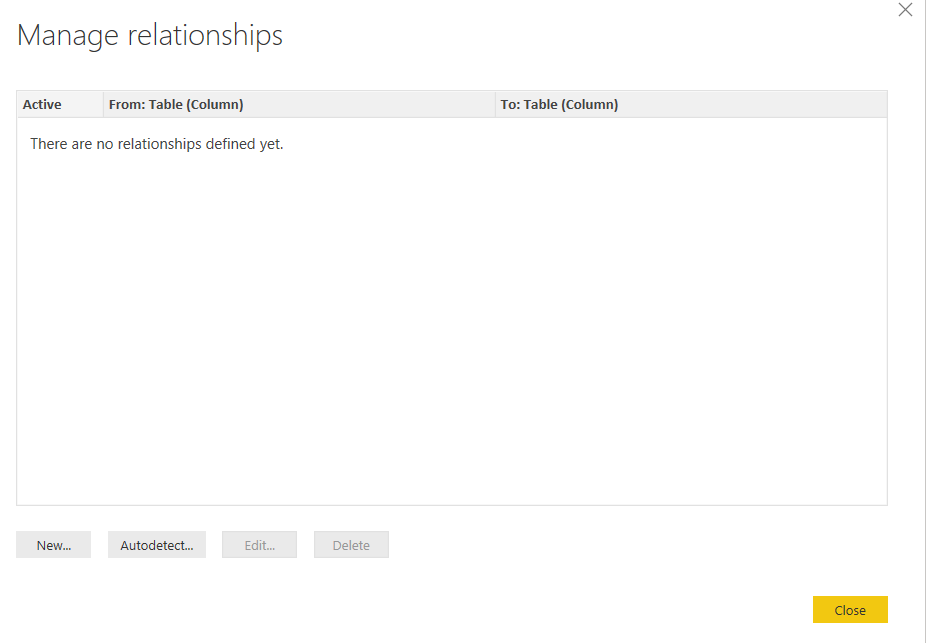
Click the “New” button from the above window to create a new relationship.
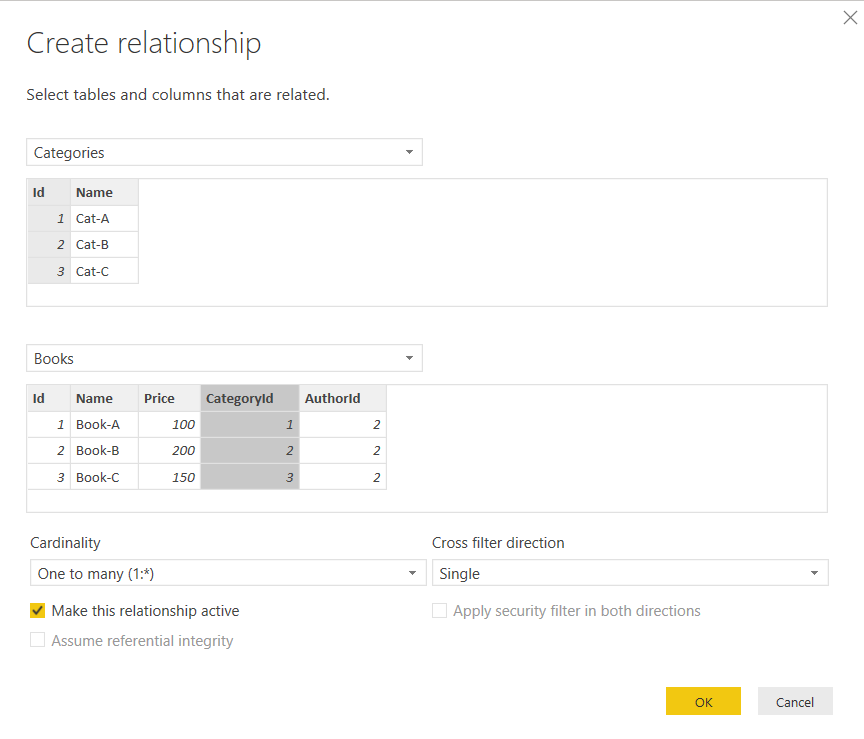
In this window select the first table from the dropdown list at the top and then click on the column name on which you want to implement the relationship. In the figure below, we select “Categories” as the first table name and “Id” as the column name.
From the second dropdown list, we select the “Books” column and select “CategoryId” as the column used to implement a one-to-many relationship between “Categories” and “Books” table.
Finally, you need to specify the type of relationship via the cardinality dropdown list, which in our case will be “One to Many”. Look at the following figure for reference:
Once you click the “Ok” button, you will see that your bar stacked plot will be updated automatically to reflect the new relationship. Now you can see the price of books per category:
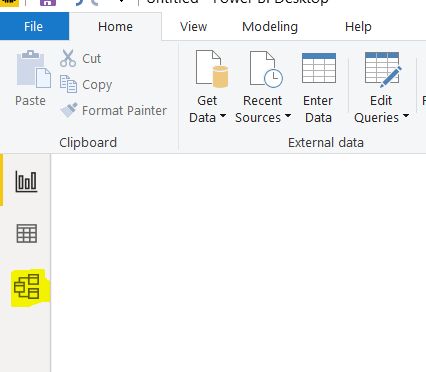
Another way to implement a relationship between two entities in a Power BI data model is by going to the “Relationship” view, which is the third option in the vertical list of options on the left-hand side of Power BI. The option is highlighted in yellow in the following screenshot:
Once you click the relationship view, you will see the following window:
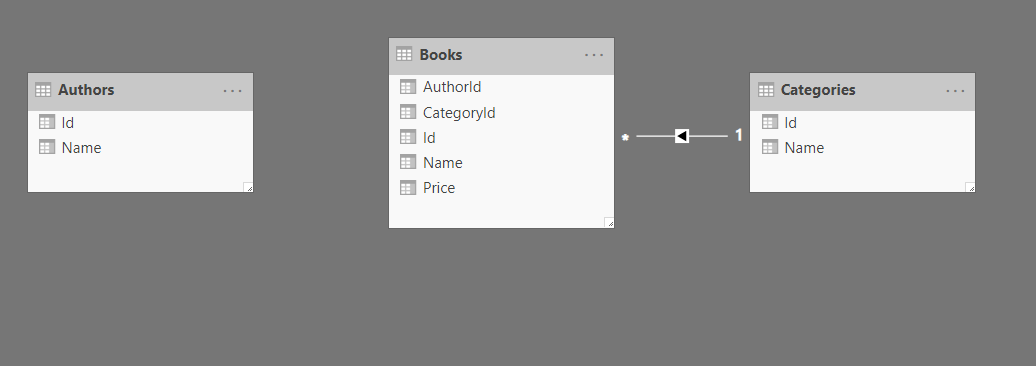
You can see the new relationship between the “Books” and “Categories” table that we just created in our Power BI data model.
As is the case above, sometimes the relationship might not be located so that it is lined up precisely between two fields. If you are ever unsure and want to quickly check a relationship, remember when you click on the relationship line will then be able to see that fields that are part of the relationship as they will be highlighted in yellow.
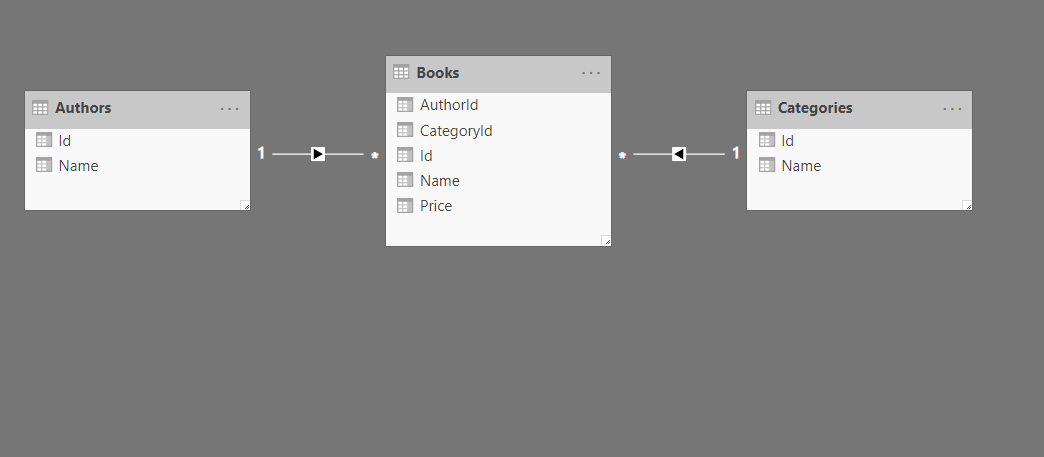
To create a one-to-many relationship between the Authors and Books tables, click where “Id” shows below “Authors” and drag it to the “AuthorId” column of the books table. Once you do that, you should see a relationship between Authors and Books as well, as shown below:
Conclusion
Relational databases contain relationships between multiple tables. Power BI also allows you to create similar relations in the Power BI data model. In this article, you saw how to implement relationships between multiple entities in the Power BI data model and how to quickly check that you have connected the correct fields.

View all posts by Ben Richardson
- Working with the SQL MIN function in SQL Server - May 12, 2022
- SQL percentage calculation examples in SQL Server - January 19, 2022
- Working with Power BI report themes - February 25, 2021