

In this article, we will learn Key Performance Indicators usage in Power BI and solve a business case problem through Power BI.
Key Performance Indicators also known as KPI are very efficient indicators that compare any organization target and real performance. Through the KPIs, organizations can evaluate their success at reaching the target. In fact, the main idea of KPI is very simple that is “If you don’t measure it, you can’t manage it”. According to this idea, KPI are crucial metrics for organizations, at the same time we need to track KPI for effective management capability. Such as, if you manage a sales team you have to track monthly sales growth. This KPI measures the sales revenue according to the sales target or compares with the same prior month. With help of these monthly sales Key Performance Indicators, you can get an idea about your sales trend so that you can decide the product prices or campaigns.
On the other hand, business intelligence solutions play key-role for organizations to make decisions about business so we need to virtualize KPIs in business intelligence reports. If we place KPIs in our BI reports or dashboards that offer to track KPIs regularly and assists to take proper decision.
After this main description of Key Performance Indicators and getting through the importance of interaction with business intelligence solutions, we can start to talk about how to use KPIs in Power BI. In this article, we will create the demonstration over a production case scenario.
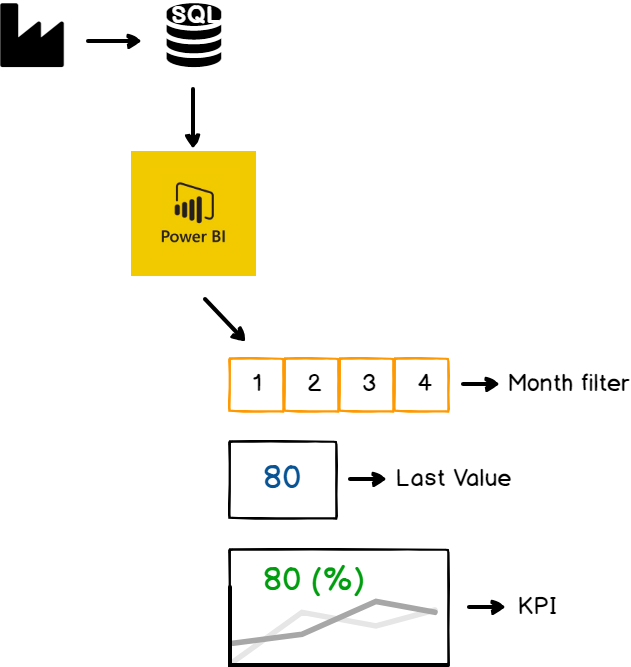
Business Case: Assume that you are report writer of a production company and there is a production line which is the vital part of the factory. This production line oil pressure value has to be 80 and this value indicates the optimum performance of the production line. Also, this value is collected one an hour and store into Azure SQL. Production engineers’ wants to track this production line oil pressure in their mobile phones and they also want to observe the last value of selected month and weekly Key Performance Indicators of this production line oil pressure values. After a little meeting with production engineers, you deal a draft design which looks like the below image.
Demonstration: At first, we need to generate synthetic data in the Azure SQL. The table structure is very simple, it stores oil pressure values and measurement of date. At first, we will create the oil pressure log table through the following T-SQL script.
|
1 2 3 4 5 |
CREATE TABLE OilpressureLog (Id Int IDENTITY(1,1) PRIMARY KEY, ValOilPre INT , Dt DATETIME) And then populate it with test data using a tool like ApexSQL Generate |
After this test data preparation step, we will launch the Power BI and connect to Azure SQL database.
- Click Get Data and then select More… option
-
Click Azure tab and then select Azure SQL database

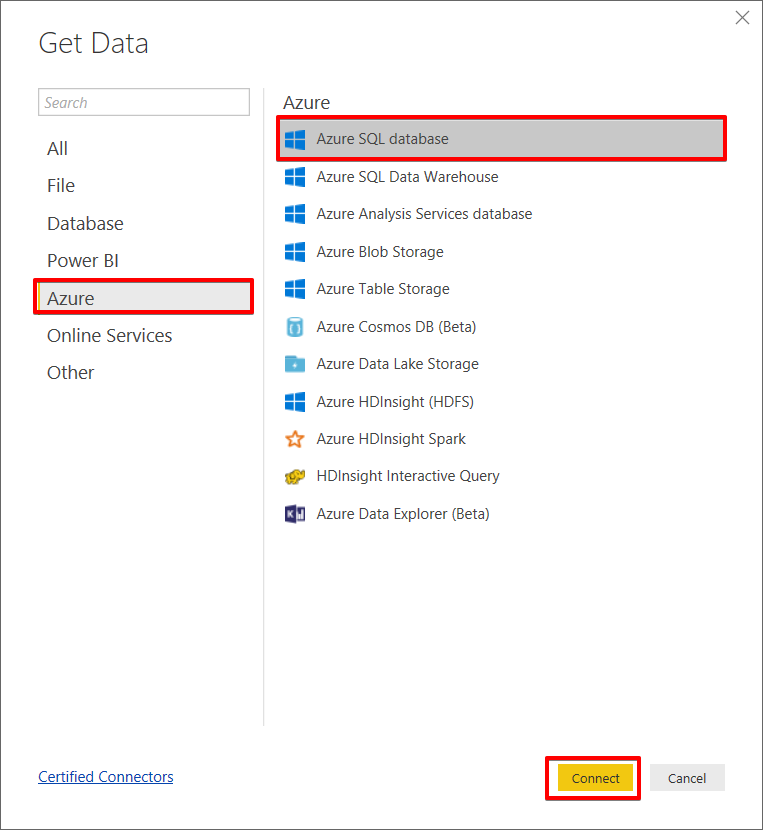
- Click Connect
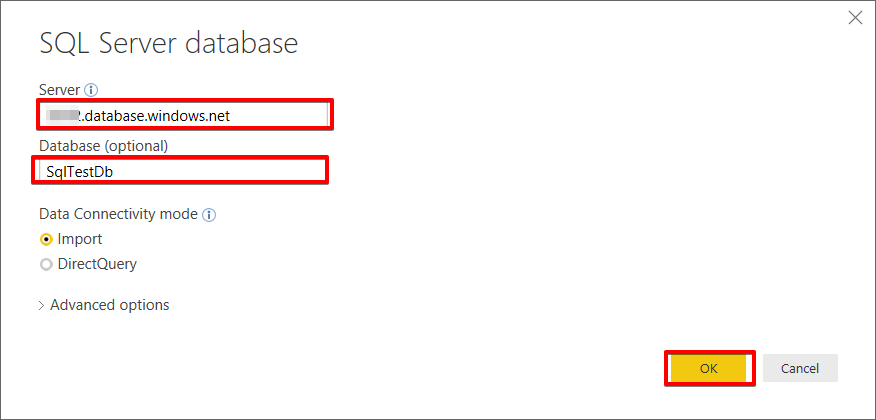
- Set the connection credentials of Azure SQL database
-
Click OK
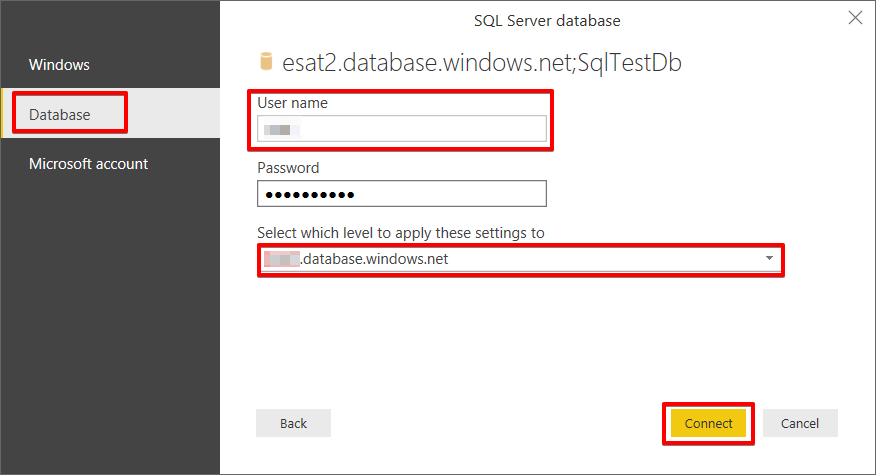
- Select the Database tab and then set the connection credentials of the database
-
Click Connect
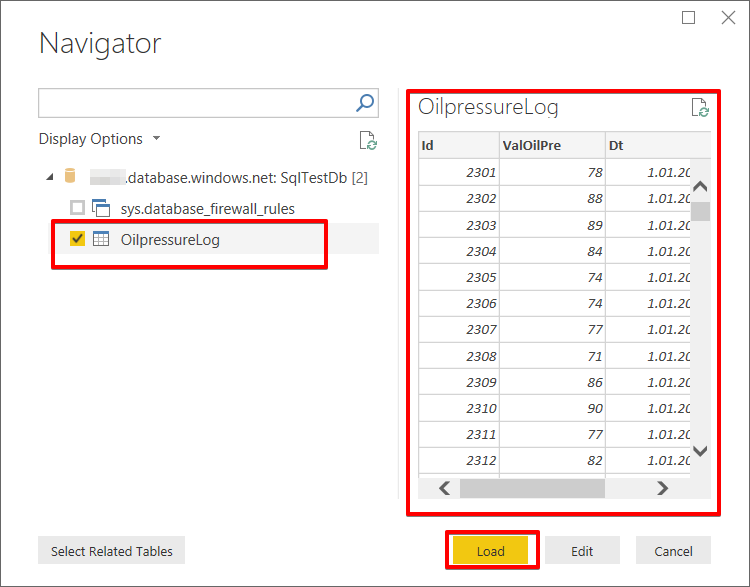
After all these steps, Power BI will launch Navigator screen. In this screen, we will choose the OilpressureLog table in order to retrieve data.
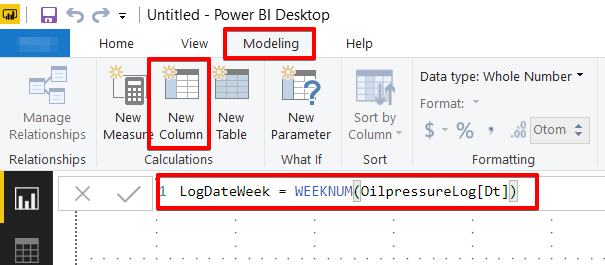
According to our design draft, we will add slicers and this slicer help us to filter month number of year but in our dataset we don’t have any column which indicates this column. At the same time, we need to week of year column to calculate weekly oil pressure Key Performance Indicators. So, we will create two new columns which help to figure out the week of year and month. Select the Modeling tab and add a new column. Write the following DAX (Data Analysis Expressions) expression and this expression will calculate the week of the year.
LogDateWeek = WEEKNUM(OilpressureLog[Dt])
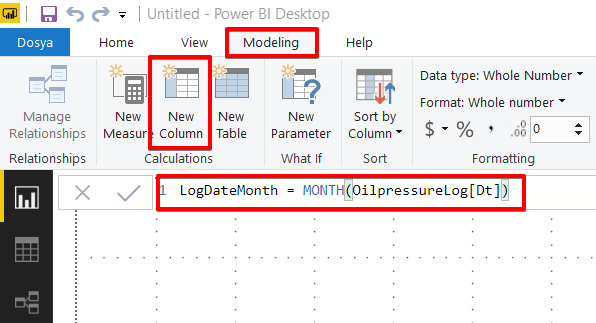
We will repeat the previous step but will only change the DAX expression to calculate month number of year.
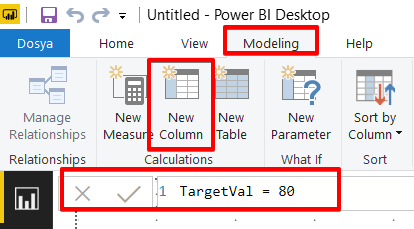
And then, we will add the target value of oil pressure column. This value is constant therefore we don t need to calculate any think about this value.
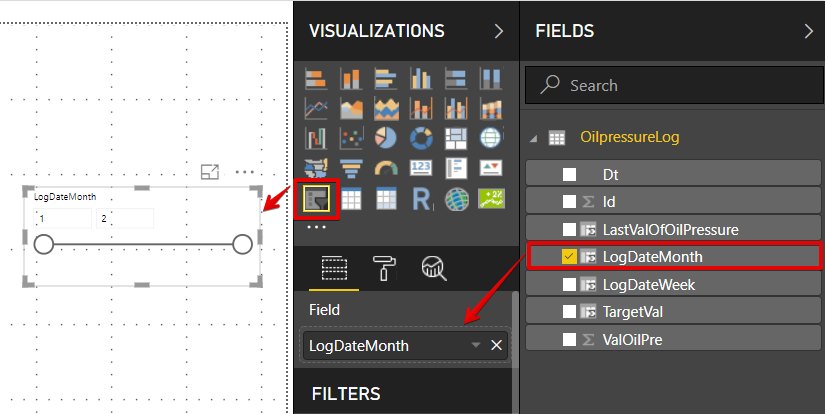
Now, we will add the month filter slicer visual.
- Drag and drop slicer visual to Power BI design panel
-
Drag and drop LogDateMonth column to Field
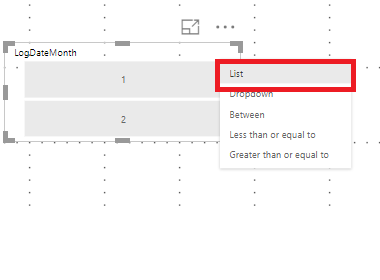
- Hover over the mouse in the right corner of the slicer and then click the small down arrow and then chose the list option
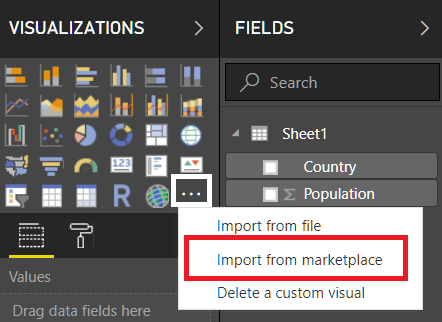
Now we will add our custom Key Performance Indicators visual from the marketplace.
- Click Import from marketplace
-
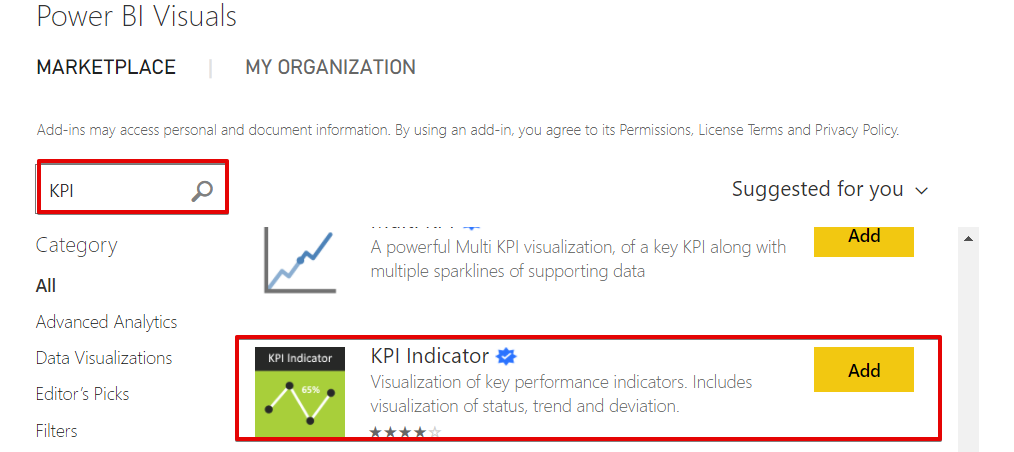
Add custom KPI Indicator from Power BI Visuals marketplace
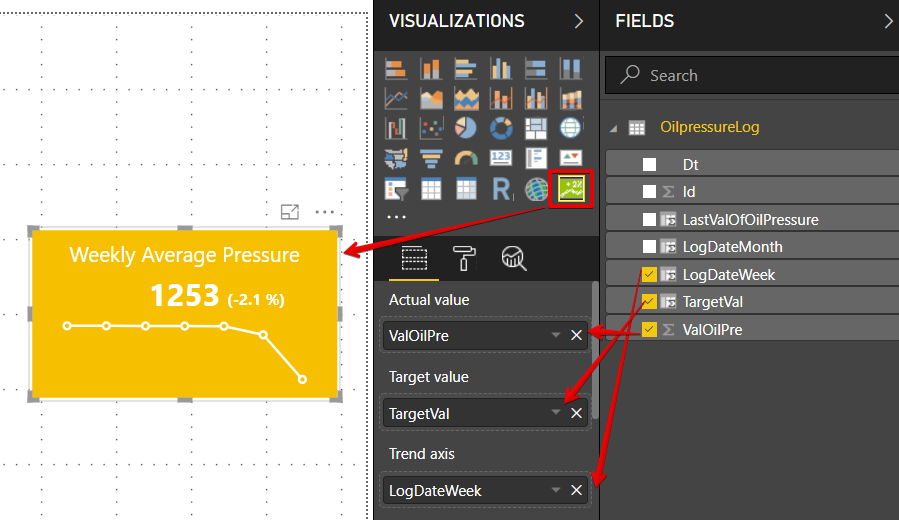
- Drag and drop KPI Indicators visual to design panel
- Set Actual value field to ValOilPre
- Set Target value field to TargetVal
-
Set Trend axis field to LogDateWeek
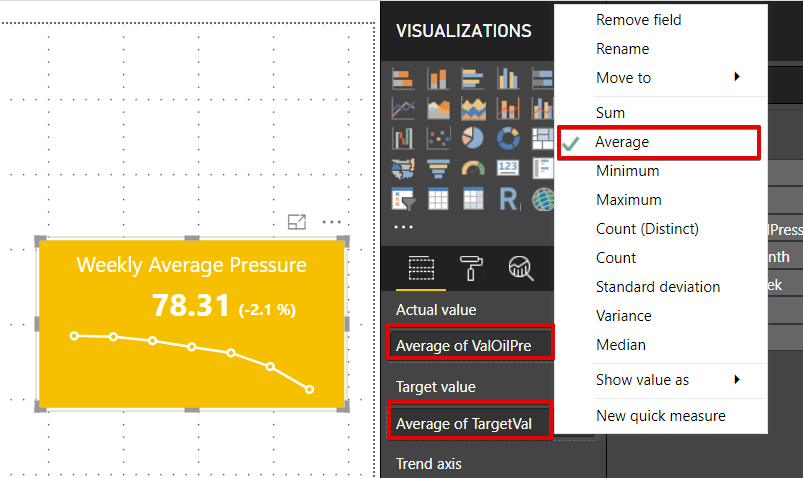
-
Change the ValOilPre and TargetVal calculation to Average
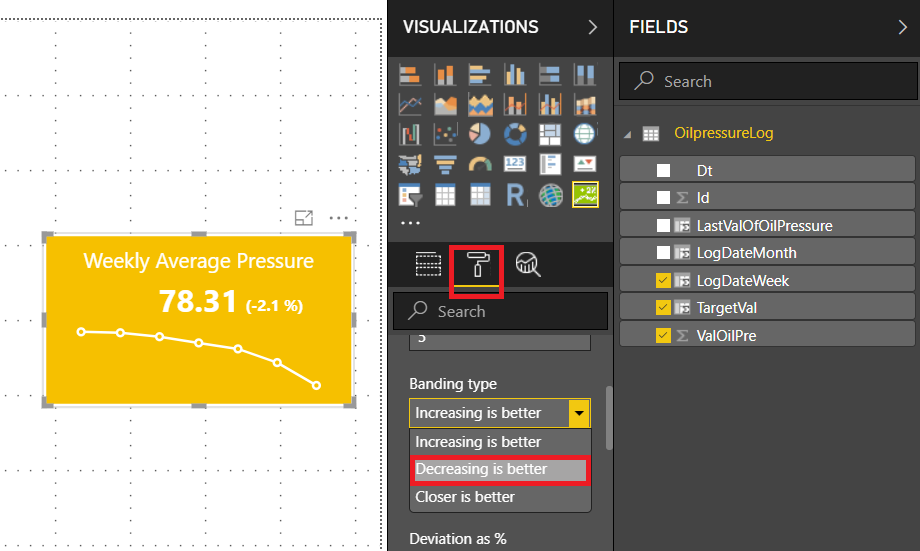
-
Change the Key Performance Indicators visual Banding Type to closer be better because optimum oil pressure value must be 80 according to our report documentation
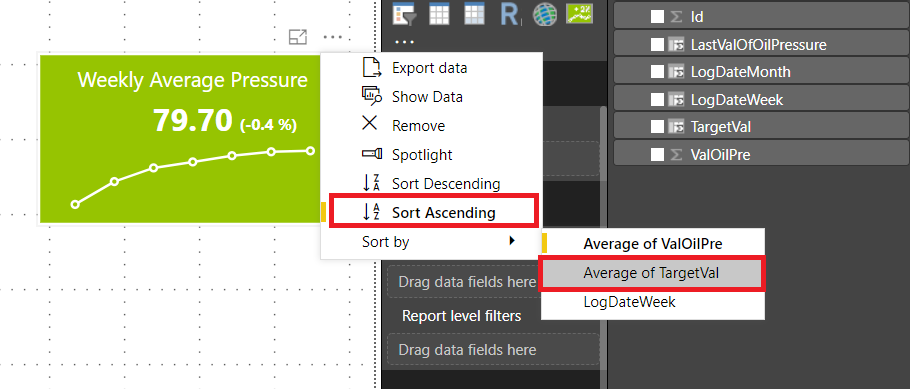
-
Click the right three point (…) in the right corner of the KPI visual and change the sort of data
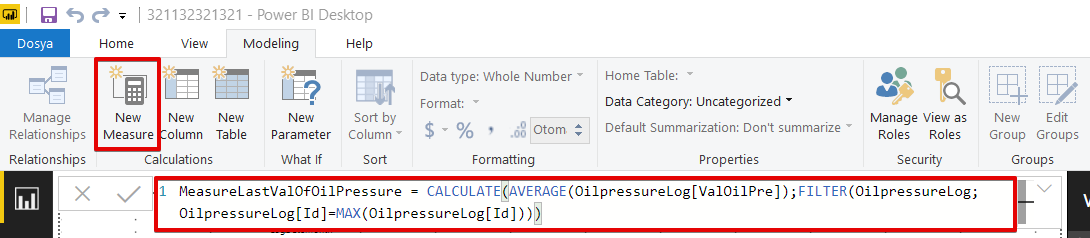
The last need of this Power BI report is the last value of the oil pressure in the selected dataset. In this calculation, we will use the following DAX expression. With help of this DAX, we will figure out the last value of oil pressure. Select the Modelling tab and then we will add LastValOfOilPressure measure.
|
1 |
MeasureLastValOfOilPressure = CALCULATE(AVERAGE(OilpressureLog[ValOilPre]);FILTER(OilpressureLog;OilpressureLog[Id]=MAX(OilpressureLog[Id]))) |
-
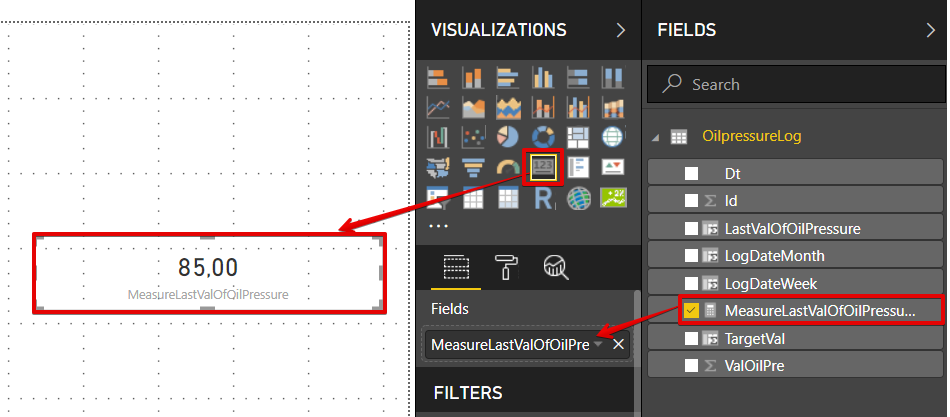
Drag and drop card visual and then set Fields to MeasureLastValOfOilPressure
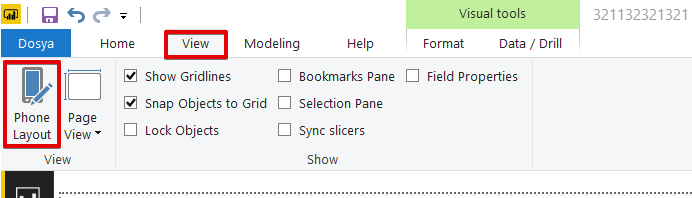
Eventually, all visuals are ready for phone design. We will select the View tab and then select Phone Layout.
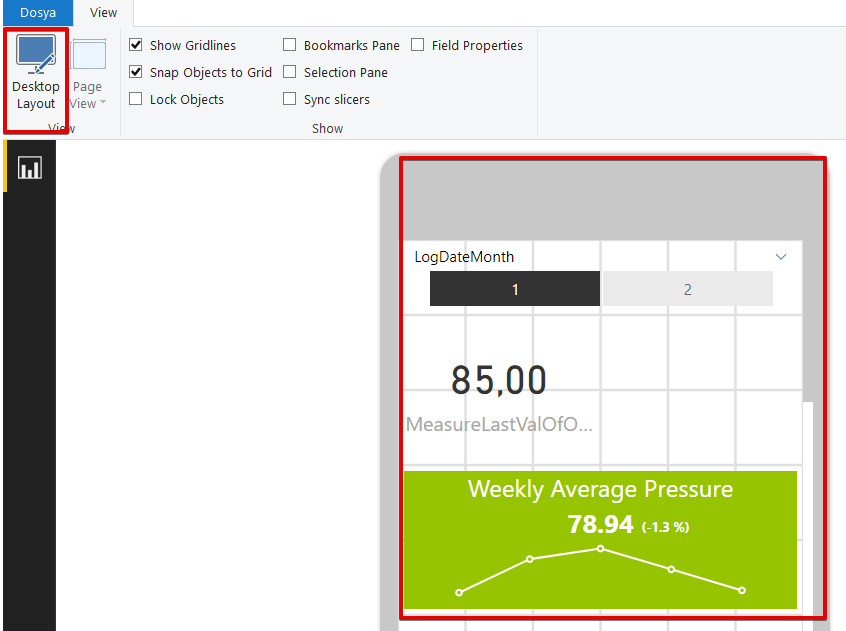
We will design all visuals which are like the below image and then return to desktop layout.
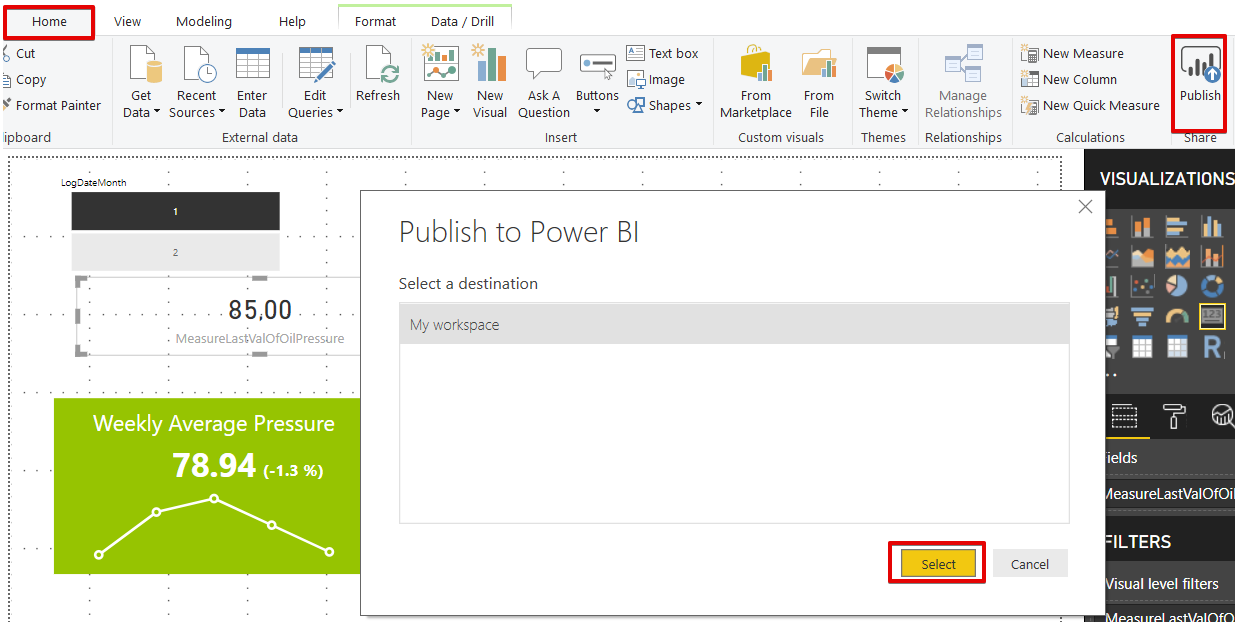
Finally, we will publish our report to Power BI portal.
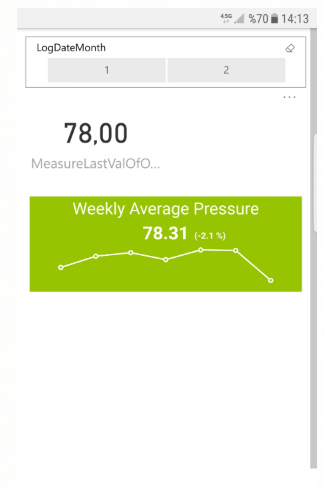
When we download mobile app of Power BI and connect to the Power BI web portal, the report Phone design will look like the below image.
Summary
In this article, we mentioned about Key Performance Indicators and how to handle a business case with help of Power BI. Actually the organization more sophisticated than this one but we can find several alternative visual in Power BI Visual Market Place so that we can handle this problem very easily. In addition, we can increase our flexibility through Power BI mobile support.

Most of his career has been focused on SQL Server Database Administration and Development. His current interests are in database administration and Business Intelligence. You can find him on LinkedIn.
View all posts by Esat Erkec
- SQL Performance Tuning tips for newbies - April 15, 2024
- SQL Unit Testing reference guide for beginners - August 11, 2023
- SQL Cheat Sheet for Newbies - February 21, 2023