Business Intelligence

Bojan Petrovic

4K resolution and high DPI: What you need to know about it to have great visuals

April 26, 2018 by

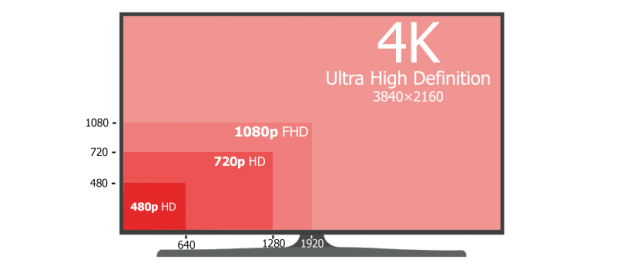
4K resolution, AKA Ultra HD, refers to a horizontal screen display resolution in the order of approximately 3,840 pixels. On two-dimensional display devices such as computer monitors, it represents display resolution of 3840×2160 pixels which is four times as many pixels as regular Full High Definition (1920×1080). What this means for users is the more pixels per inch (PPI) the higher resolution on the monitor. In other words, you can be closer to the monitor and still enjoy a crisp, clear picture.

Read more »
Sifiso Ndlovu

How to configure OData SSIS Connection for SharePoint Online

April 13, 2018 by

As data warehouse developers, we often have to extract data from a myriad of source systems. Thus, whilst some source systems readily integrate with our ETL tools there are instances whereby we need to install additional drivers and software addons in order to successfully connect and extract data from other source systems. Microsoft SharePoint Online is one such source system that I recently had to extract data from and its connectors are by default not part of the standard SQL Server Integration Services (SSIS) package template. As SSIS developers we often don’t have solid background on environments such as SharePoint, thus figuring out which version of SharePoint Software Development Kit to install in order to enable successful connection from SSIS can sometimes be a frustrating experience. In this article, I try to alleviate some of that frustration by sharing some of my recent experiences relating to getting data out of a SharePoint list using SSIS.

Read more »
Minette Steynberg

The end is nigh! (For SQL Server 2008 and SQL Server 2008 R2)

April 4, 2018 by

Introduction

As with everything else, all good things must come to an end. After hanging around for a good decade SQL Server 2008 and SQL Server 2008 R2 has started the countdown to its End of Life.

D-day for SQL Server 2008 and SQL Server 2008 R2 is set to the 19th of July 2019. Which is approximately a year from now, give or take a couple of months.

If you are still running SQL Server 2008 or SQL Server 2008 R2, now is definitely the time to upgrade. In this article; I am going to tell you why you would want to upgrade to a newer version of SQL Server (2016 or 2017) or Azure SQL Database. I will also discuss some of the tools that you might use to make the upgrade as painless as possible.

Read more »
Esat Erkec

SQL Server Reporting Service: how to handle common end-user requirements with Report Builder

March 26, 2018 by

In this article, we will discuss the SQL Server Reporting Service Report Builder and look at how to handle common client, end user requests using Report Builder. Report Builder is a very powerful tool to create a report for the SQL Server Reporting Service.

Advantages of the Report Builder is that it:

  • exists as a Stand-alone installation
  • can use different data from a lot of data sources
  • can easily deploy reports to SQL Server Reporting Service
  • supports full capabilities of SQL Server Reporting Service
  • provides a productive report-authoring environment
Read more »
Sifiso Ndlovu

How to migrate SQL Server 2017 Master Data Services Models into another server

March 23, 2018 by

Often as consultants, we don’t get to work onsite alongside our clients instead we are given copies of clients’ production environment and work on proposed solutions back at our offices. Once development has been completed, we then deploy and integrate our solution back to the client’s production environment. I’ve recently had to adopt a similar offsite development approach whilst working on a project that included development and configuration of master data services. In this article, I will demonstrate how a SQL Server 2017 Master Data Services (MDS) model can be exported from one environment (i.e. MDS Dev) and deployed into another environment (i.e. MDS Prod).

Read more »
Thomas LeBlanc

Time Intelligence in Analysis Services (SSAS) Tabular Models

March 20, 2018 by

In the analytical world, time is an important slicer. The ability to view data over time helps analyze measures in actionable steps. An Analysis Service (SSAS) database can help accomplish this important step. Business users are going to want the ability to see measures a like year to date as well as the period over period comparisons. SSAS enables Time Intelligence with 2 features: the date table and DAX functions.

Read more »
Divya Agrawal

Automate documentation of SQL Server Analysis Server Tabular Model

March 13, 2018 by

There has been an ever-growing discomfort on documenting things especially when it’s very dynamic in nature and I was at one time undergoing the same. We have been developing SQL Server Analysis Tabular Model’s, which were quite a many in numbers and documenting 50 or 60 models manually is a big effort. In addition, development always demands change or enhancements that incurs changes on the documentation that is a continuous process. Adding the changes on the documentation is a time consuming process and sometimes loses track or remains inconsistent with the code built which is a critical issue when the system is in production for years.

I decided to automate the documentation of the SSAS model, to ease the manual effort here as well as save time. In addition, help the end users to see and review the latest change on the models quickly without even bothering the development team.

Read more »
Sifiso Ndlovu

Replace bridge tables in a Data Warehouse with SQL Server 2017 graph database

March 8, 2018 by

Just like in Santa’s Bag of Goodies, every release of SQL Server often has something for everyone – be it enhancements to DMVs for the DBAs, new functions for T-SQL developers or new SSIS control tasks for ETL developers. Likewise, the ability to effectively support many-to-many relationships type in SQL Graph has ensured that there is indeed something in it for the data warehouse developers in SQL Server 2017. In this article, we take you through the challenges of modelling many-to-many relationships in relational data warehouse environments and later demonstrate how data warehouse teams can take advantage of the many-to-many relationship feature in SQL Server 2017 Graph Database to effectively model and support their data warehouse solutions.

Read more »
Daniel Calbimonte

How to upload multiple images to SQL Server

March 6, 2018 by

Introduction

Sometimes we need to store information including photos in our database. For example, the photo of the product, the photo of the team members. But how can we store images in SQL Server?

We could create an application in .NET or Java, but if we do not have experience in those programming languages, we could use SQL Server tools to do it.

In this new article, we will learn the following tips that will help us to work with images including how to:

  • insert one image into SQL Server
  • store multiple files into a table
  • verify that the images were inserted
Read more »
Esat Erkec

How to create advanced analytics using Power BI and R scripts

February 27, 2018 by

In this article, we will discover how to find the associations and hidden patterns in a dataset. The tool we will use for this is Power BI and not use any statistical functions or calculation.

Explanation

Power BI is one of the most powerful business intelligence solutions in the market. A cloud-based, user-friendly interface and basic development abilities provide this solution to be more convenient for people to use.

As you may know, Microsoft now supports R script in SQL Server and Power BI. R script support opens magical gates of statistics world to Power BI. Custom Visual offers very useful and interesting visual components for Power BI. In this store, many useful visualizations have been created by Microsoft or the community itself. Some of these visuals use R script infrastructure and this feature allows us to create advanced visual analytic in Power BI. Only a Power BI account is enough to connect and download theses visuals. We will use these visuals in our examples.

Read more »
Craig Porteous

Top 10 things you must document in SQL Server Reporting Services (SSRS)

February 26, 2018 by

Documentation is never fun. I curse having to do it and I curse the person who didn’t do it. It’s a no-win situation.

Luckily I don’t want to tell you to write long documents for setting up or maintaining Reporting Services or creating reports etc. This is more about the main aspects of SSRS that you should be keeping a backup of or maintaining to make your life (and other people’s lives) easier in future. I’ll keep your typing to a minimum.

Read more »
Thomas LeBlanc

How to create Intermediate Measures in Analysis Services (SSAS)

February 19, 2018 by

The whole premise of Analysis Services (SSAS) is to place business logic into a central repository (a database). This central repository should be easy to understand from the average reporting user. Simplicity for SSAS databases starts with the Dimension and Fact tables in a data mart or data warehouse. These tables need to have as little additional computed columns as necessary. With this design, adding additional Measures to the SSAS database, both Multidimensional Cubes, and Tabular Models, can help with performance monitoring of the company’s indicators.

Read more »
Craig Porteous

Migrating SSRS content with PowerShell

January 29, 2018 by

With a distinct lack of up-to-date, fully featured or built-in options to get Reporting Services content cleanly from A to B, it can often be a challenging task maintaining proper Development and QA environments or even moving reports from a SharePoint integrated installation to a native mode one, and vice versa.

I want to explore the two most efficient methods of bulk-migrating Reporting Services content & also explore other options I’ve used over the years and those that have come and gone.

Read more »
Sifiso Ndlovu

How to plot a SQL Server 2017 graph database using PowerBI

January 9, 2018 by

In the article How to plot a SQL Server 2017 graph database using SQL Server R, I highlighted the lack of built-in graph data visualisation as one major limitation of the SQL Server 2017 graph database feature. In the same article, I went on to suggest making use of SQL Server R as one workaround that could be utilised in order to successfully plot and visualise diagrams out of SQL Server 2017 graph database objects. However, whilst 3rd party graph database vendors such as Neo4j provide an interactive and hyperlinked graph diagrams that allows you to – amongst other things – easily drilldown and identify node-relationships as indicated in Figure 1, the graph plotted using SQL Server R is not very interactive in fact it is simply a static image file as shown in Figure 2.

Read more »
Daniel Calbimonte

How to create Excel reports based on SSAS information

December 18, 2017 by

Introduction

In SSAS, when I offer Power BI, Reporting Services, PowerPivot or SharePoint to connect to SSAS, the business analysts look scared. On the other hand, if I talk about MS Excel, everybody seems so happy and comfortable with it.

Excel is still the most popular spreadsheet in the world even when there are a lot of free spreadsheets like OpenOffice and LibreOffice to download, in the BI world, Excel is still the most popular.

Read more »
Daniel Calbimonte

How to build a cube from scratch using SQL Server Analysis Services (SSAS)

December 11, 2017 by

Introduction

I am a DBA consultant and several times, in the past, I have been asked for a good tool to generate fast reports to get information about the company like total sales, sales per year, month, week, etc

SSAS is a Business Intelligence (BI) technology that Microsoft bought from Panorama Software in 1996. After the acquisition, the technology was upgraded and evolved and now it is part of the tools that come with SQL Server. This tool is an extremely powerful tool to create analytical reports fast. It works with cubes that are designed to generate reports with optimal performance using aggregated information stored in the cube.

Read more »
Craig Porteous

How to manage Power BI dataset refresh failures

November 30, 2017 by

As I covered in a previous post How to connect to (and query) Power BI and Azure using PowerShell, Power BI can be difficult to manage and administer, unlike on-premises BI solutions. One such concern that will often require quick action is the failure of a dataset refresh.

If your reports and dashboards all rely on live connection or DirectQuery data sources like Azure SQL Database, Azure SQL Data Warehouse or SQL Server Analysis Services (on-premises or in Azure) then you won’t have to worry about dataset refreshes and this post will just be some interesting reading.

Read more »
Marko Zivkovic

How to import data from an Excel file to a SQL Server database

November 10, 2017 by

There are many ways to import data from an Excel file to a SQL Server database using:

In this article, steps for importing data from an Excel file to a SQL Server database will be explained using the SQL Server Import and Export Wizard including some of problems that can occur during the processes.

Read more »
Thomas LeBlanc

Managing A Slowly Changing Dimension in SQL Server Integration Services

October 10, 2017 by

A data warehouse has to be historically correct. This becomes an issue when data like the Product List Price for a previous year needs to be saved historically. Dimensional Modeling methodologies provide a solution for the situation. The Slowly Changing method integrated with components from SQL Server Integration Services solves the issue. This article will look at updating a product dimension table using the Slowly Changing Type 2 Dimension while maintaining the Type 1 columns.

Read more »
Sifiso Ndlovu

How to replace hardcoded lookups using SQL Server Master Data Services

September 14, 2017 by

Introduction

A big part of the technical debt in my organization’s data warehouse (DW) and business intelligence (BI) environments relates to hardcoded lookup data. This is data required by the business to make sense of transactional data but was never planned for in the underlying source system and consequently get injected into DW and BI solutions. Inevitably, it is only a matter of time before DW and BI team lose track of the places wherein the hardcoded data reside thus making it difficult to maintain. Furthermore, due to lack of documentation or staff retention, anyone who subsequently takes over these DW/BI solutions can unknowingly create duplicate lookup data. In this article, I explain how we reduced such technical debt in my organization by moving most of the hardcoded lookups into SQL Server Master Data Services (MDS).

Read more »
Craig Porteous

How to connect to (and query) Power BI and Azure using PowerShell

September 13, 2017 by
Power BI “as a whole” is a bit of a black box. If you’re like me and used to using SQL Server & its components; SSRS, SSAS etc. you have access to installation directories, Event logs, trace logs, error logs, chocolate logs? You can see full instances & their contents in one go, whether that be databases, reports or cubes. It gives you the control over & responsibility for performance & maintenance. Read more »
Thomas LeBlanc

Using Many-to-Many Relationships in SQL Server Analysis Services (SSAS) 2016

September 7, 2017 by

The Multidimensional Cube option of Analysis Services has handled many-to-many relationships with ease for many versions before 2016. The Tabular had a work around using DAX formulas until the release of SQL Server 2016. There are still some limitations to many-to many in Tabular but of course, there are some “tricks” to overcome the limitations. But, the many-to-many relationship will be in businesses data for many years to come. A solution has to be provided when it comes to Analysis Service databases.

Read more »
Minette Steynberg

Introduction to Azure SQL Data Warehouse

August 29, 2017 by

Introduction

Azure SQL Data Warehouse is a new addition to the Azure Data Platform. When I first heard about it I wasn’t quite sure about what exactly it would be. As it turns out it is relational database for large amounts of database and really big queries as a service. This is essentially the equivalent of the APS (Analytics Platform System) in the cloud.

Read more »
Thomas LeBlanc

Analysis Services (SSAS) Tabular Models – Attributes and Measures

August 14, 2017 by

In this article, a demonstration of the tabular model will try to related multidimensional cube design to the path forward Microsoft is giving used s with new versions of Analysis Services. Even though the descriptive names are changing, the tabular model still accomplishes the centralized business rules multidimensional cubes gave the business intelligence world. This is enforced by speed obtained from in-memory technology and simplification of the interface for the masses.

Read more »