

In the previous articles of this series (see the full article TOC at bottom), we discussed the internal structure of both the SQL Server tables and indexes, the best practices that you can follow in order to design a proper index, list of operations that you can perform on the SQL Server indexes, how to design effective Clustered and Non-clustered indexes, the different types of SQL Server indexes, above and beyond Clustered and Non-clustered indexes classification and finally how to tune the performance of the bad queries using the different types of SQL Server Indexes. In this article, we will discuss how to gather statistical information about the index structure and the index usage information.
For this point in this series, we are familiar on the SQL Server Index structure and how to design and create the most suitable index, that the SQL Server Query Optimizer will definitely take benefits from, in speeding up the performance of our queries. After creating the indexes, we should proactively know which indexes are badly used, or totally unused in order to perform the correct decision to maintain these indexes or replace it with more efficient ones. Recall that removing the unused indexes or badly indexes will improve the performance of the data modification queries, that needs to replicate the same table change to the indexes, and reduce the index maintaining and storing overhead.
Index structure information
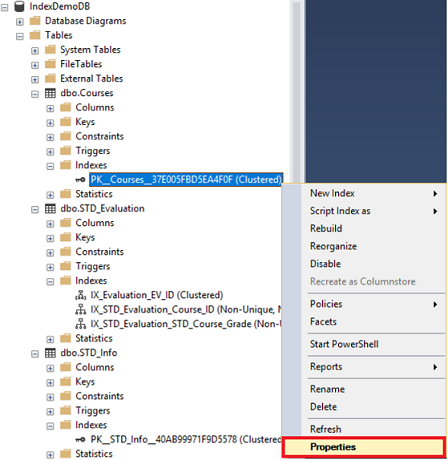
The first category of information that we need to gather about the indexes is the list of available indexes in our database, the list of columns participating in each index and the properties of these indexes. The classical way of gathering such information about the indexes is expanding the Indexes node under the database tables, then right-clicking on each index, and choose the Properties option as shown below:
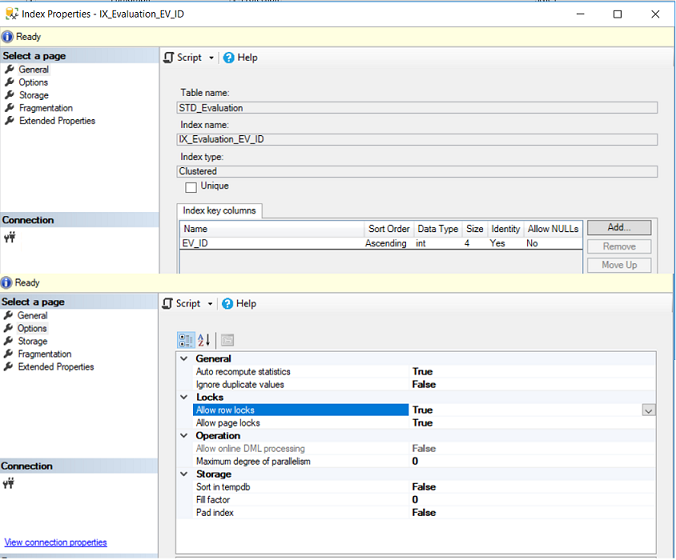
Where you can browse the list of columns participating in the index key and different properties of the selected index. The problem with gathering the indexes information using the UI method is that you need to browse it one index at a time per each table. You can imagine the effort required to check all indexes in a specific database. The list of properties of a selected index can be shown below:
The second way of gathering metadata about the index structure is the sp_helpindex system stored procedure, by providing the name of the table that you need to list its indexes. In order to gather information about all indexes in a specific database, you need to execute the sp_helpindex number of time equal to the number of tables in your database. For the previously created database that has three tables, we need to execute the sp_helpindex three times as shown below:
|
1 2 3 4 5 |
sp_helpindex '[dbo].[STD_Evaluation]' GO sp_helpindex '[dbo].[Courses]' GO sp_helpindex '[dbo].[STD_Info]' |
The name of the index, the columns that participate in the index key and description of that index, such as index type, will be returned from the sp_helpindex system stored procedure, as shown in the result below:
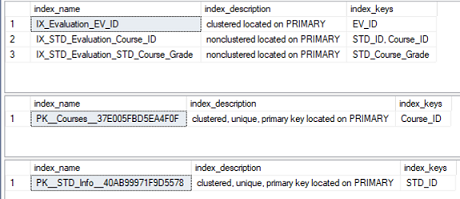
The main disadvantage of using the sp_helpindex system stored procedure to retrieve the indexes information of a specific database is that you need to execute it per each table, as mentioned previously. In addition, the sp_helpindex system stored procedure returns only the key columns that are participating in the index key. You can see that the columns that are added using the INCLUDE clause as non-key columns will not be listed using that stored procedure.
The third way, and the best for me, to gather metadata information about the index structure is querying the sys.indexes system dynamic management view. The sys.indexes contains one row per each index in the table or view. It is recommended to join sys.indexes DMV with other systems DMVs , such as the sys.index_columns, sys.columns and sys.tables in order to return meaningful information about these indexes. A good example of using the sys.indexes DMV, that needs to be executed once per each database, is shown below:
|
1 2 3 4 5 6 7 8 9 10 |
SELECT Tab.name Table_Name ,IX.name Index_Name ,IX.type_desc Index_Type ,Col.name Index_Column_Name ,IXC.is_included_column Is_Included_Column FROM sys.indexes IX INNER JOIN sys.index_columns IXC ON IX.object_id = IXC.object_id AND IX.index_id = IXC.index_id INNER JOIN sys.columns Col ON IX.object_id = Col.object_id AND IXC.column_id = Col.column_id INNER JOIN sys.tables Tab ON IX.object_id = Tab.object_id |
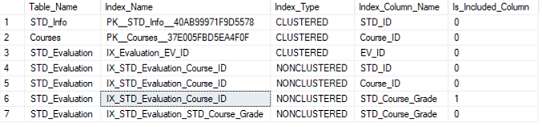
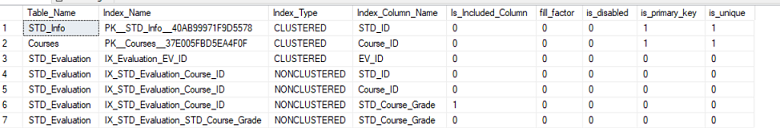
The result of the previous query, that includes the table name, the index name, the type of the index and finally the name and the type of key and non-key columns participating in these indexes, will be as shown below:
The previous query can be rewritten, to list more properties of the indexes, as below:
|
1 2 3 4 5 6 7 8 9 10 11 12 13 14 |
SELECT Tab.name Table_Name ,IX.name Index_Name ,IX.type_desc Index_Type ,Col.name Index_Column_Name ,IXC.is_included_column Is_Included_Column ,IX.fill_factor ,IX.is_disabled ,IX.is_primary_key ,IX.is_unique FROM sys.indexes IX INNER JOIN sys.index_columns IXC ON IX.object_id = IXC.object_id AND IX.index_id = IXC.index_id INNER JOIN sys.columns Col ON IX.object_id = Col.object_id AND IXC.column_id = Col.column_id INNER JOIN sys.tables Tab ON IX.object_id = Tab.object_id |
And the result that contains the extra index properties is shown below:
Index fragmentation information
The main target of creating an SQL Server index is speeding up the data retrieval performance and enhance the overall performance of the queries. But when the underlying table data is changed or deleted, this change should be replicated to the related table indexes. Over time, and as a result of many inserting, updating, deleting operations, the index will become fragmented, with a large number of unordered pages with free space in these pages, degrading the performance of the queries, due to increasing the number of pages to be scanned in order to retrieve the requested data. As a result, the index could be ignored in most cases by the SQL Server Query Optimizer. Another cause of the fragmentation problem is the page splitting, in which the page will be split into two pages when the inserted or newly updated values do not fit the available space in the page, due to wrong setting of the Fill Factor and pad_index index creation options, mentioned in detail in the previous articles of this series.
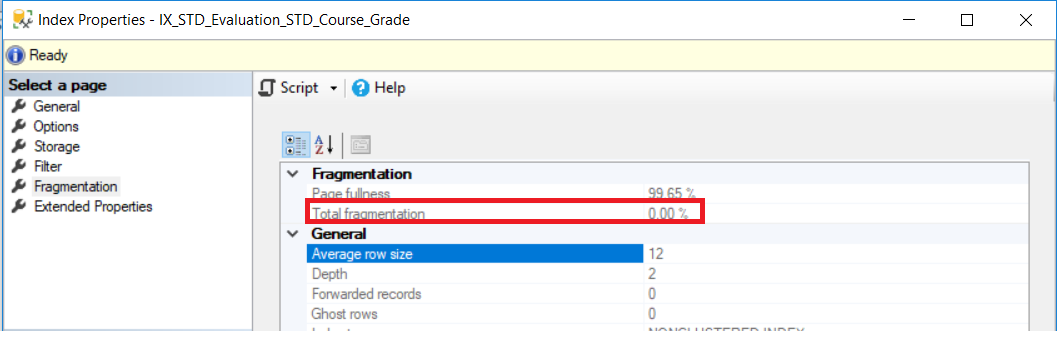
The straight-forward way of getting the fragmentation percentage of an index is from the Fragmentation tab of the index Properties window. For the newly created index, the fragmentation level will be 0%, as shown in the Index Properties window below:
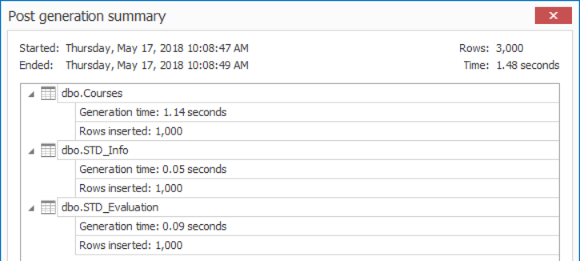
If we try to fill the previously created tables with extra 1K records, using APEXSQL Generate tool, as shown in the snapshot below:
And check the fragmentation percentage of the same index again, you will see that the index became highly fragmented, due to the inserting operation, with fragmentation percentage equal to 99%, as shown in the Index Properties window below:

Checking the fragmentation percentage of all indexes in a specific database, using the UI method requires a big effort, as you need to check one index at a time. Another way to gather the fragmentation percentage information about all database indexes at one shot is by querying the sys.dm_db_index_physical_stats dynamic management function, that is Introduced the first time in SQL Server 2005. The sys.dm_db_index_physical_stats DMF can be joined with the sys.indexes DMV to return the fragmentation percentage of all indexes under the specified database, as in the query shown below:
|
1 2 3 4 5 6 7 8 |
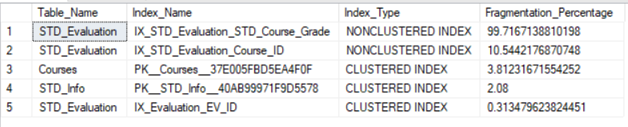
SELECT OBJECT_NAME(IDX.OBJECT_ID) AS Table_Name, IDX.name AS Index_Name, IDXPS.index_type_desc AS Index_Type, IDXPS.avg_fragmentation_in_percent Fragmentation_Percentage FROM sys.dm_db_index_physical_stats(DB_ID(), NULL, NULL, NULL, NULL) IDXPS INNER JOIN sys.indexes IDX ON IDX.object_id = IDXPS.object_id AND IDX.index_id = IDXPS.index_id ORDER BY Fragmentation_Percentage DESC |
The result in our case will be as shown below:
To overcome this issue, we should perform the proper index maintenance operation, with the optimal FillFactor and Pad_index value. In this article, we will stop at the point of gathering the index fragmentation information. In the next article of this series, we will see how to fix the index fragmentation issue.
Index usage information
SQL Server allows us to create up to 999 Non-clustered indexes and one Clustered indexes per each table. This huge number of allowed, but not recommended, indexes help us in covering and enhancing the performance of a large number of queries that try to retrieve data from the database table. The drawbacks of having too many indexes in the table include slowing down the data modification operations, due to the fact that all changes performed on the table should be replicated to the related indexes. In addition, this large number of indexes require extra storage and should be all maintained, although some of these indexes are not used, hurting the overall performance, instead of the expected enhancement from it.
So that, it becomes the main task for the database administrator to regularly monitor the usage of these indexes, to identify the indexes that are badly used, or not used, and drop it or replace it with more optimal ones if required. The indexes that are badly used include the ones that have a large number of write with few numbers of reads and a large number of scans with few numbers of seeks.
SQL Server keeps the information about the index usage statistics automatically in the system tables and flushes that data when the SQL Server service is restarted. To access these system tables, SQL Server provides us with the sys.dm_db_index_usage_stats dynamic management view, that helps in tracking the usage of the database indexes since the last SQL Server service restart.
The T-SQL script below uses the sys.dm_db_index_usage_stats DMV, along with other system catalog views, to return a meaningful and useful cumulative information about each index and its usage since the last restart. This information includes the name of the table, on which the index is created, the name and type of that index, the size of the index, the number of seeks, scans, lookups and updates performs on the index and finally the last seeks, scans, lookups and updates date, as shown below:
|
1 2 3 4 5 6 7 8 9 10 11 12 13 14 15 16 17 |
SELECT OBJECT_NAME(IX.OBJECT_ID) Table_Name ,IX.name AS Index_Name ,IX.type_desc Index_Type ,SUM(PS.[used_page_count]) * 8 IndexSizeKB ,IXUS.user_seeks AS NumOfSeeks ,IXUS.user_scans AS NumOfScans ,IXUS.user_lookups AS NumOfLookups ,IXUS.user_updates AS NumOfUpdates ,IXUS.last_user_seek AS LastSeek ,IXUS.last_user_scan AS LastScan ,IXUS.last_user_lookup AS LastLookup ,IXUS.last_user_update AS LastUpdate FROM sys.indexes IX INNER JOIN sys.dm_db_index_usage_stats IXUS ON IXUS.index_id = IX.index_id AND IXUS.OBJECT_ID = IX.OBJECT_ID INNER JOIN sys.dm_db_partition_stats PS on PS.object_id=IX.object_id WHERE OBJECTPROPERTY(IX.OBJECT_ID,'IsUserTable') = 1 GROUP BY OBJECT_NAME(IX.OBJECT_ID) ,IX.name ,IX.type_desc ,IXUS.user_seeks ,IXUS.user_scans ,IXUS.user_lookups,IXUS.user_updates ,IXUS.last_user_seek ,IXUS.last_user_scan ,IXUS.last_user_lookup ,IXUS.last_user_update |
The number of Seeks indicates the number of times the index is used to find a specific row, the number of Scans shows the number of times the leaf pages of the index are scanned, the number of Lookups indicates the number of times a Clustered index is used by the Non-clustered index to fetch the full row and the number of Updates shows the number of times the index data is modified. The result in our case will be like the below:
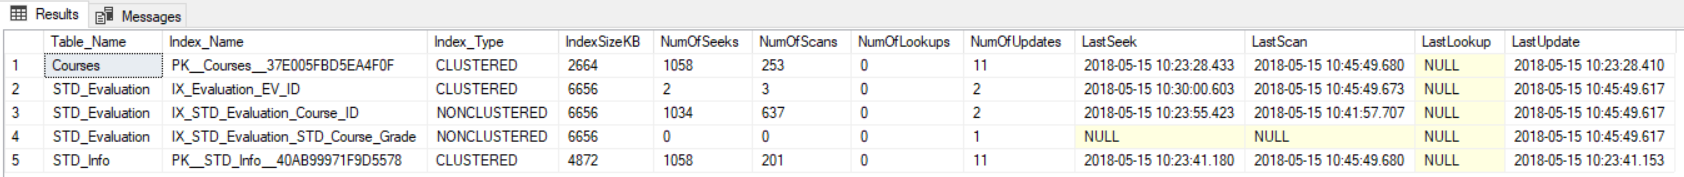
The previous result can be analyzed as follows:
- All zero values mean that the table is not used, or the SQL Server service restarted recently.
- An index with zero or small number of seeks, scans or lookups and large number of updates is a useless index and should be removed, after verifying with the system owner, as the main purpose of adding the index is speeding up the read operations.
- An index that is scanned heavily with zero or small number of seeks means that the index is badly used and should be replaced with more optimal one.
- An index with large number of Lookups means that we need to optimize the index by adding the frequently looked up columns to the existing index non-key columns using the INCLUDE clause.
- A table with a very large number of Scans indicates that SELECT * queries are heavily used, retrieving more columns than what is required, or the index statistics should be updated.
- A Clustered index with large number of Scans means that a new Non-clustered index should be created to cover a non-covered query.
- Dates with NULL values mean that this action has not occurred yet.
- Large scans are OK in small tables.
- Your index is not here, then no action is performed on that index yet.
The previous readings give you good indications about the database indexes usage, but you need to dig deeper before deciding to remove or replace an index. You can use the previous results in conjunction with the result of the sys.dm_db_index_physical_stats dynamic management function to have a full view of the index usage. The sys.dm_db_index_physical_stats DMF returns information about the lower-level I/O activities, such as INSERT, UPDATE and DELETE operations, occurred on that index, per each table partition.
The sys.dm_db_index_physical_stats DMF takes the database_id, the object_id, the index_id and the partition_number as parameters. Providing NULL or DEFAULT values to the sys.dm_db_index_physical_stats DMF will return a row for each partition in the database. Similar to all other DMOs, the sys.dm_db_index_physical_stats DMF returns cumulative data that will be refreshed when the SQL Server service is restarted. Rebuilding, reorganizing or disabling the index will not affect its statistics. An index will have an entry in the sys.dm_db_index_physical_stats DMF only if the metadata cache object that represents this index is available.
The below T-SQL script can be used to query the sys.dm_db_index_physical_stats DMF, joined with other DMOs to get more meaningful information, can be used to retrieve the I/O operations statistics for each index on the current database. This information includes the name of the table on which the index is created, the name and size of the index and finally the number of INSERT, UPDATE and DELETE operations occurred on these indexes. The script will be as shown below:
|
1 2 3 4 5 6 7 8 9 10 11 12 13 |
SELECT OBJECT_NAME(IXOS.OBJECT_ID) Table_Name ,IX.name Index_Name ,IX.type_desc Index_Type ,SUM(PS.[used_page_count]) * 8 IndexSizeKB ,IXOS.LEAF_INSERT_COUNT NumOfInserts ,IXOS.LEAF_UPDATE_COUNT NumOfupdates ,IXOS.LEAF_DELETE_COUNT NumOfDeletes FROM SYS.DM_DB_INDEX_OPERATIONAL_STATS (NULL,NULL,NULL,NULL ) IXOS INNER JOIN SYS.INDEXES AS IX ON IX.OBJECT_ID = IXOS.OBJECT_ID AND IX.INDEX_ID = IXOS.INDEX_ID INNER JOIN sys.dm_db_partition_stats PS on PS.object_id=IX.object_id WHERE OBJECTPROPERTY(IX.[OBJECT_ID],'IsUserTable') = 1 GROUP BY OBJECT_NAME(IXOS.OBJECT_ID), IX.name, IX.type_desc,IXOS.LEAF_INSERT_COUNT, IXOS.LEAF_UPDATE_COUNT,IXOS.LEAF_DELETE_COUNT |
The result in our case will be like:
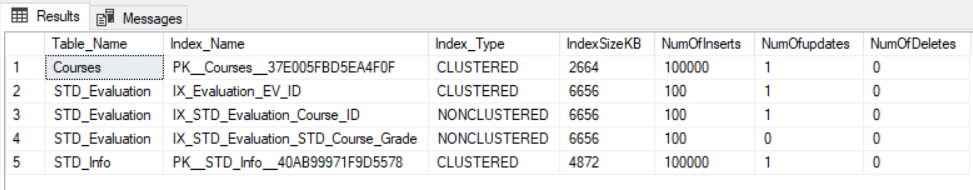
The previous result provides us with more detailed information about the number of data inserting and modification operations occurred on each index. This result, in conjunction with the sys.dm_db_index_usage_stats DMV result helps to decide if we need to remove that index or replace it with more optimal one.
SQL standard reports
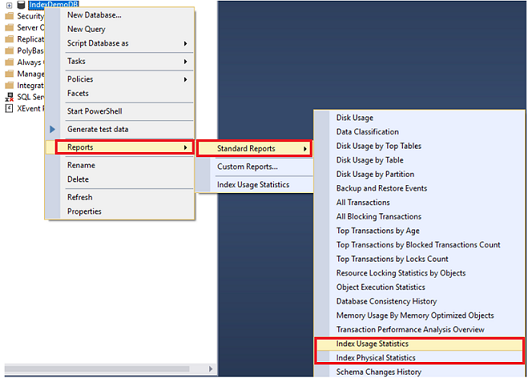
SQL Server provides us with two built-in reports that help us in monitoring the database indexes fragmentation and usage statistics, the Index Usage Statistics and the Index Physical Statistics. These standard reports use the previously described DMOs, and the reports data will be refreshed when the SQL Server service is restarted. Both reports can be viewed by right-clicking on the database, which you need to monitor its indexes, choose Reports -> Standard Reports and select the Index Usage Statistics or Index Physical Statistics report, as shown below:
The first report is the Index Usage Statistics report, that consists of two parts; the Index Usage Statistics report that shows statistics about the number of Scans, Seeks, Updates and Lookups with the latest date for each operation, that is retrieved by querying the sys.dm_db_index_usage_stats DMV, as shown below:
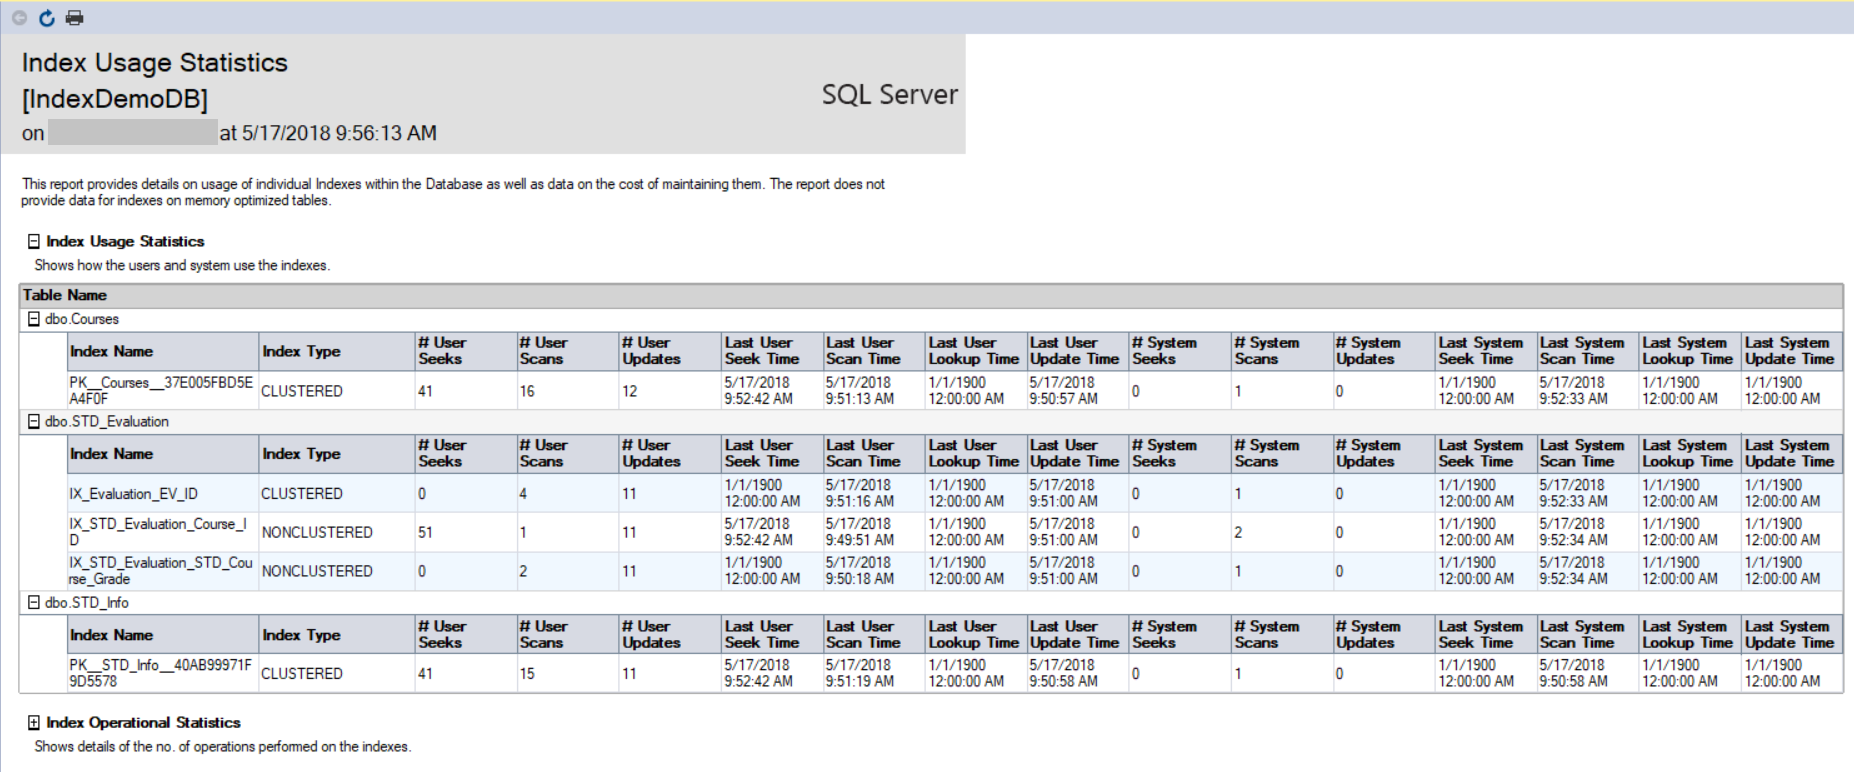
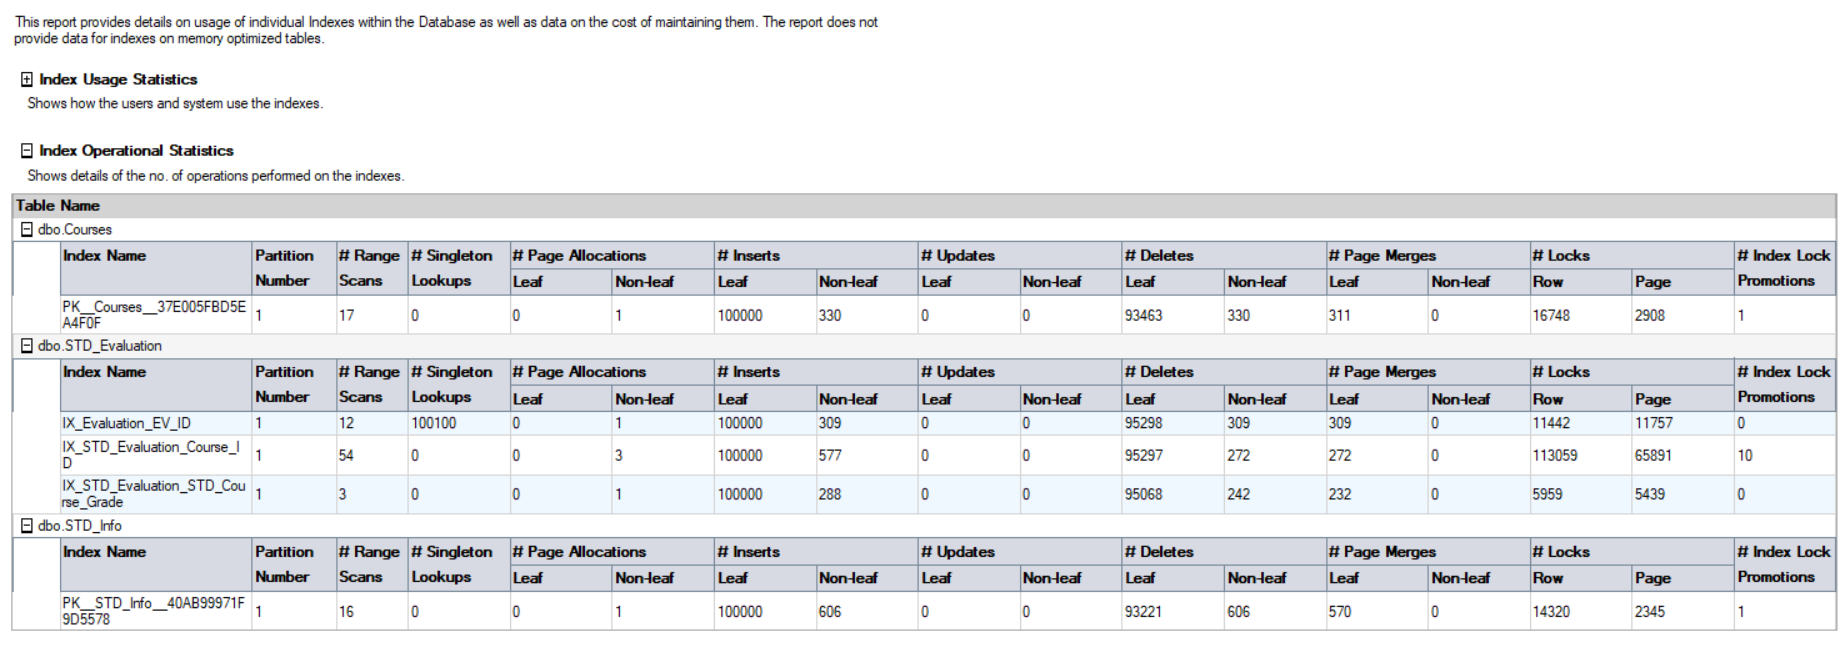
Note that the result in the report differ from the previous DMV result, as the SQL Server service is restarted on my machine and a different workload performed on that database. The second part of that report is the Index Operational Statistics, that returns the number if I/O INSERT, UPDATE and DELETE operations occurred on that database. The statistics in that report are retrieved by querying the sys.dm_db_index_operational_stats(db_id(),null,null,null) DMF, as shown below:
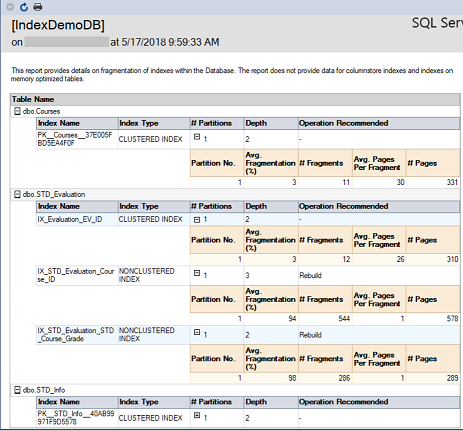
The second report is the Index Physical Statistics report, that returns statistics about the index partitions, fragmentation percentage and the number of pages on each index partition. This report also gives the recommendation to rebuild or reorganize the index depending on the fragmentation percentage of the index. The recommendation provided by that report does not take into consideration the size of the table. If you try to rebuild an index on a small table, you may still receive the same recommendation from that report. The report in our case will be as shown below:
In this article, we described the different methods that can be used to gather statistical information about the SQL Server indexes structure and usage. stay tuned for the last article in this series, in which we will describe how to maintain the SQL Server indexes.
Table of contents

He is a Microsoft Certified Solution Expert in Data Management and Analytics, Microsoft Certified Solution Associate in SQL Database Administration and Development, Azure Developer Associate and Microsoft Certified Trainer.
Also, he is contributing with his SQL tips in many blogs.
View all posts by Ahmad Yaseen
- Azure Data Factory Interview Questions and Answers - February 11, 2021
- How to monitor Azure Data Factory - January 15, 2021
- Using Source Control in Azure Data Factory - January 12, 2021