

A few years ago, one common business case I came across in my professional career that required modelling of data into a many-to-many entity relationship type was the representation of a consultants and their projects. Such a business case became a many-to-many entity relationship type because whilst each project can be undertaken by several consultants, consultants can in turn be involved in many different projects. When it came to storing such data in a relational database engine, it meant that we had to make use of bridging tables and also make use of several self-joins to successfully query the data.
However, with recent focus on big data for many of my clients, we have experienced an increase in different business requests that requires for many-to-many data modelling. Consequently, as a Microsoft shop we’ve had to turn to other non-Microsoft products to ensure that we optimally respond to such business requests. Not surprisingly, ever since word got around that graph database will be part of SQL Server 2017, we’ve been looking forward to this latest release of SQL Server. Having played around with the graph database feature in SQL Server 2017, we have noticed that unlike other graph database vendors, plotting and visualising the data out of the graph database is not readily available in SQL Server 2017. Luckily, thanks to SQL Server R, you can easily plot and visualise SQL Server 2017 graph database data without turning to 3rd party plugins. In this article, I demonstrate how SQL Server Machine Learning Services (previously known as SQL Server 2016 R Services) can be used to plot a diagram according to the data defined in a SQL Server 2017 graph database.
Case study: 300+ Premier League appearances
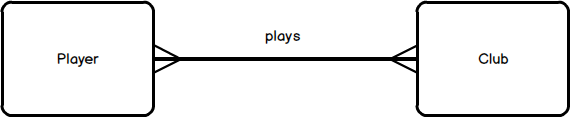
Avid readers of my SQLShack articles would probably have noticed that I’m a great fan of football, particularly, the English Premier League. Like in most sports, there are several traditions and milestones that are celebrated in the Premier League. One such milestone involves celebrating players who have made 300 (or more) appearances in Premier League games. This Wikipedia page provides a list of such players with their respective Premier League football clubs that they have played for. If you go through the list, you will notice that some players have played for multiple clubs in order to get to 300+ appearances whilst some of the clubs (i.e. Chelsea FC, Arsenal) have had several players play for them at some point. Thus, as shown in Figure 1, our case study indicates that a player can play for many Premier League clubs and a club can have many players.
Data modelling and storage: SQL Server 2017 graph database
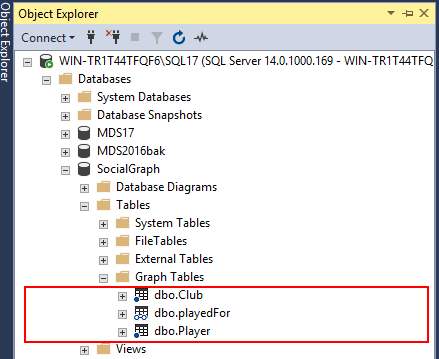
With the type of entity relationship illustrated in Figure 1, we proceed to create these entities in our sample instance of SQL Server 2017 graph database. Assuming that you already have a general understanding of graph databases and their implementation in SQL Server 2017, we have created SocialGraph database that consists of dbo.Player and dbo.Club node tables that are used to store a list of player and club names, respectively. As per Figure 2, our graph database also contains a dbo.playedFor as our edge table.
For the purposes of this demo, we will limit the number of players and clubs to store in our graph database to just 5 per entity as per the INSERT T-SQL script shown in Script 1.
|
1 2 3 4 5 6 |
INSERT INTO [Club]([name]) VALUES('Tottenham Hotspur'), ('Chelsea'), ('Manchester City'), ('Arsenal'), ('West Ham United'); GO INSERT INTO [Player]([name]) VALUES('Frank Lampard'), ('Petr Cech'), ('Cesc Fabregas'), ('Gael Clichy'), ('William Gallas'); GO |
The INSERT T-SQL script for populating the edge table is quite lengthy, as a result it has been provided for download under the Downloads section at the bottom of this article.
Graph database visualisation using SQL Server R
Having setup and populated our SQL Server 2017 graph database, we proceed to plot and visualise our graph by using the R language which is part of the Machine Learning Services in SQL Server 2017. In order to successfully achieve our objective of visualising our graph database data in SQL Server R, we need to download and install several R packages according to the following steps:
Step 1: download and install igraph R package
The igraph is an efficient package in R that can help with network analysis and plotting of simple graphs. There are several ways of downloading and installing the igraph R package the one that worked for me was to manually download it to a local folder on my machine as a windows binary package from igraph.org, and later installed it using the R.EXE application shown in Figure 3.
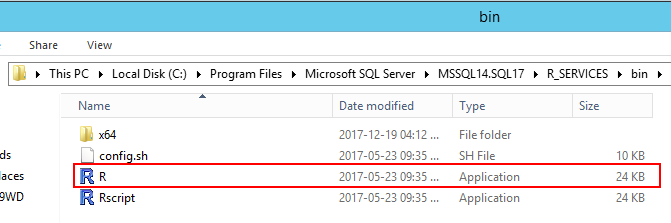
Again, assuming that you are already familiar with R package installation in SQL Server, the installation of igraph R package should be straight-forward as shown in Figure 4.
To install the igraph package, we simply run the install.packages command with a path to where the downloaded file is stored, in my case I kept it in the E drive as shown in Figure 4.

Step 2: install magrittr R packages
Having the igraph package is not enough as you may still run into the error message shown in Figure 5 when trying to execute your R script. Lastly, in addition to successfully installing igraph R package, you may also need to install the magrittr R package as the igraph R package requires it.
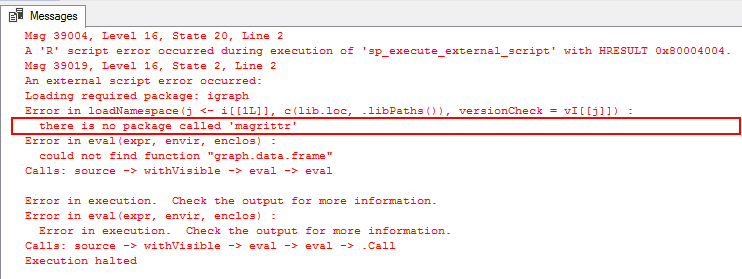
Similarly, to the installation of igraph, I got around this error by downloading a copy of the magrittr package, saved it into my local E drive and installed it using the R.EXE application.
Step 3: prepare and execute R script
Finally, now that we have installed all required R packages, we proceed to plotting our graph using the script shown in Script 2. Obviously, you can choose different image file type but I have opted to plot our graph into a PNG file.
|
1 2 3 4 5 6 7 8 9 10 11 12 13 14 |
EXECUTE sp_execute_external_script @language = N'R', @script = N' require(igraph) g <- graph.data.frame(graphdf) V(g)$label.cex <- 2 png(filename = "c:\\temp\\PLVeterans.png", height = 800, width = 1500, res = 100); plot(g, vertex.label.family = "sans", vertex.size = 5) dev.off()', @input_data_1 = N' SELECT a.name, b.name as Club FROM player a, playedFor, Club b WHERE MATCH(a-(playedFor)->b);', @input_data_1_name = N'graphdf' GO |
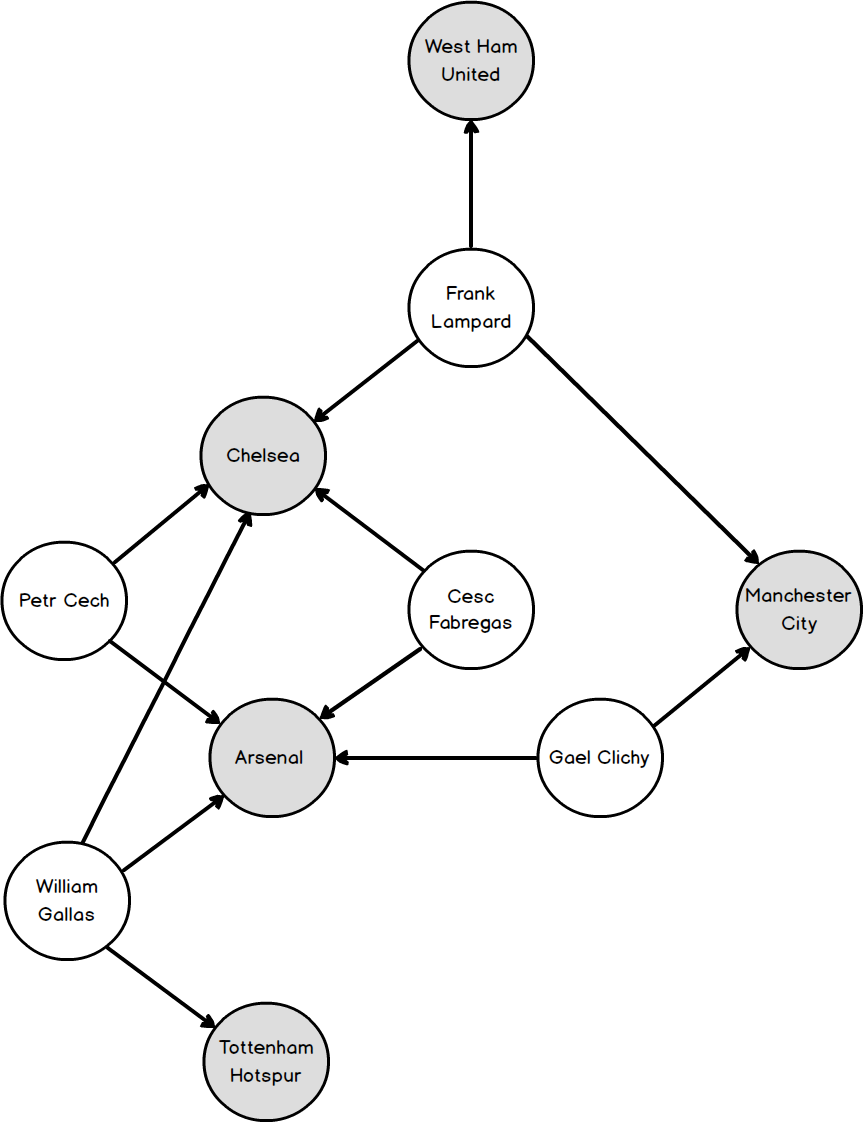
The generated PLVeterans.png image file is shown in Figure 5 wherein we can visualise the data from our sample SQL Server 2017 graph database. The graph indicates that whilst Frank Lampard and William Gallas played for 3 different Premier League clubs to get to their 300+ appearances, Chelsea and Arsenal had the most number of the so-called 300+ players appear in the Premier League through them.
Summary
The new graph database feature in SQL Server 2017 is a greater alternative to traditional relational databases particularly when it comes to modelling and implementation of many-to-many entity relationships. Furthermore, the integration of graph database with SQL Server 2017 Machine Learning Services such as the R language (along with the igraph R package) enables data scientist to successfully plot and visualise data from the graph database.
Downloads

Sifiso's LinkedIn profile
View all posts by Sifiso W. Ndlovu