

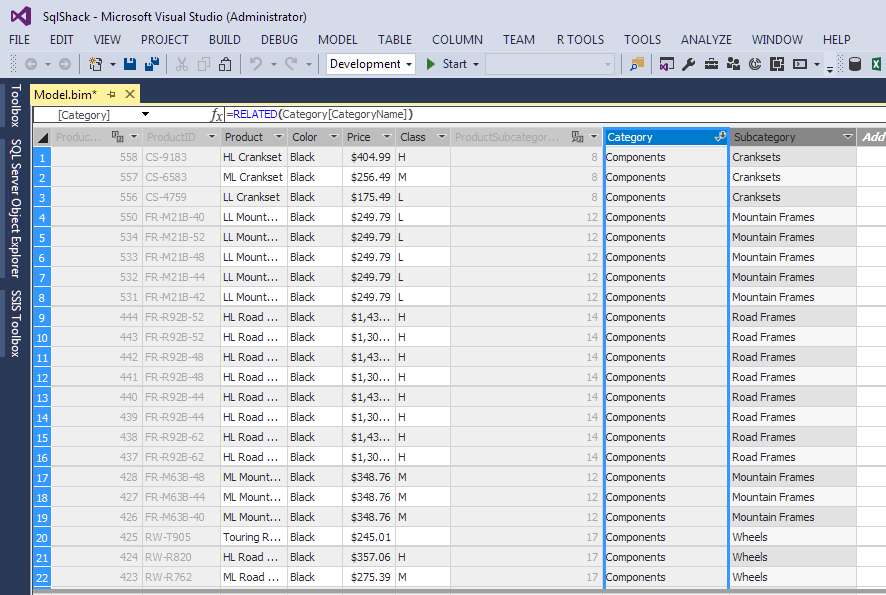
In this article, a demonstration of the tabular model will try to related multidimensional cube design to the path forward Microsoft is giving used s with new versions of Analysis Services. Even though the descriptive names are changing, the tabular model still accomplishes the centralized business rules multidimensional cubes gave the business intelligence world. This is enforced by speed obtained from in-memory technology and simplification of the interface for the masses.
The tabular model of SQL Server Analysis Services shifts focus from dimensions and cubes to tables, relationships, and measures. Coming from the cube world, this seems a little off. It is not until you get into the DAX (Data Analysis eXpression language) do you really start to see the significance of the new modeling tool for Business Intelligence. But before jumping into DAX, a Tabular Model has to be constructed from the same dimension and fact tables used for cubes. The same holds true for tabular as multidimensional, a data mart works best for final table structures.
The first step in importing tables and data is selecting a table, view or T-SQL statement to bring data into a Tabular Model. The easy way is to just select the tables like Figure 1.
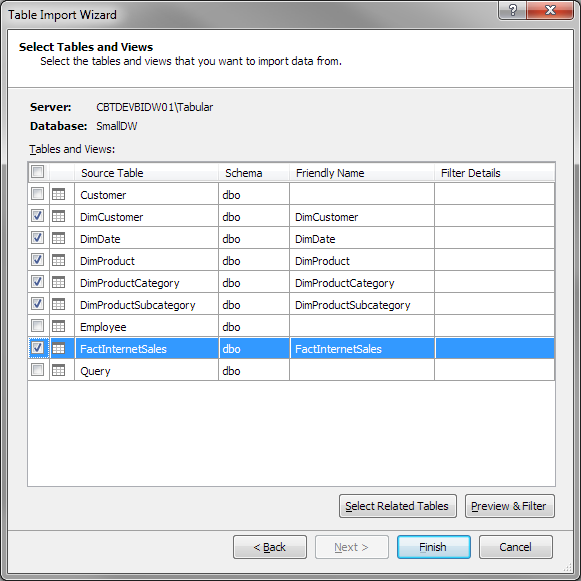
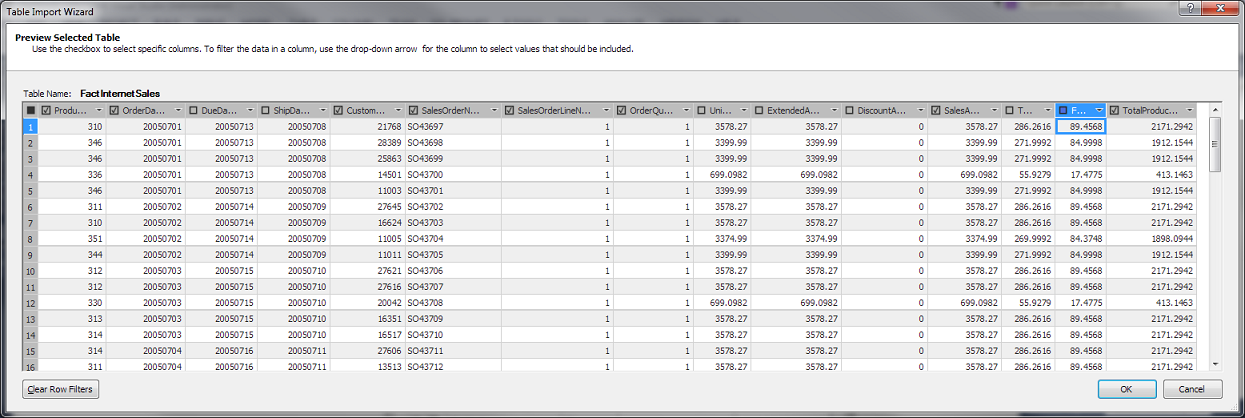
The problem with this method is you get all the columns from all the tables selected. The next option would be to click the Preview & Filter button in the Table Import Wizard to only select reportable columns…for now. You can also rename the table from DimCustomer to Customer on this screen. This is the Friendly Name property of a table in the Tabular Model. Figure 2 shows removing some of the columns from the FactInternetSales table. Internet Sales is where the measures would be created.
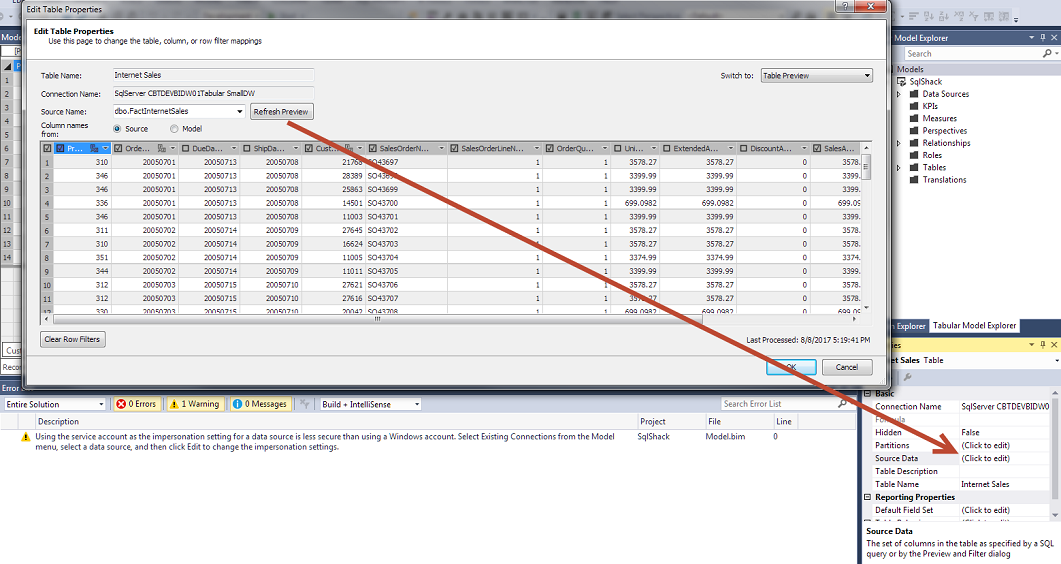
The will change the T-SQL behind the initial import and future processing of new data. Instead of a SELECT *, the T-SQL now only selects the columns needed. You can always edit this graphically or with the text from the Model editor. Figure 3 shows the edit screen with a pointer to the property Source Data of a table.
The last option is to create a view in the database and select it as the Source Data. The big issue here is the Tabular Model cannot see the Foreign Key(s) from the underlying table of the view. Manually adding these relationships can be done in the Diagram view.
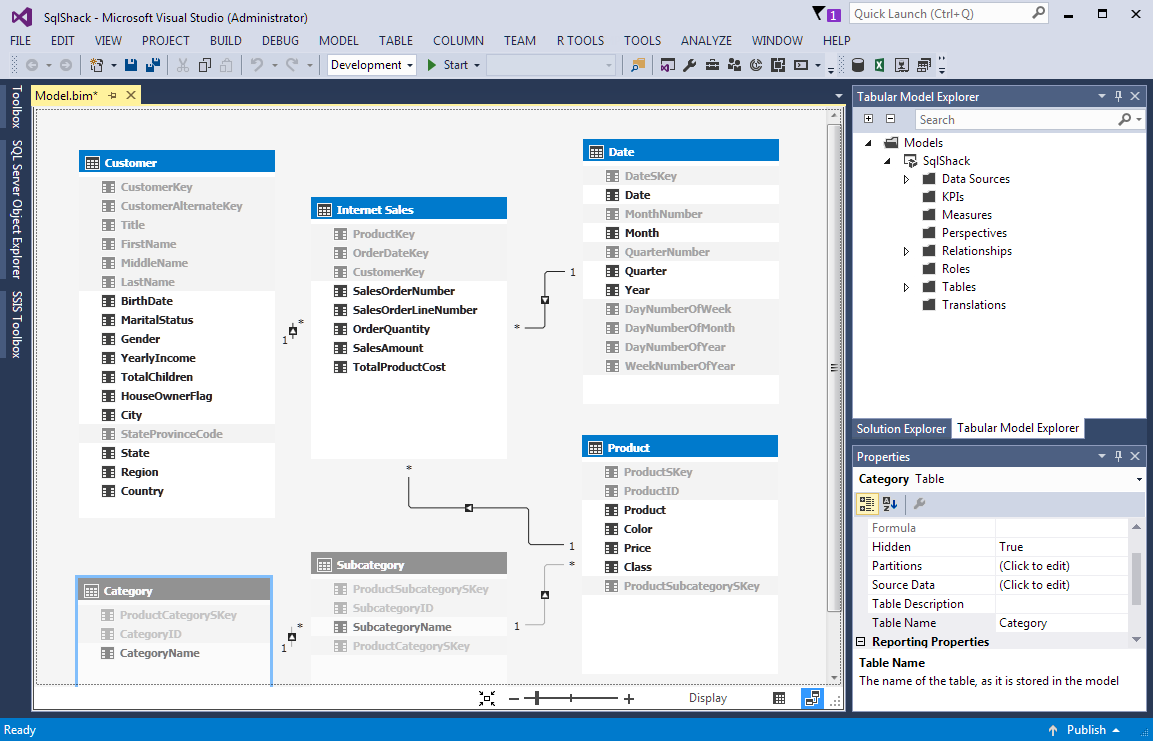
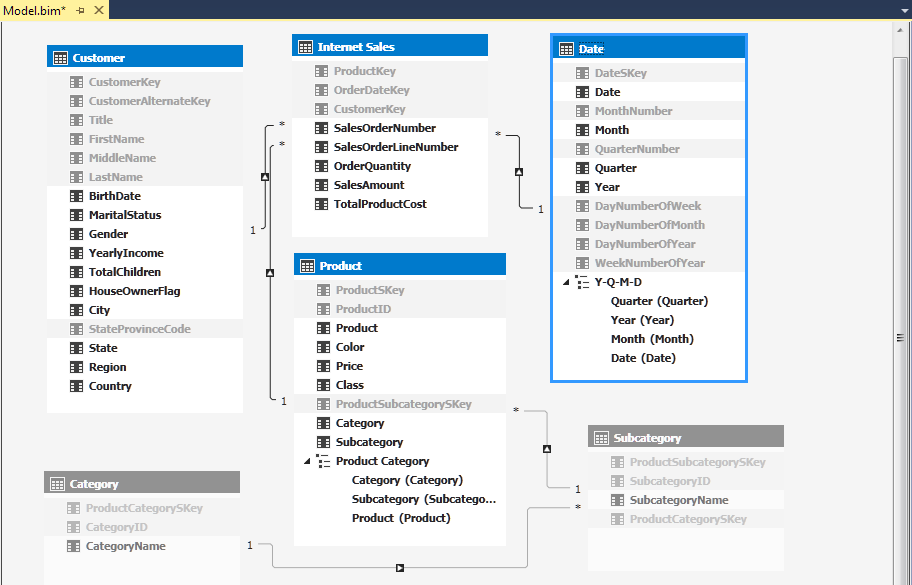
Once we have the tables in the model, like Figure 4, we can start to use tabular features to enhance the client tool view. The dimension tables are Customer, Date, Product, Subcategory and Category. The Fact table is Internet Sales.
The surrogate key columns in each dimension table needs to be hidden from client view. The easiest way to do this is in the Diagram view. The Key columns can be multi-selected by using the Control key while clicking on each column. Then, right-clicking on one of the columns and selecting Hide from Client Tool from the submenu.
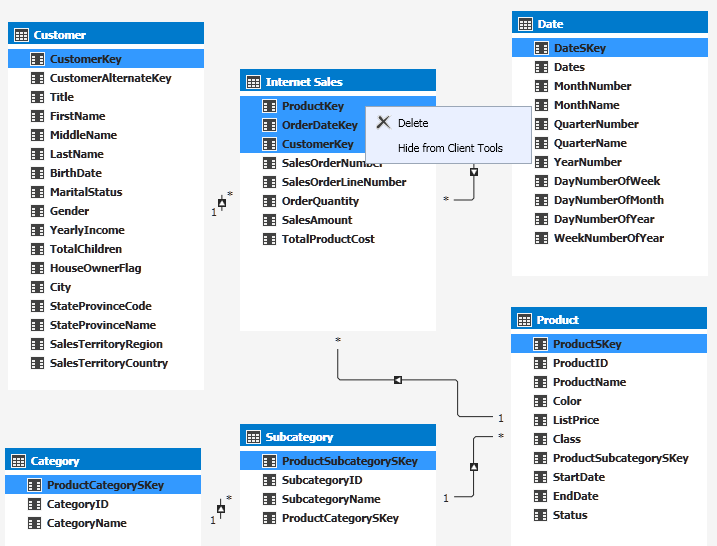
These columns have to be keep in the model because that is how the relationships are built. The ID columns in Category, Subcategory and Product can be hidden as well. They are the business key of the table and do not have to be in the model. To clean up the rest of the dimension tables, we are going to do the following.
-
Customer
- Hide columns Title, Firstname, LastName, MiddleName and StateProvinceCode
-
Rename
- StateProvinceName to State
- SalesTerritoryRegion to Region
- SalesTerritoryCountry to Country
-
Product
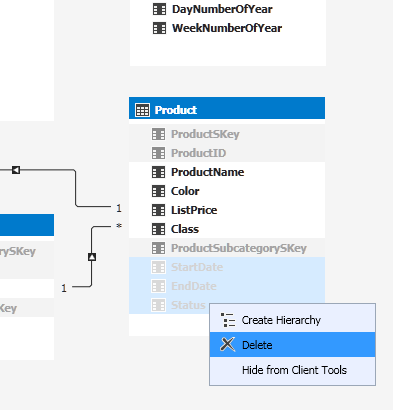
- Delete columns StartDate, Enddate and Status (Figure 6)
-
Rename
- ProductName to Product
- ListPrice to Price
-
Date
- Hide columns MonthNumber, QuarterName, DayNumberOfWeek, DayNumberOfMonth, DayNumberOfYear and WeekNumberOfYear
-
Rename
- MonthName to Month
- Dates to Date
- QuarterName to Quarter
- YearNumber to Year
- Subcategory and Category tables will both be hidden.
The current state of the model is like Figure 7. Tables Subcategory and Category are hidden because a hierarchy needs to be created containing column CategoryName, SubcategoryName and Product. The only way this can be done is in one table. So, these columns need to be added to the product table in the Model.
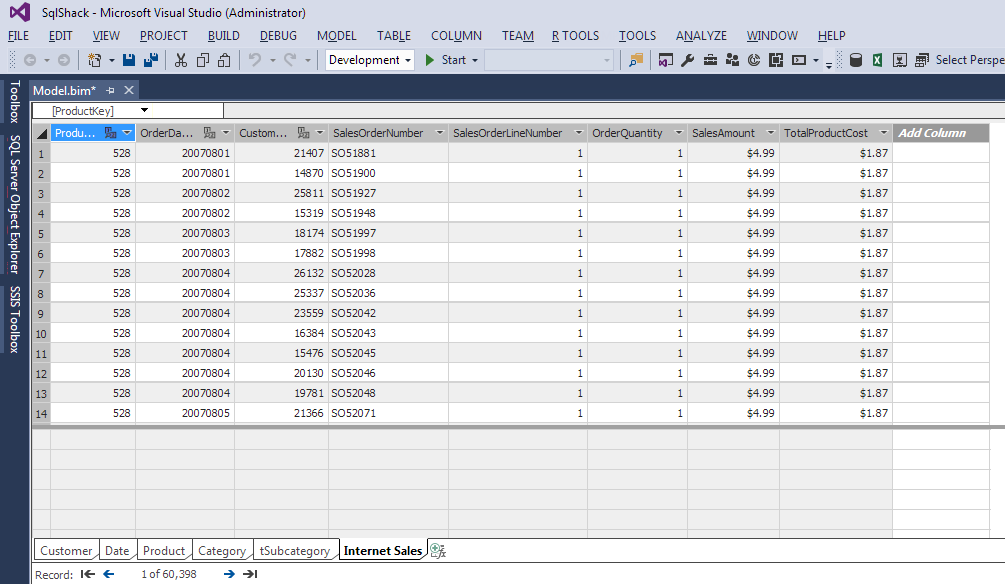
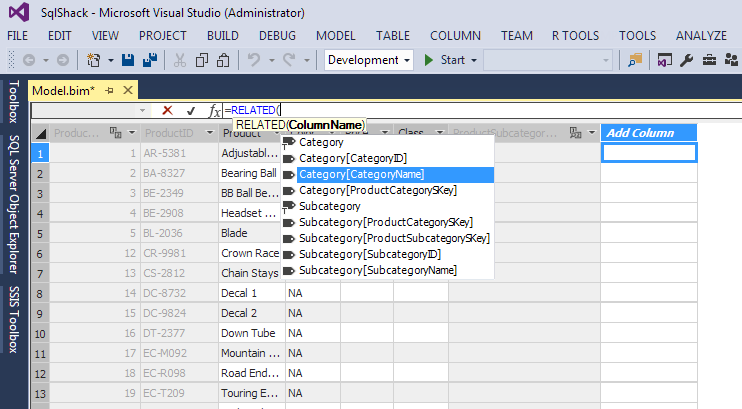
Switching back to the Grid view, focus is now on the Product tab or table. By scrolling to the last column, the next new column has a header of Add Column. A DAX formula can be placed in the new column to pull the CategoryName from the Category table as well as the SubcategoryName. Figure 8 shows the RELATED () DAX function being used to get the CategoryName. The IntelliSense shows that the Category[CategoryName] can be added to the product. This is possible because of the relationship between Product and Subcategory, then Subcategory to Category.
After renaming the columns, the product tab now looks like Figure 9. Renaming the column can be accomplished by right-clicking on the column heading and selecting Rename from the submenu. Also, the properties dialog in the lower right has a Column Name property which can be used to rename a column.
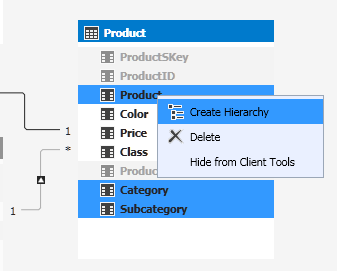
Switching back to the Diagram view, the Product table now has the columns needed for the hierarchy. Holding the control key down and selecting the 3 columns, Category, Subcategory and Product, enable the ability to right-click and create a hierarchy from the selected columns. After these steps, right-clicking the hierarchy1 title and selecting rename can complete this hierarchy by changing the name to Product Category.
This can be repeated for the date hierarchy of Year, Quarter, Month and Date like Figure 11.
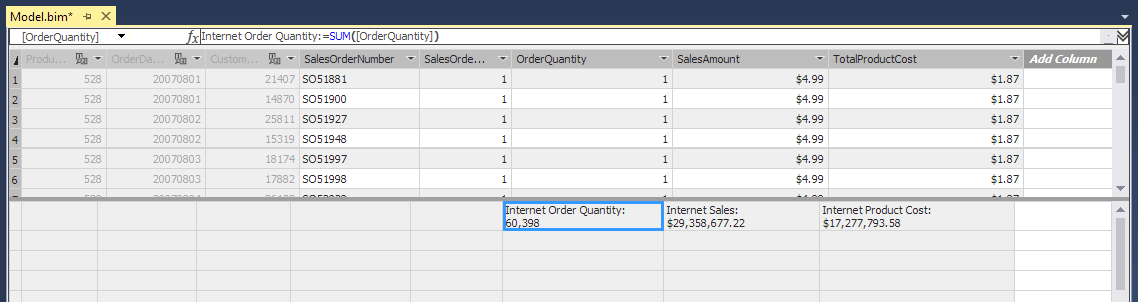
Switching back to the Grid view, the measures will need to be created in the Internet Sales tab. The Measure DAX expression for Sum of Sales is Internet Sales:=SUM([SalesAmount]). The same can be repeated for the OrderQuantity and TotalProductCost measures. Figure 12 shows the new Measures as well as Hiding the columns for the Client Tool. The columns are no longer needed because the Measures created with SUM() DAX function is used in reporting.
To preview the model, under the Model menu there is a sub-menu for Analyze in Excel. Take the defaults for User Name and Roles to connect and click OK. A PivotTable in Excel with be selected for the connection to the Analysis Service Tabular Model. The PivotTable Fields will list the SUM measures with the summation character at the top of the list. These are the columns to go in the Values area on the bottom right of the Pivot Table. Selected in figure 13 is Y-Q-M-D for columns, Product Category for Rows and Internet Sales for Values.
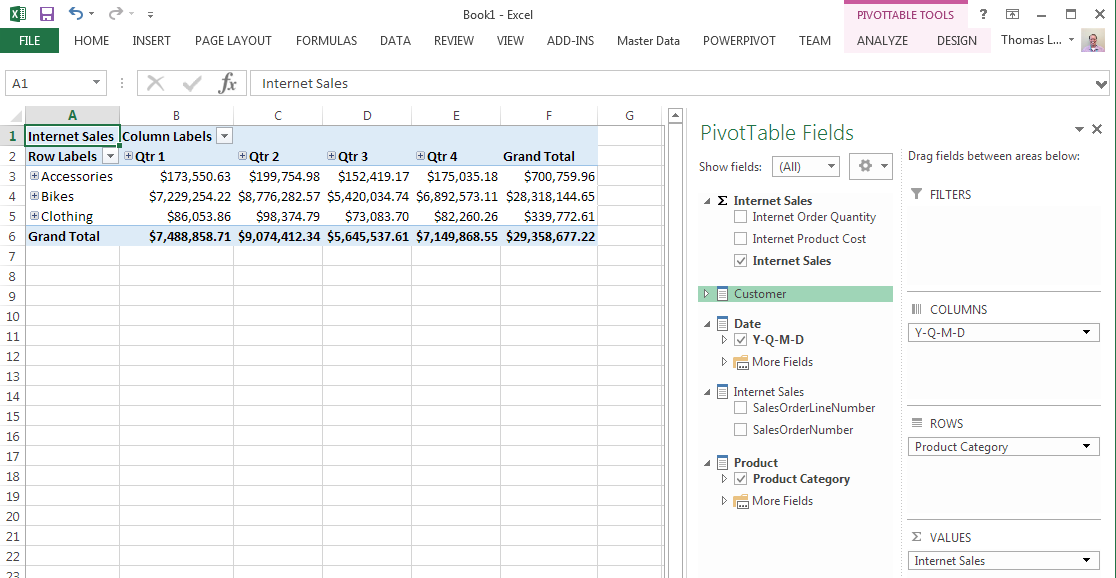
The amount of time to get a useful analysis of Internet Sales by Year/Quarter/Month sliced by Product Category hierarchy is minimal. This tabular model can now be handed to end users to start developing more insight into the data. There are more requirements to come from the end users once they get this ability to slice and dice data.
Previous articles in this series:
- SQL Server Data Warehouse design best practice for Analysis Services (SSAS)
- Connecting to Data Source(s) with SQL Server Analysis Services
- Initial Attributes and Measures in SSAS Multidimensional Cubes
- Analysis Services (SSAS) Cubes – Dimension Attributes and Hierarchies
References

Starting as a developer in COBOL while at LSU, he has been a developer, tester, project manager, team lead as well as a software trainer writing documentation. Involvement in the SQL Server community includes speaking at SQLPASS.org Summits and SQLSaturday since 2011 and has been a speaker at IT/Dev Connections and Live! 360.
Currently, he is the Chair of the PASS Excel Business Intelligence Virtual Chapter and worked on the Nomination Committee for PASS Board of Directors for 2016.
View all posts by Thomas LeBlanc
- Performance tuning – Nested and Merge SQL Loop with Execution Plans - April 2, 2018
- Time Intelligence in Analysis Services (SSAS) Tabular Models - March 20, 2018
- How to create Intermediate Measures in Analysis Services (SSAS) - February 19, 2018