

The whole premise of Analysis Services (SSAS) is to place business logic into a central repository (a database). This central repository should be easy to understand from the average reporting user. Simplicity for SSAS databases starts with the Dimension and Fact tables in a data mart or data warehouse. These tables need to have as little additional computed columns as necessary. With this design, adding additional Measures to the SSAS database, both Multidimensional Cubes, and Tabular Models, can help with performance monitoring of the company’s indicators.
The fact tables should be full of keys to the dimensions and measurable columns to use in an Analytical database type structure. If this is done, SSAS can use its own language to calculate ratios, percentages, targets, and indicators. The MDX language is used for cubes and DAX language is used in tabular models. These measures will assist the reporting of performance measures. Reporting tools like Excel Pivot Tables and Power BI can benefit from these databases while using visualization objects.
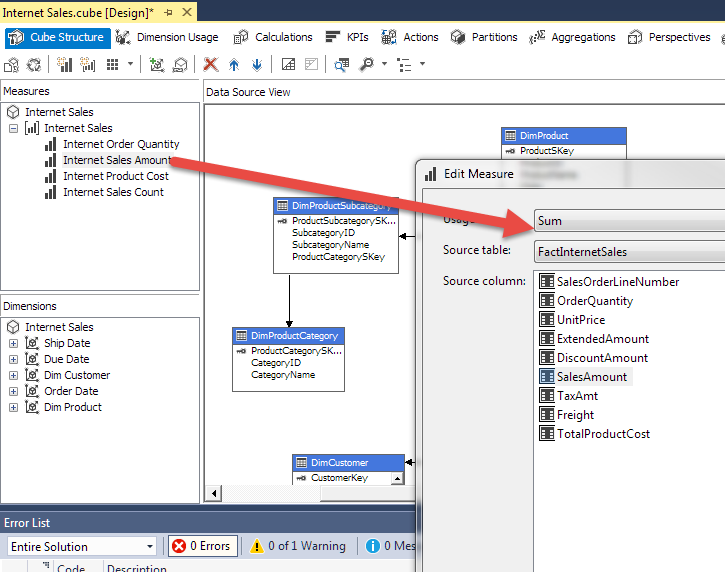
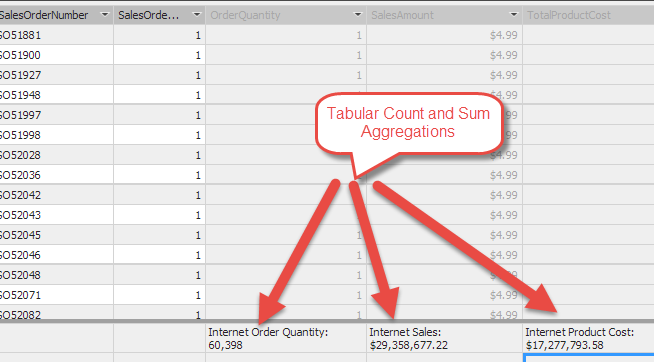
This article will look at a calculation and how SSAS can help centralize the logic in cubes and tabular models. The ratio is called Gross Profit Margin. Figure 2 shows the simple counts and sum for aggregate measures in a Multidimensional Cube. These were created using the cube wizard and will be used in the Gross profit Margin calculation.
Multidimensional cube
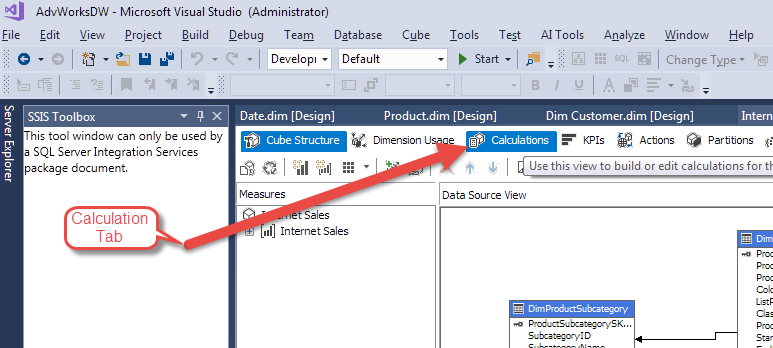
The Gross Profit Margin (GPM) calculation is the Sum of Line Item Sales minus the Sum of Line Item Costs divided by the Sum of Line Item Sales or GPM = ( Sum( Sales ) – Sum( Cost) ) / Sum( Sales). This ratio can be easily created in SSAS and formatted as a percent. The Cube measure will be created in the Calculation tab. Figure 3 shows the Calculation tab once the Cube is opened for editing.
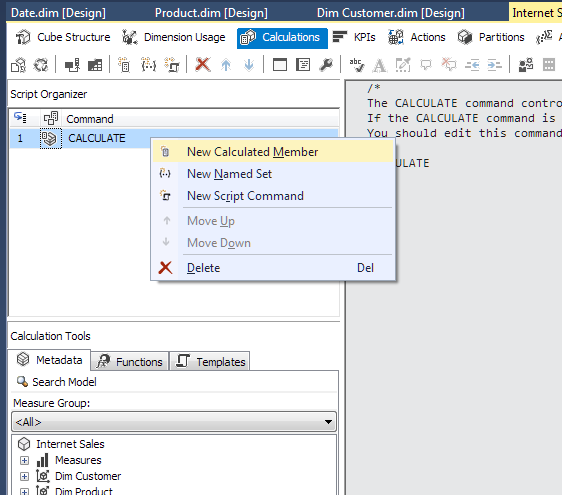
A new Calculation can be added by right-clicking the CALCULATE List under the Command on the upper-left part of the screen shown in Figure 4. There are additional options for New Named Set and New Script Commands in addition to the New Calculated Member option.
Once New Calculated Member menu is chosen, the editor is enabled for the Measure. We will change the Name to Internet GPM and use this as the expression:
( [Measures].[Internet Sales Amount] – [Measures].[Internet Product Cost] )
/ [Measures].[Internet Sales Amount]
The Format String should be “Percent” and the Non-empty behavior needs to have [Internet Sale Amount] selected. This prevents divide by zero errors. The calculation result will be Null rather than an error in Non-empty behavior is used.

Now, deploy the cube and Analyze in Excel. Analyze in Excel is an option in the browser tab of the cube. Multidimensional Cubes have to be deployed before viewing changes. The Tabular has an in-memory copy that can be viewed after the change.
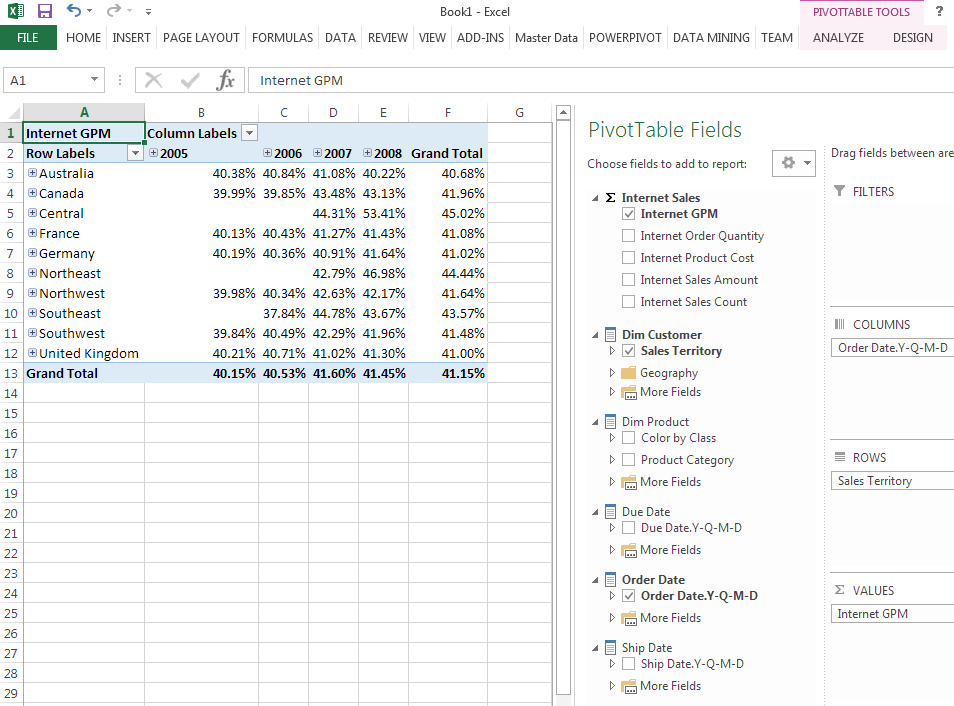
The ratio or percentage is really valuable to end users that display the measure this one Analysis Service Database. No need to duplicate the calculation in multiple reports and risk having different values. If you do see different values, look at what the end user is using as filters.
Tabular model
To create the same measure in a Tabular SSAS database, we need to select the table tab to contain the measure. Usually, this is the same table as the columns needed for the calculation but does not have to be. In this example, that is the Internet Sales tab.
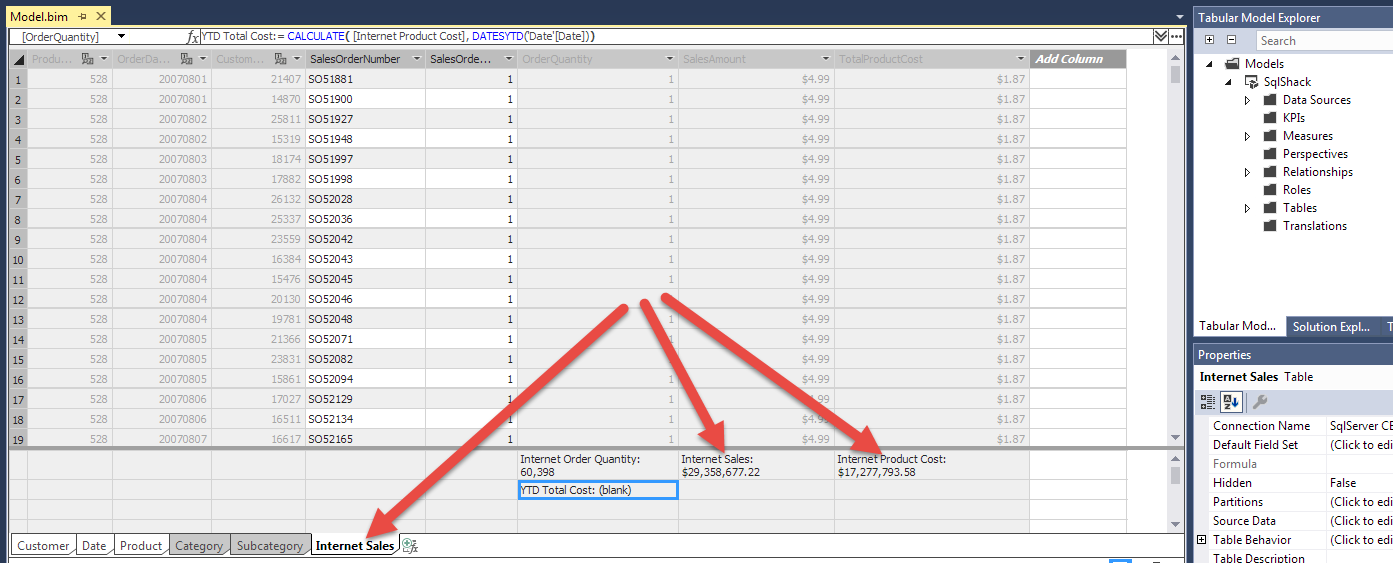
The bottom portion of the table is where Measures are created. The Internet Sales and Internet Product Cost are shown in Figure 7. The calculation will be like the Multidimensional Cube already shown above but with the DAX language syntax and not MDX.
Internet GPM := CALCULATE( ( [Internet Sales] – [Internet Product Cost]) / [Internet Sales])
The CALCULATE is needed to use the existing measures for Sale and Cost. The Measures are computed based on Filter Context. Row Context is used for row-level computed columns. The measure also needs to be formatted as Percentage in the Properties of the measure.
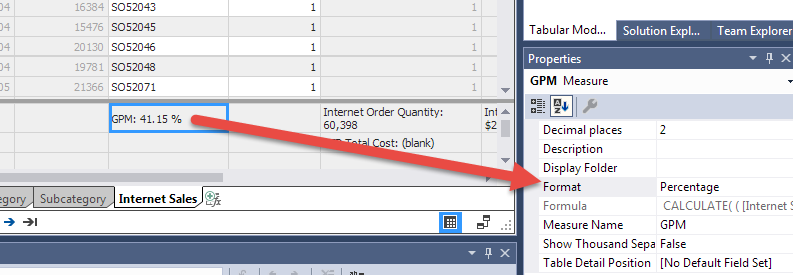
Once the results are Analyzed in Excel, the measure displayed will be the same as a cube.
Once we have a ratio like Gross Profit Margin in an SSAS database, there is another powerful function available. The KPI or Key Performance Indicator allows for a target to be compared with the value along with an upper and lower limit. The KPI has a status indicator for something like a red light. Green is good, yellow is average and red is below average. Figure 11 shows the setup for a Tabular Model SSAS database.
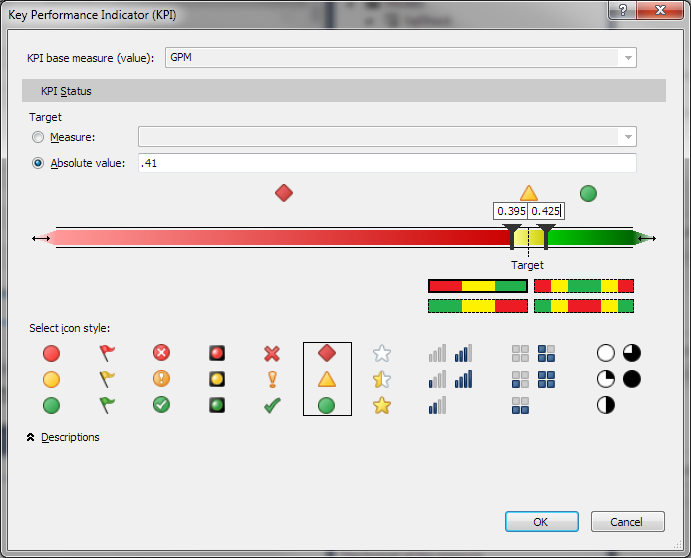
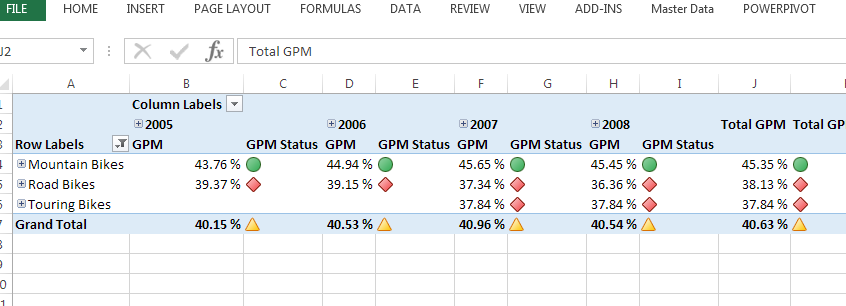
The fixed or absolute value is .41. So, the Internet GPM on average should be 41%. The lower is 39.5% and the upper is 42.5%. These numbers are used in order to preview data that is above and below the thresholds and do not represent actual uppers and lowers. The icon style provides various visualizations of the status. This KPI has a diamond for red, triangle for yellow and circle for green. Figure 12 now shows the KPIs with the previous Analyze in Excel results.
Notice in Figure 9, the KPI can be compared to a value in a Measure. This allows a company to place the Target values in a database table. The table can be added to the model in order for values to be used in a more flexible means. The data can be based on Category and Year. This eliminates the need for an absolute value for all comparisons.
References

Starting as a developer in COBOL while at LSU, he has been a developer, tester, project manager, team lead as well as a software trainer writing documentation. Involvement in the SQL Server community includes speaking at SQLPASS.org Summits and SQLSaturday since 2011 and has been a speaker at IT/Dev Connections and Live! 360.
Currently, he is the Chair of the PASS Excel Business Intelligence Virtual Chapter and worked on the Nomination Committee for PASS Board of Directors for 2016.
View all posts by Thomas LeBlanc
- Performance tuning – Nested and Merge SQL Loop with Execution Plans - April 2, 2018
- Time Intelligence in Analysis Services (SSAS) Tabular Models - March 20, 2018
- How to create Intermediate Measures in Analysis Services (SSAS) - February 19, 2018