
Just like in Santa’s Bag of Goodies, every release of SQL Server often has something for everyone – be it enhancements to DMVs for the DBAs, new functions for T-SQL developers or new SSIS control tasks for ETL developers. Likewise, the ability to effectively support many-to-many relationships type in SQL Graph has ensured that there is indeed something in it for the data warehouse developers in SQL Server 2017. In this article, we take you through the challenges of modelling many-to-many relationships in relational data warehouse environments and later demonstrate how data warehouse teams can take advantage of the many-to-many relationship feature in SQL Server 2017 Graph Database to effectively model and support their data warehouse solutions.
Traditional data warehouse modelling
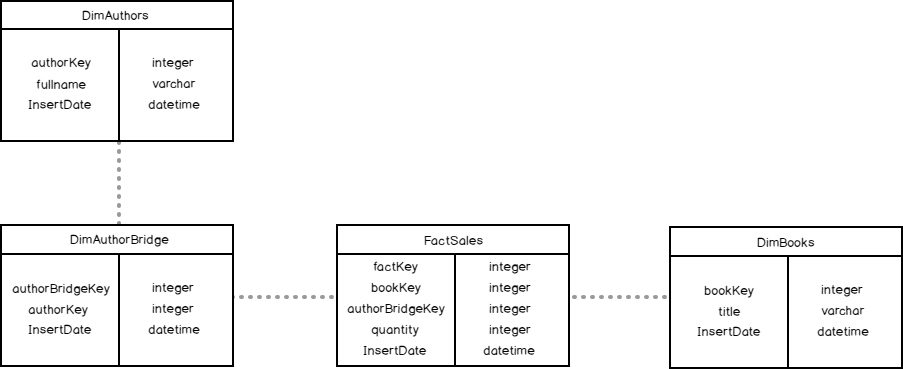
Typical data warehouse models usually depict a collection of dimensions and fact tables linked together to form a star or snowflake schema. Figure 1 depicts one such multidimensional star-schema model for a sample Book Sales Data Mart wherein all the dimensions are linked together by a centralised FactSales table.
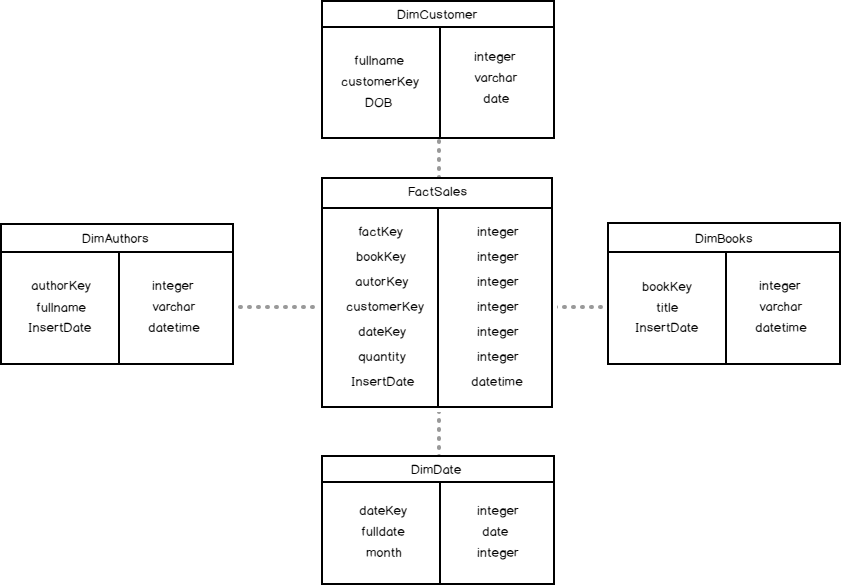
Figure 2 shows a preview of the data for DimAuthors, DimBooks as well as FactSales tables that have been created based off the design in Figure 1.
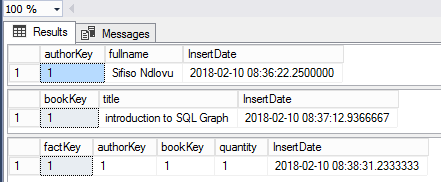
Given the nature of the data in our tables, we can easily answer business questions such as: How many books have been sold? Such a business question can be answered by writing a T-SQL query that involves aggregation of data from the quantity column in FactSales tables as shown in Script 1.
|
1 2 3 4 5 |
SELECT title, SUM(quantity) [Number Of Books Sold] FROM [BookSalesMart].[Fact].[Sales] a INNER JOIN [BookSalesMart].[Dim].[Books] b ON a.bookKey = b.bookKey GROUP BY title; |
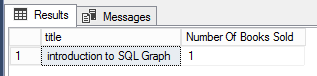
Figure 3 shows us the results of executing Script 1 and it can be seen that only a single copy of Introduction of SQL Graph has been sold thus far.
Many-to-many relationships in a data warehouse
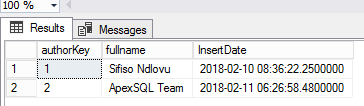
The multidimensional model represented in Figure 1 is typically suitable for scenarios wherein there exist one-to-one and one-to-many relationship types i.e. a single author writes one or many books. However, it is quite plausible that several authors can collaborate to write a single book. Thus, whilst a single author can be linked to many books, a single book can also in turn be linked to several authors. However, given the multidimensional model shown in Figure 1, it would be difficult to link books sold to multiple authors in a fact table. To demonstrate such a challenge, let’s assume that for every book sold, authors of that book should get a portion of the revenue. This can only be done if the authors are correctly linked to the book being sold. Now, let’s further assume that our sample book Introduction to SQL Graph was actually co-authored between myself and the guys at ApexSQL. To ensure that both authors are financially credited whenever a sale of the book occurs, we would need to add another author entry into our Authors dimension such that when we later query the very same dimension we get to see two records as shown in Figure 4:
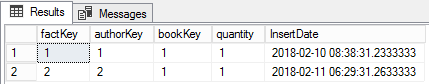
Next, we would need to find a way to indicate that the existing sale in our fact table (as shown in Figure 2) should be linked to both authorKey 1 and 2. The only way we could go about doing this – without having to change our design – would be to add another entry in the fact table that would be linked to the sale of our book as per the results in Figure 5.
However, notice that when we rerun our Script 1, the number of books sold has increased by 2 as shown in Figure 6.
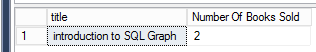
This is clearly incorrect as only one book has been sold thus far. Thus, the change to accommodate many-to-many relationship scenario in our existing star-schema model is causing incorrect calculations.
Bridge tables in many-to-many relationships
One of the ways we can go about catering for many-to-many relationships without causing incorrect counts against our fact table is to refactor our multidimensional model depicted in Figure 1 to introduce a bridge or junction table. The bridge table can be implemented in several ways but we are interested in a bridge table that will help us link several dimension values into a single fact transaction. Figure 7 shows one such bridge table in which DimAuthorBridge table is used to link multiple DimAuthors dimension values into a single fact transaction in FactSales.
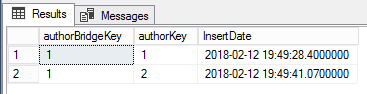
In terms of the data stored within the table, both authorKey 1 and 2 have been allocated a bridge table surrogate key (authorBridgeKey) value of 1 as shown in Figure 8.
In addition to refactoring the multidimensional model in Figure 1 to include a bridge table, you would have noticed in Figure 7 that we have also refactored the fact table to replace authorKey with authorBridgeKey. This bridge table surrogate key is then used in the fact table to link authors to the sale of a particular book as shown in Figure 9.
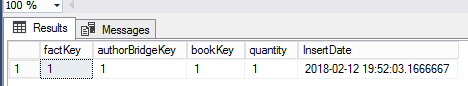
If we were to rerun Script 1 against the updated fact table shown in Figure 9, we should be able to return the correct number of books sold thus far – which is at 1.
Many-to-Many relationships using SQL graph
In an ideal data warehouse environment, you would want your joins between tables to be on primary keys but this is not always the case when bridge tables are used. Consequently, one limitation of using bridge tables is that the mere act of assigning similar surrogate key value (i.e. 1) to two or more authors for a successful grouping means that such bridge surrogate key is not unique thus prevents joins to a fact table on primary keys. An obvious downside to this approach is that not only could this lead to incorrect keys being assigned to a pair of authors, it could negatively affect the performance of queries against the bridge table.
Fortunately, SQL Server 2017’s support for graph databases provide us with another mechanism for implementing many-to-many relationships in our data warehouse environment. This could be done firstly breaking down dimensions and fact tables in Figure 7 into Nodes and Edges. Script 2 provides a CREATE TABLE syntax for objects that have been identified as either Nodes or Edges.
|
1 2 3 4 5 6 7 8 9 10 11 12 13 14 15 16 17 18 19 |
CREATE TABLE Books ( [bookKey] [int] IDENTITY(1,1) NOT NULL, [title] [varchar](50) NOT NULL, [InsertDate] [datetime2](7) NOT NULL DEFAULT (getdate()), ) AS NODE; CREATE TABLE Authors ( [authorKey] [int] IDENTITY(1,1) NOT NULL, [fullname] [varchar](50) NOT NULL, [InsertDate] [datetime2](7) NOT NULL DEFAULT (getdate()), ) AS NODE; CREATE TABLE Customer ( [customerKey] [int] IDENTITY(1,1) NOT NULL, [fullname] [varchar](50) NOT NULL, [InsertDate] [datetime2](7) NOT NULL DEFAULT (getdate()), ) AS NODE; CREATE TABLE bought (quantity INTEGER) AS EDGE; CREATE TABLE writerOf AS EDGE; |
Take note of the create syntax for edge table bought. You will notice that it has quantity parameter which will be used to record number of sales – which works almost similar to what the FactSales table was being used for in the Figure 1 and 7.
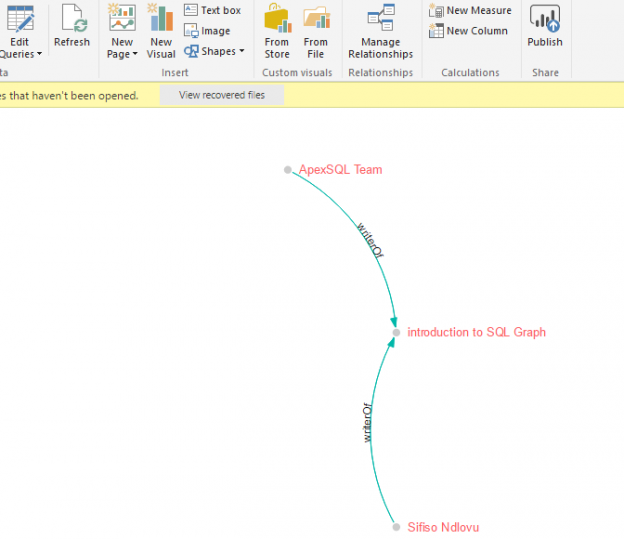
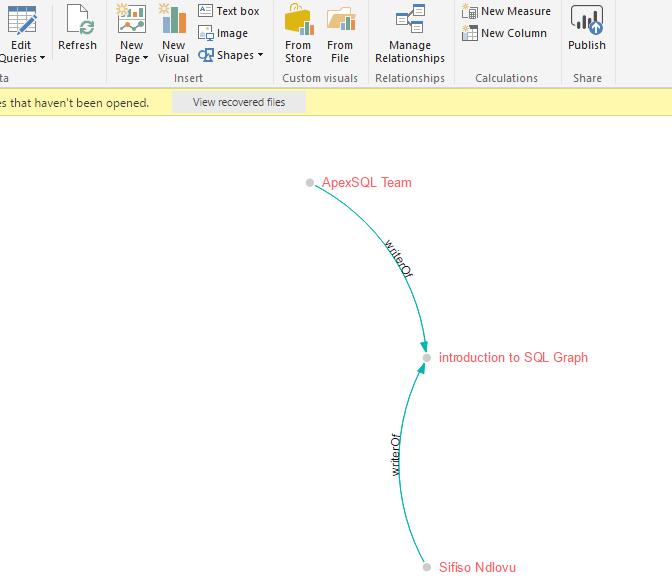
The next step involves populating the objects that we have created using Script 2. Key to capturing data in a graph database, particularly edge objects, is that we need to specify the FROM and TO nodes IDs – which helps us indicate how the nodes relate to each other. Having populated the objects in our graph database based off the data shown in Figure 2, we should end-up with a PowerBI preview of the data as shown in Figure 10.
Finally, Script 3 gives us the query that we could utilise to calculate the number of books sold.
|
1 2 3 4 |
SELECT Books.title, sum(bought.quantity) [Number Of Books Sold] FROM Customer, bought, Books WHERE MATCH (Customer-(bought)->Books) group by Books.title |
Summary
The star-schema model is often very useful where one-to-one and one-to-many relationship types exist between dimensions and fact table. When many-to-many relationship type occurs, a bridge table can easily be used to deal with such relationship type. Furthermore, the introduction of SQL Graph in SQL Server 2017 gives us another alternative approach to modelling many-to-many relationships in data warehouse environments.
References
- About Data Warehouse Dimensional Modeling Using a Star Schema
- Design Tip #142 Building Bridges
- MATCH (Transact-SQL)

Sifiso's LinkedIn profile
View all posts by Sifiso W. Ndlovu