
In the analytical world, time is an important slicer. The ability to view data over time helps analyze measures in actionable steps. An Analysis Service (SSAS) database can help accomplish this important step. Business users are going to want the ability to see measures a like year to date as well as the period over period comparisons. SSAS enables Time Intelligence with 2 features: the date table and DAX functions.
The SSAS Tabular Model will need to be built with a date dimension. Some people still reference this as a time dimension, but in most cases, the table will have dates and no times. There is such a thing as a time dimension with a time like 12:30PM and attributes like an hour and minute, but this article is all about the date – Year, Quarter, Month and Day.
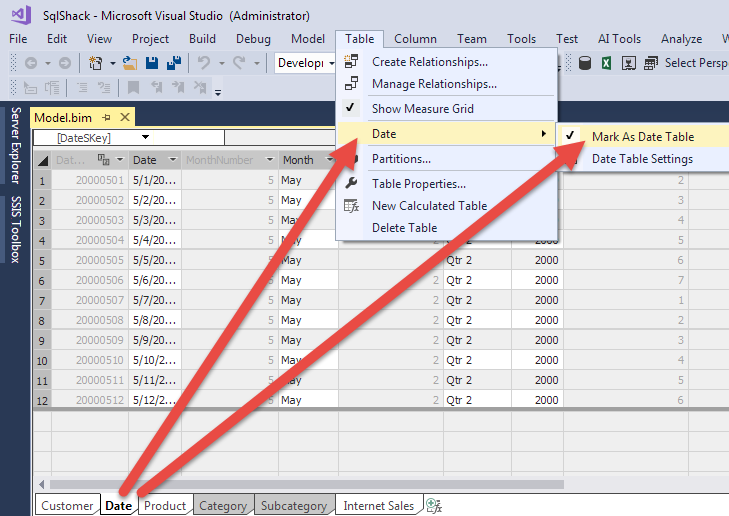
The import of this table is essential for Time Intelligence in a tabular model. Once the date table is imported, the table is marked as Date table. Figure 2 shows the menu choice for marking a table as date table.
NOTE: The table has to have a column that is unique and this column has to be a date or datetime data type. Also, an entry of -1 as a surrogate key with Nulls or unknowns in the attributes can throw off the Marking as Date table as well as DAX Time Intelligence functions.
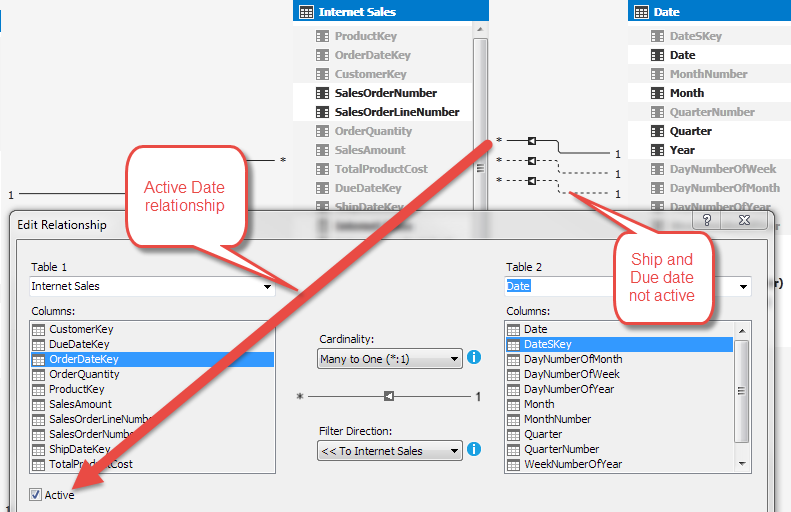
The relationship between the date table and the date keys in a fact table must be established for the Time Intelligence functions to work. In this example, the Internet Sale fact table has 3 columns that are related to the date dimension: Order Date, Ship Date and Due Date. Only one relationship can be active. Figure 3 shows the order date as the active relationship and Ship and Due date are inactive.
If you have multiple dates related to the date dimension from a fact, it might work best to name the date dimension like the related column – for instance, in this case, Order Date. The reason you might not want to do this is if the date dimension is related to another fact table in the same model and that column is not Order Date. More advanced DAX functions can be used to change the date that is related to the fact for a particular measure.
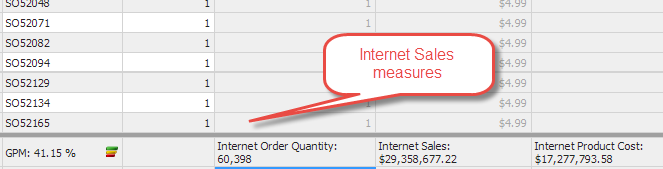
In order to use Time Intelligence, the model needs a measure to view over time. This example will use the Internet Sale Amount which has already been created as a SUM aggregation in the Internet Sales table. There are other measures like Total Product Cost and Gross Profit Margin that could be used.
The bottom pane of the table is where measures are created. It is best to keep them in the same tab as the fact table but it is not required. If included in another table, the references to columns used in the measure will have to have the table name specified.
The first example will be Year to Date for Internet Sales. The formula is simple:
|
1 |
YTD Internet Sales Amount:= CALCULATE ( 'Internet Sales'[Internet Sales], DATESYTD( 'Date'[Date])) |
The CALCULATE function is wrapped around the measure in order to evaluate the previous created measure Internet Sales. Without this, the DAX would not know to use Filter Context in order to calculate the Year to Date values. The DATESYTD DAX function has the Date column from the Date table to create the YTD evaluation. It does not use the Date Key (OrderDateKey) from the fact table because it is not a date data type.
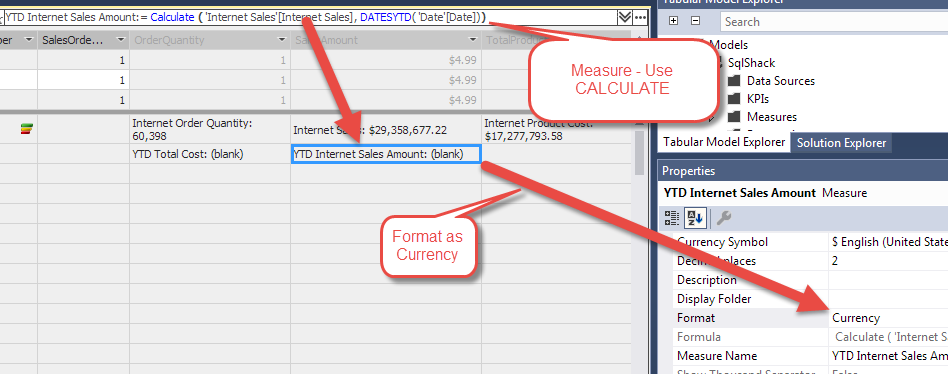
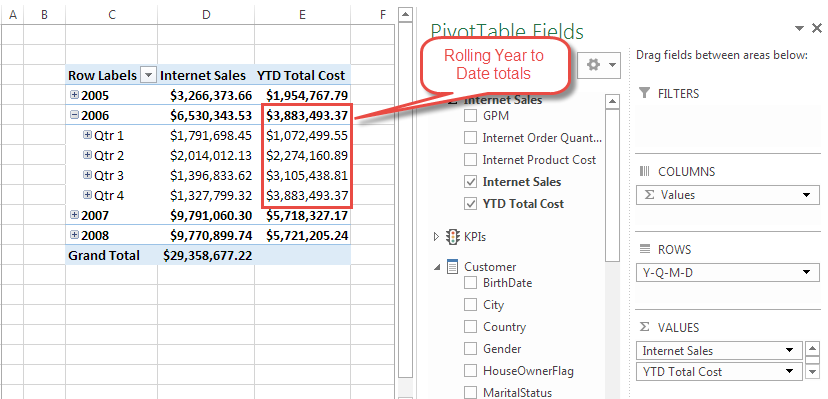
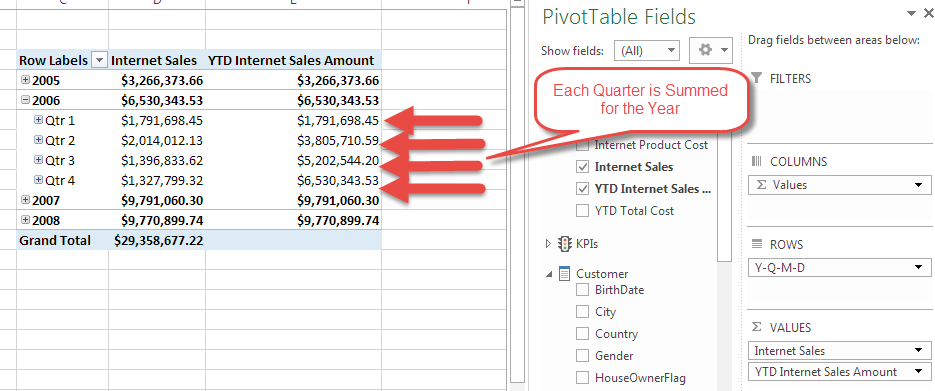
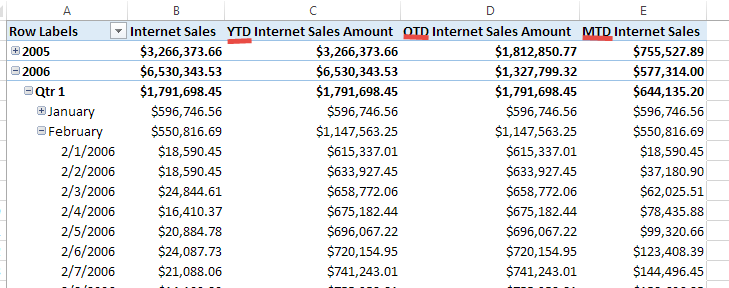
Also, notice the Format was changed to Currency. This is necessary so the results do not display as a number with no formatting. Figure 6 shows the Year to Date for each quarter of the selected year. Quarter 2 is the sum of Quarter 1 and 2 and so forth.
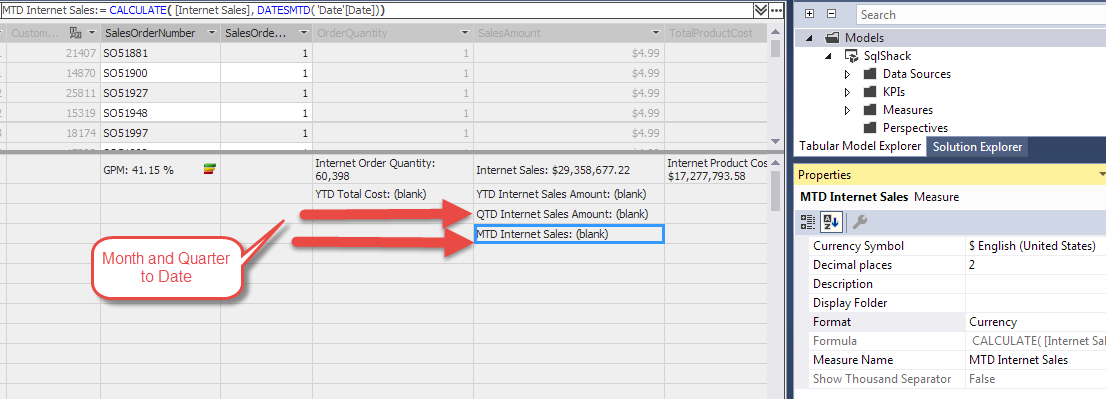
This type of measure can be created for Month to Date and Quarter to Date. The DAX functions are DATESMTD and DATESQTD. Figure 7 shows the 2 additional Time Intelligence measures
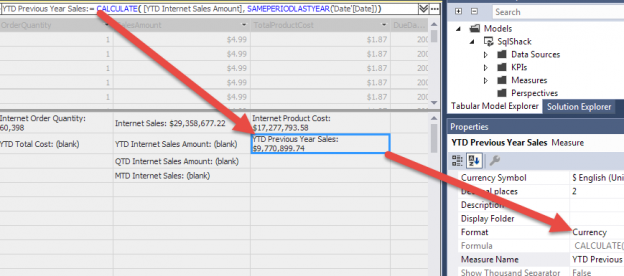
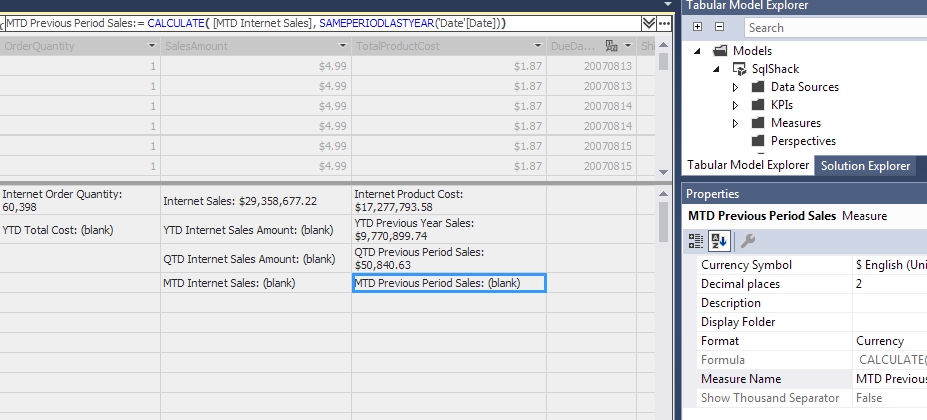
There are many functions available in Time Intelligence like Previous Period for Month, Quarter and Year. Figure 9 shows the SAMEPERIODLASTYEAR. Here, the expression used is the YTD Internet Sales. The new measure, YTD Previous Year Sales, uses the DAX function SAMEPERIODLASTYEAR and the same Date column from Date dimension as YTD Internet Sales Amount.

This can be repeated for Quarter and Month to Date measures. Figure 10 shows these in the SQL Server Data Tools project.
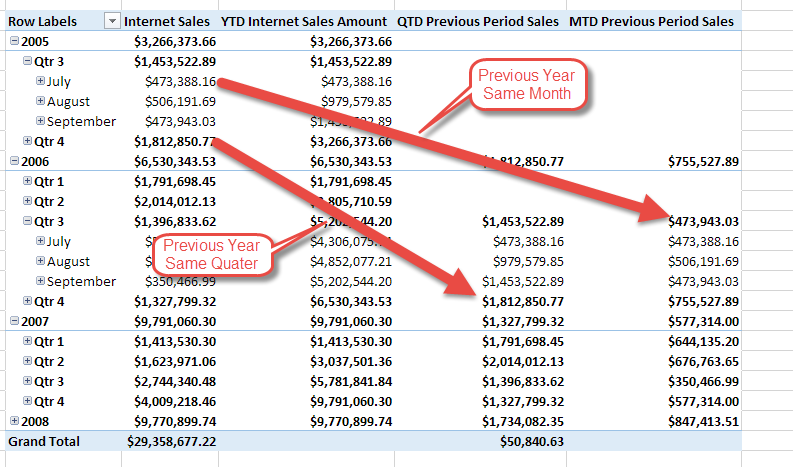
These measures compare the Quarter or Month to last year’s Quarter or Month. If the measure needs to be the previous Quarter in the sequence, the PREVIOUSQUARTER DAX function can be used. Likewise, the month DAX function is PREVIOUSMONTH.
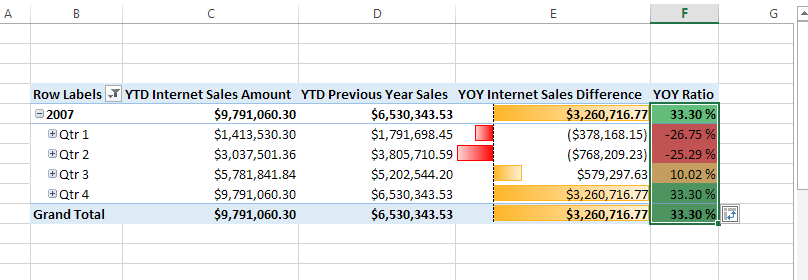
Using the SAMEPERIODLASTYEAR for Year to Date measure, the Year Over Year (YOY) difference can be calculated and then percent change from last year to present year. The formula for the difference is:
|
1 |
YOY Internet Sales Difference:= [YTD Internet Sales Amount] - [YTD Previous Year Sales] |
With this sub-measure, we can create a ratio of growth (or shrinking) sales year over year
|
1 |
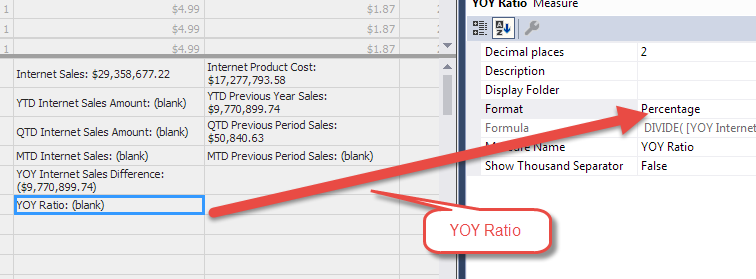
YOY Ratio:= DIVIDE( [YOY Internet Sales Difference] , [YTD Internet Sales Amount]) |
The YOY Ratio uses the DIVIDE DAX function. This function helps to not return error when the denominator is Null or 0. This was added recently in Analysis Services.
So, with a few configurations and some DAX functions, Time Intelligence becomes an easy and doable option with SSAS Tabular Models. Business users will be happy this is embedded in an OLAP database and does not need to be written into multiple reports. The consolidation of business rules is indispensable for analytical reporting.
See more
For SSAS cube documentation, consider ApexSQL Doc, a tool that offers the possibility of documenting both Multidimensional and Tabular databases in different output formats.
References

Starting as a developer in COBOL while at LSU, he has been a developer, tester, project manager, team lead as well as a software trainer writing documentation. Involvement in the SQL Server community includes speaking at SQLPASS.org Summits and SQLSaturday since 2011 and has been a speaker at IT/Dev Connections and Live! 360.
Currently, he is the Chair of the PASS Excel Business Intelligence Virtual Chapter and worked on the Nomination Committee for PASS Board of Directors for 2016.
View all posts by Thomas LeBlanc
- Performance tuning – Nested and Merge SQL Loop with Execution Plans - April 2, 2018
- Time Intelligence in Analysis Services (SSAS) Tabular Models - March 20, 2018
- How to create Intermediate Measures in Analysis Services (SSAS) - February 19, 2018