
Introduction
In SSAS, when I offer Power BI, Reporting Services, PowerPivot or SharePoint to connect to SSAS, the business analysts look scared. On the other hand, if I talk about MS Excel, everybody seems so happy and comfortable with it.
Excel is still the most popular spreadsheet in the world even when there are a lot of free spreadsheets like OpenOffice and LibreOffice to download, in the BI world, Excel is still the most popular.
Since then the usage is still growing. Office 365, a new version of Office in the cloud is growing each day and you can connect from your Android or iPhone device and store the information in OneDrive, the Microsoft storage.
In this article, we are going to learn how to connect to SSAS using Excel and create some reports on it.
Requirements
- SSAS multidimensional database installed
- SQL Server 2016 Installed
- SSDT
- The AdventureworksDW database
- SSMS 2017 installed
- Excel Installed
- An SSAS database already installed. You can use our sample created in our article How to build a cube from scratch using SQL Server Analysis Services (SSAS)
Getting started
In your machine, open Excel:
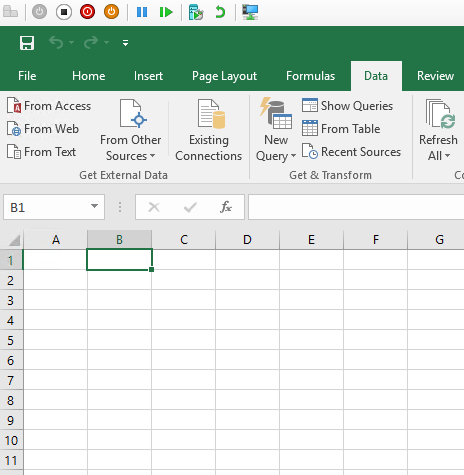
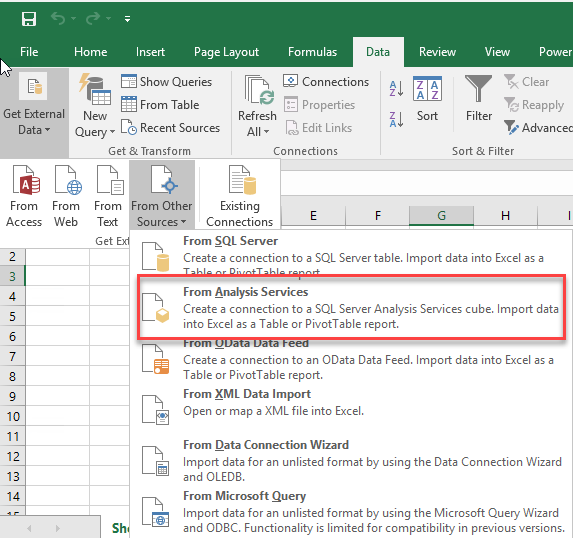
In the menu, go to data. Select the icon From other sources and select from Analysis Services. This option will create a PivotTable with the SSAS cube information:
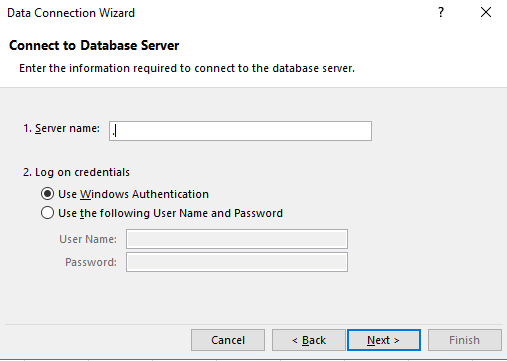
Write the name of the SSAS Server. Your current Windows credentials should have access to SSAS server. You can also use a specified username and password:
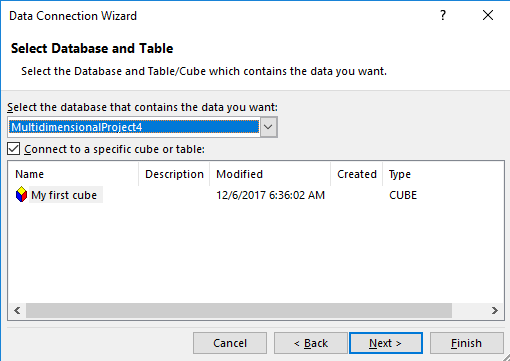
In SSAS, you have the database (MultidimensionalProject4) and inside the database, you have cubes (My first cube). Select your database and cube and press next:
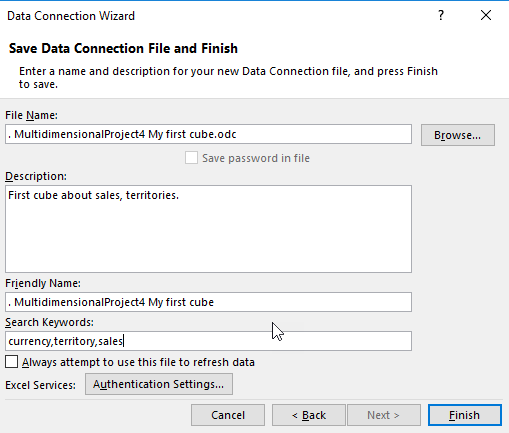
The information is stored in an ODC file (Office Data Connector) this file is an xml file used to connect to different data sources. In this case to SSAS. You can specify a description, keywords and the file name here. The description and keywords may be useful to identify the connection and to search it:
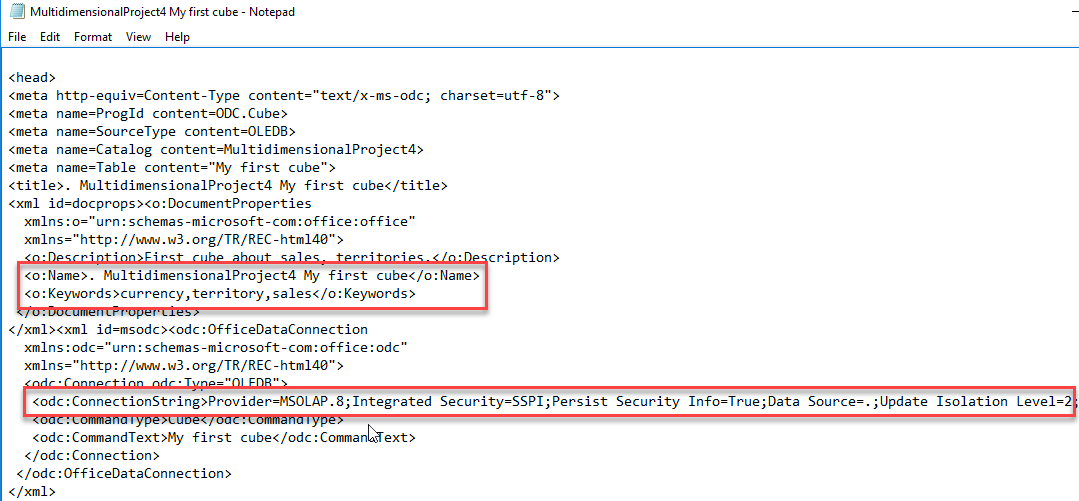
The ODC file contains the name of the database, keywords, connection information and type of connection (OLEDB):
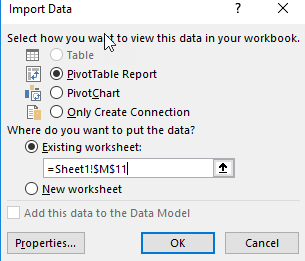
You can create a report, a chart or just create a connection. Select the option, PivotTable Report. You can also select the sheet where the report will be displayed or create a new one:
A PivotTable will be created in Excel:
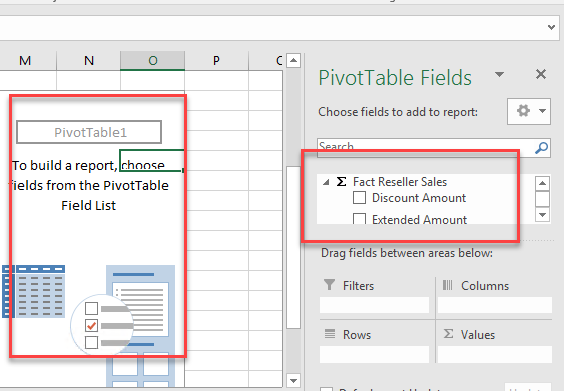
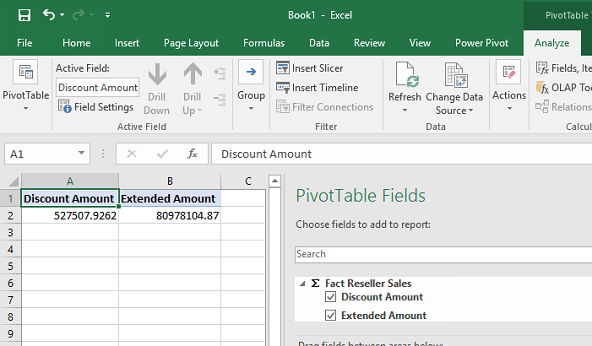
In your fact table (fact reseller sales in my example) check your measures to be displayed (Discount Amount and the extended amount in my example):
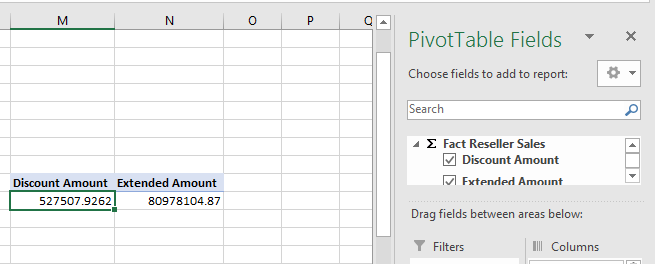
You will be able to visualize the total discount and extended amount. Double click the discount amount:
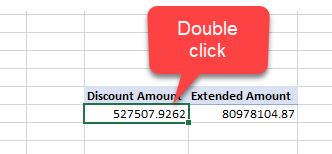
A new sheet will be created with detailed Discount amount information. It will display the first 1000 rows:
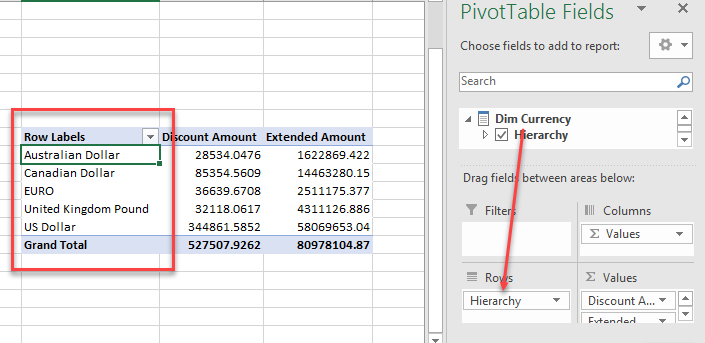
Drag and drop the Dim currency to the rows section. This will display discount and extended amounts grouped by currency:
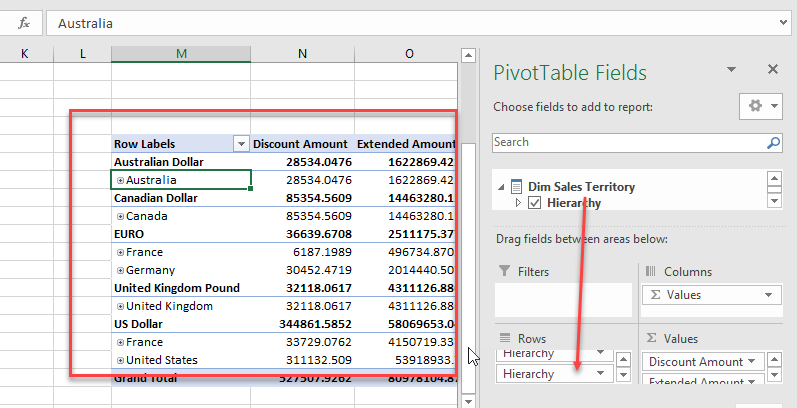
We will drag and drop the Dim Sales Territory to the Rows to group the Discount Amount and Extended Amount by territory and currency:
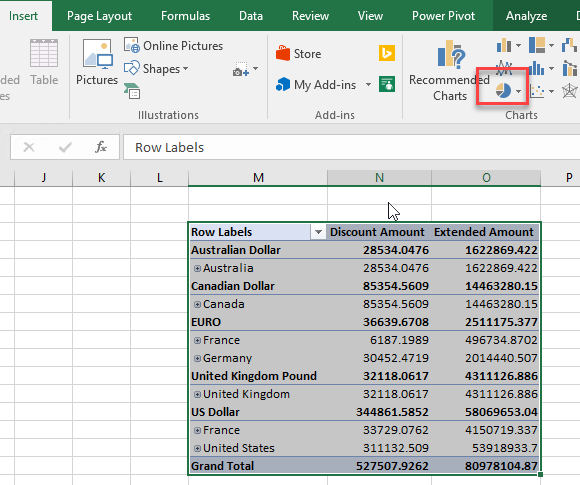
We will now create a graph based on the current information. Select the report information and go to Insert and select the pie icon:
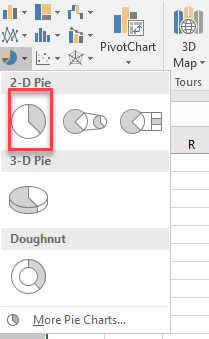
Select the graph that you want to use:
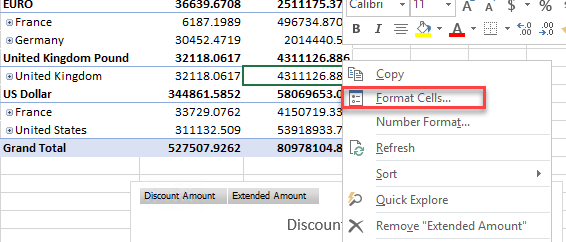
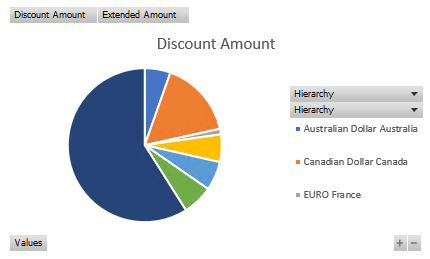
You will now have a graph about the discount amount by currency type:
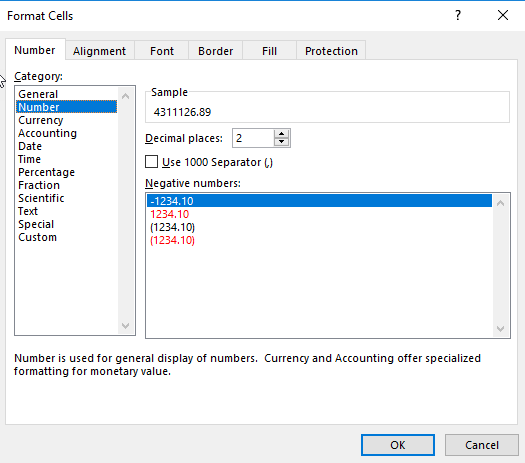
You can modify the format of your cells. If you right click the format cells, you can modify the format:

For example, we can change the numbers display in number format with 2 decimals:
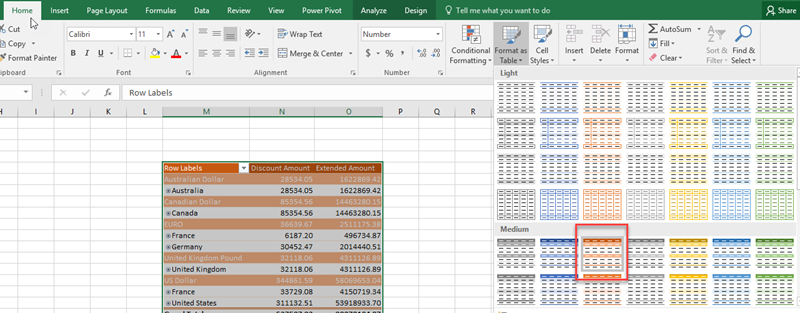
You can easily change the table format using Excel:
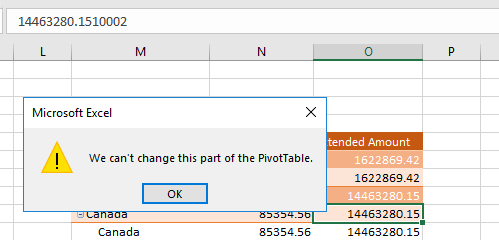
If you want to edit the numbers, you will receive a warning and you will not be able to change the data:
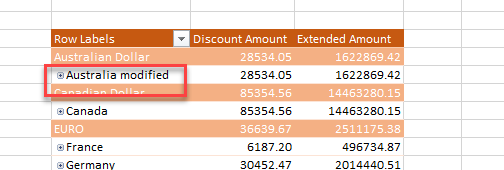
You can modify the labels like the country names:
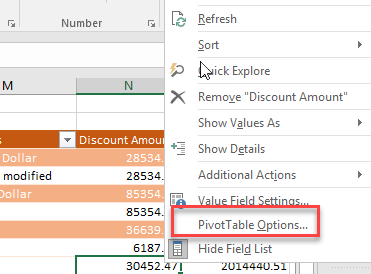
If you right click on the numbers, you will find the option to configure PivotTable options:
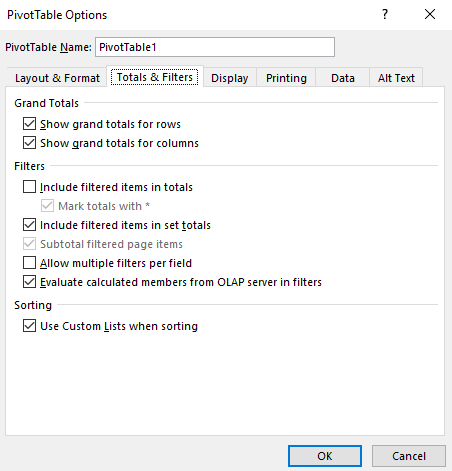
In show and filters tab, you can configure if you want to see the totals for row and columns, use a custom list and more.
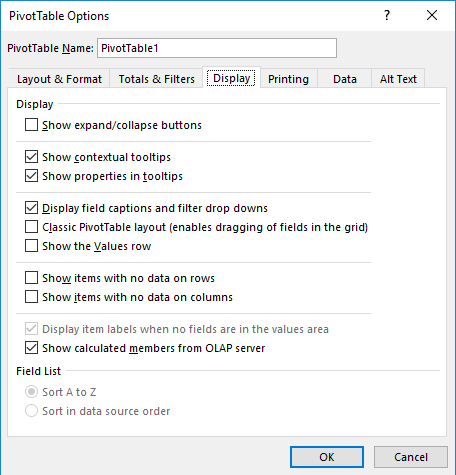
In display tab, you can configure if you want to see expand and collapse buttons, show calculated members and more:
If you have SSDT, there is an option to connect to Excel and create the ODC directly. This option is useful if you have SSDT and Excel on the same machine. If you only have Excel, the previous steps should be used.
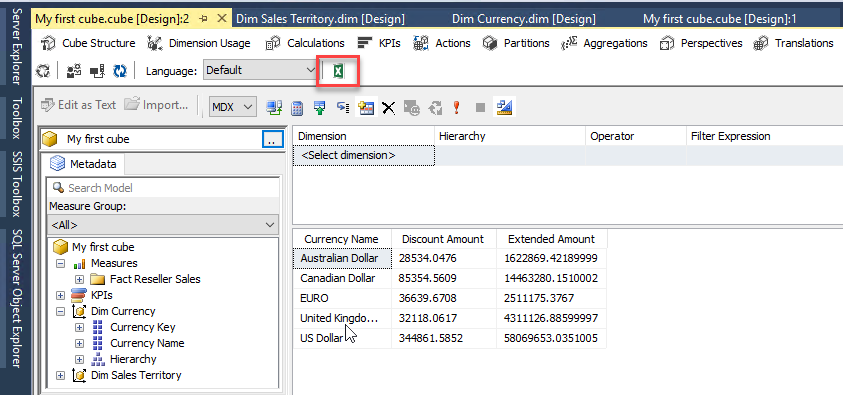
In SSDT, go to the Cube and go to Browser tab:
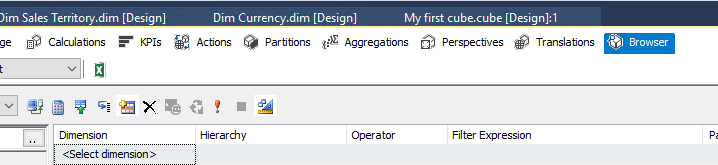
There is an Excel icon to Analyze in Excel the data. Click it:
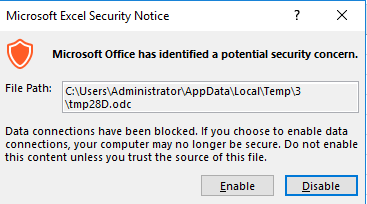
You may receive a warning in Excel about a potential security problem. It is the ODC file being created automatically. You can trust it. Press Enable:
The Excel will be connected automatically and you can work as we did before:
Conclusion
In this article, we learned how to create reports in Excel based on the cube information in SSAS. We first need to create a Data the connection and then we drag and drop the measures and dimensions.
Excel is pretty simple and intuitive to create reports. You cannot modify the data, but you can modify the label names at the customer side.
The connection is made using an ODC file which can be modified manually or using Excel itself. It is necessary to have a Windows credentials to SSAS in the account that is using Excel.
There are other alternatives to have reports in Excel like using Reporting Services or Power BI to create reports and then export to Excel. However, this option. in my opinion is the best if the user has experience in Excel and does not have experience in other BI technologies. The learning curve is really short.
We also learned that there is an option in SSDT to create the connection immediately. With that option, you do not need to write credential information to connect to SSAS from Excel.
References
For more information about connecting to SSAS using Excel refer to these links:
- Get data from Analysis Services
- Analyze in Excel
- Connect to SQL Server Analysis Services Database (Import)
- Querying SSAS cubes in Excel

He has worked for the government, oil companies, web sites, magazines and universities around the world. Daniel also regularly speaks at SQL Servers conferences and blogs. He writes SQL Server training materials for certification exams.
He also helps with translating SQLShack articles to Spanish
View all posts by Daniel Calbimonte
- PostgreSQL tutorial to create a user - November 12, 2023
- PostgreSQL Tutorial for beginners - April 6, 2023
- PSQL stored procedures overview and examples - February 14, 2023