
Introduction
I am a DBA consultant and several times, in the past, I have been asked for a good tool to generate fast reports to get information about the company like total sales, sales per year, month, week, etc
SSAS is a Business Intelligence (BI) technology that Microsoft bought from Panorama Software in 1996. After the acquisition, the technology was upgraded and evolved and now it is part of the tools that come with SQL Server. This tool is an extremely powerful tool to create analytical reports fast. It works with cubes that are designed to generate reports with optimal performance using aggregated information stored in the cube.
SSAS generally does consume a lot of space because it contains a lot of information ready to be used.
In this article, we will learn how to create your first cube from scratch. If you do not know anything about SSAS, this will be a great opportunity to learn.
Requirements
- SSAS multidimensional database installed
- SSDT
- SQL Server 2016 Installed
- The AdventureworksDW database
- SSMS 2017 installed
Getting started
A cube in SSAS requires a data warehouse. The data warehouse is a special database designed to store enterprise information from different sources like Excel, ERPs, CRMs, flat files, legacy data and more.
If you want to have an SSAS cube, creating the data warehouse is a process that takes a bit of time and resources. You can use SSIS to extract the information from sources to the data warehouse or use other ETL (Extract Transformation and load) tools like Talend Open Studio, SpagoBI Business Intelligence, Jaspersoft ETL and several other external tools.
In this article, we will use the AdventureworksDW sample ready to be used. However, in the real-life, you will need to create some ETLs to automatically extract your business information to the Data Warehouse.
We will create a cube based on the fact table FactResellerSales:
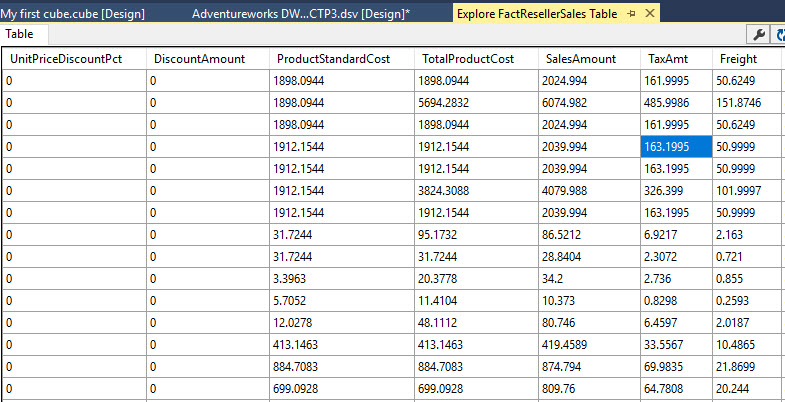
FactResellerSales shows information about resellers’ sales like discount amounts, tax amounts, freight, sales amount and other related information.
We will create reports about the fact information combined with 2 dimensions:
- currency
- sales territory
The Currency dimension, will help us to detect amounts in different currencies around the world and Sales territory will help to detect sales, discounts, etc. per region.
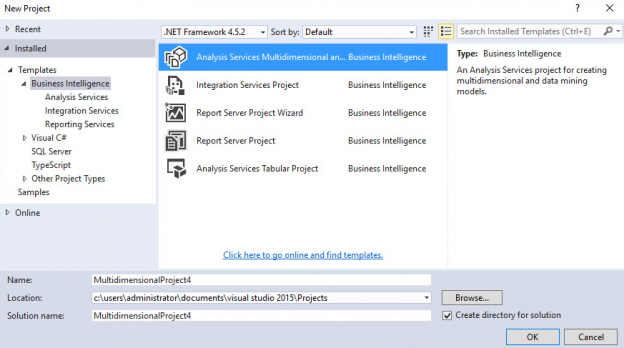
In order to start get started in SQL Server Data Tools aka SSDT, open a new project and select Analysis Services Multidimensional and Data Mining models:
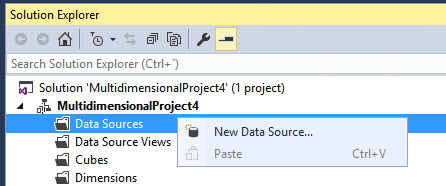
In the Solution Explorer, right-click Data Sources and select New Data Source:
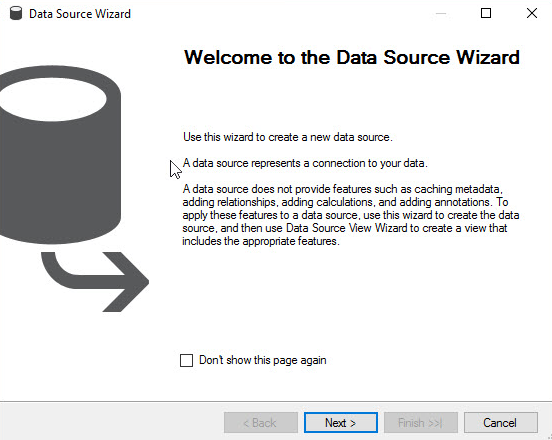
You will receive a Welcome wizard, press next:
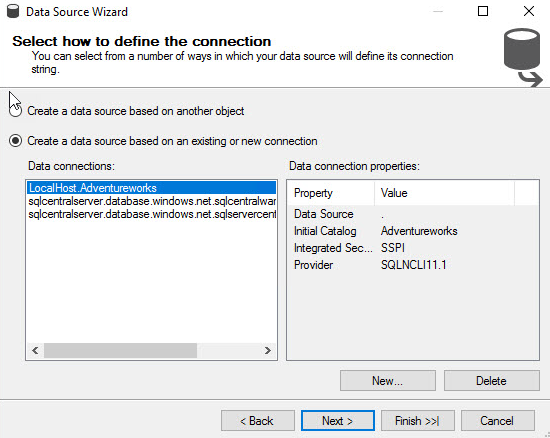
Select the option to create a new Data Source based on existing or new connection and press the new button:
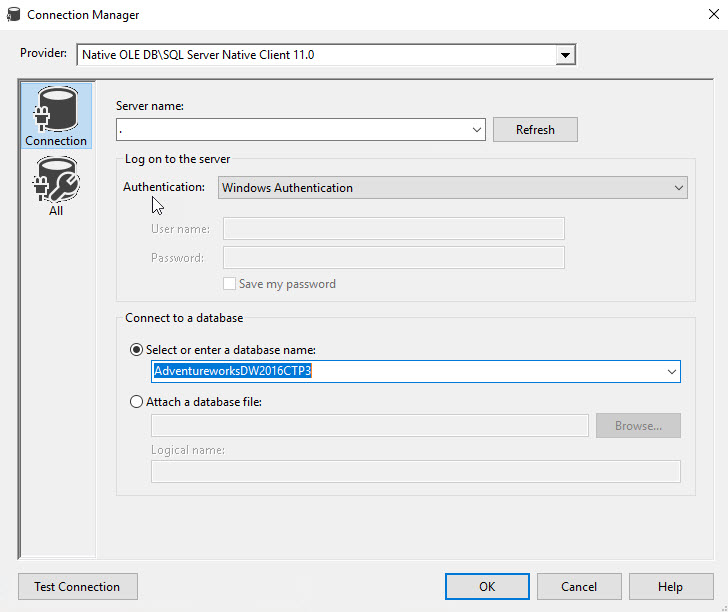
In the Provider, select a Native OLEDB\SQL Server Native Client 11.0. For Server name, select the SQL Server with the AdventureworksDW database:
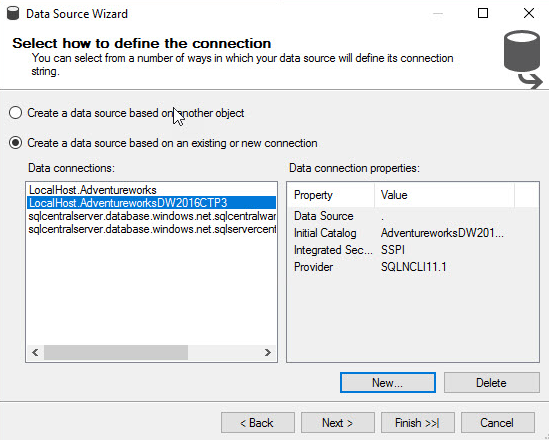
Select the data connection, just created, and press next:
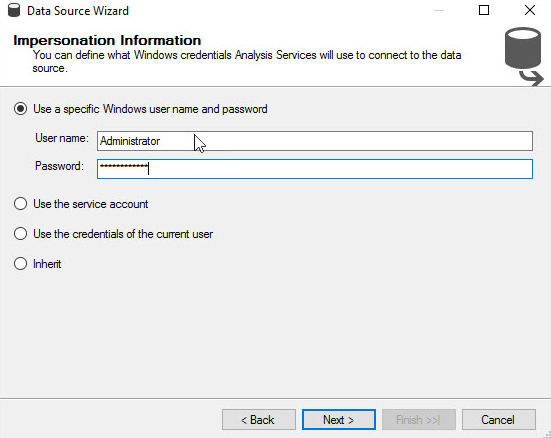
In Impersonation information specify a user with access to the AdventureworksDW database:
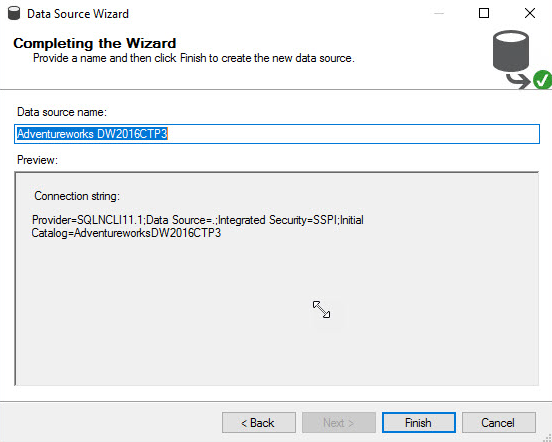
In the Completing the wizard, press finish:
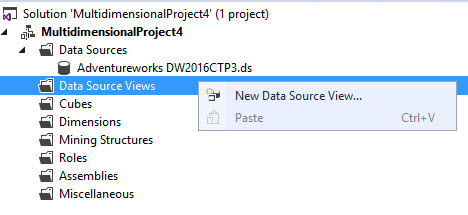
We created the credentials to connect to the AdventureworksDW database. We will create now the views. In this process, we will select the tables to be included in the cube.
In solution explorer, select New Data Source View:
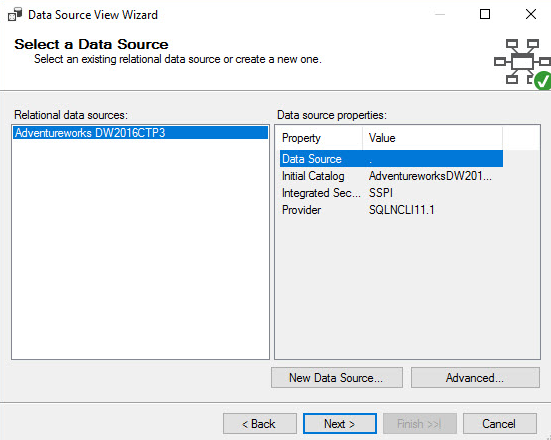
Select the data source just created:
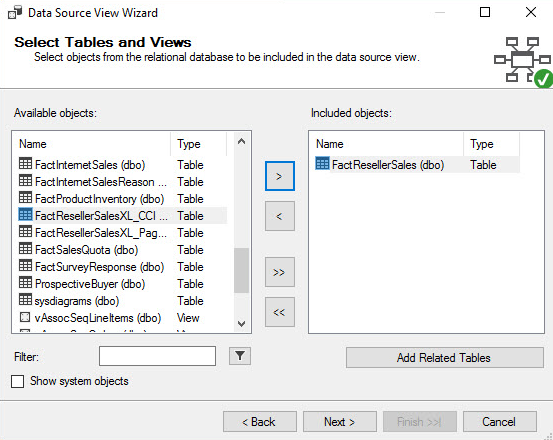
Select the table FactResellerSales:
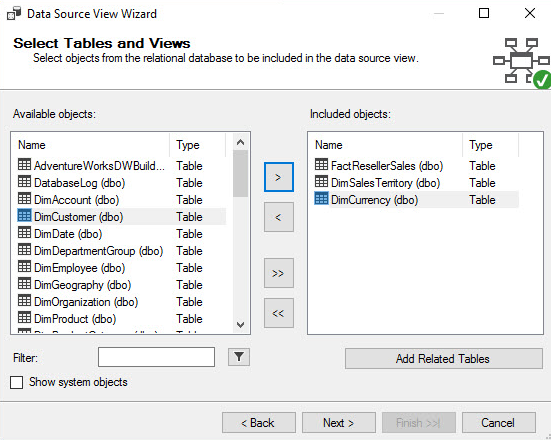
Include the dimensions DimSalesTerritory and DimCurrency. These dimensions include information about sales regions and currencies:
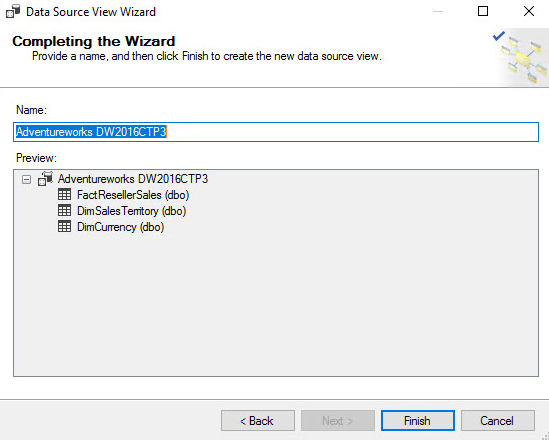
Once the wizard is completed, press finish:
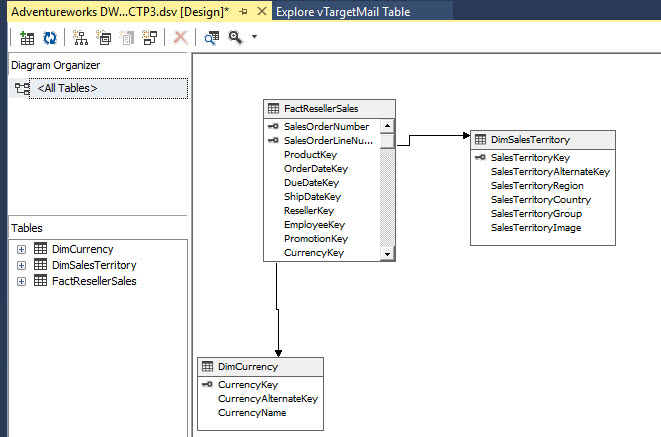
As you can see, the fact table and the dimensions have a relationship. If the common columns are equal, the relationships are detected automatically:
To create a cube, we will add dimensions to the cube.
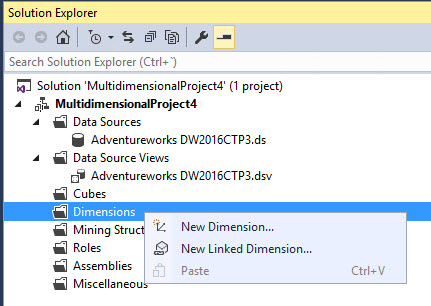
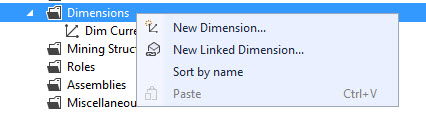
In the Solution Explorer, right click and select New Dimension:
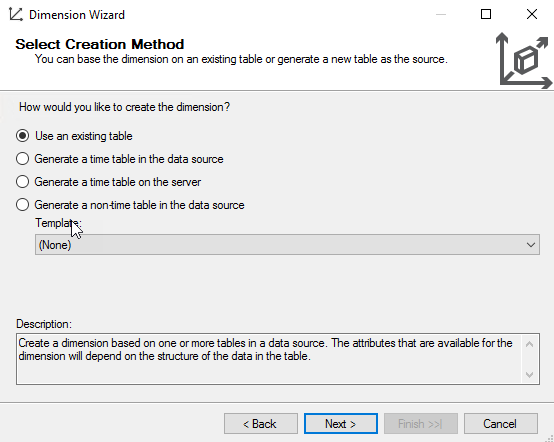
You can create a dimension based on templates, time tables or based on existing tables. Select the option Use an existing table:

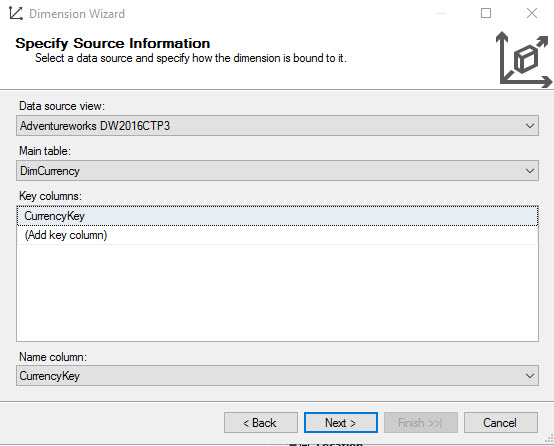
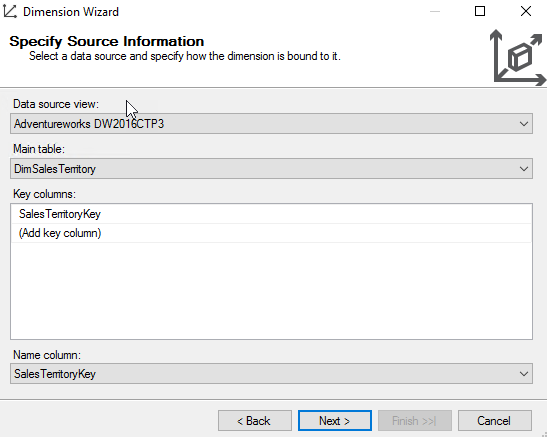
Select DimCurrency as the main table. By default, the key column is currency key:
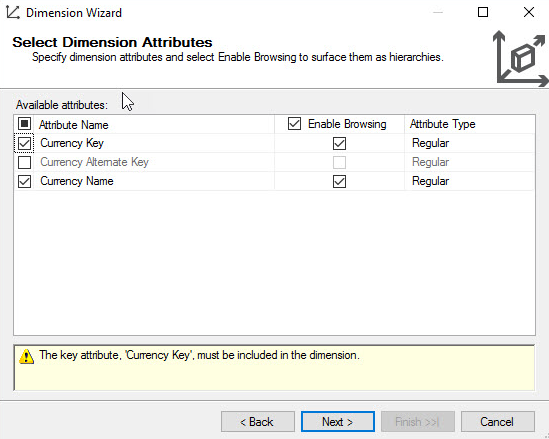
In available attributes, select currency name:
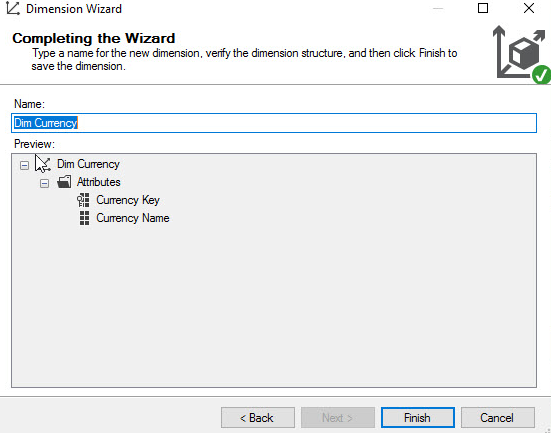
In the Completing the Wizard step, press finish:
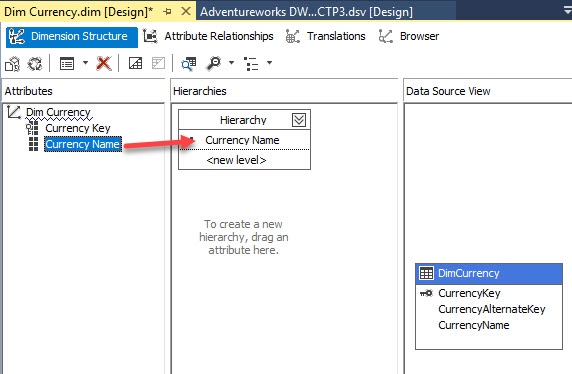
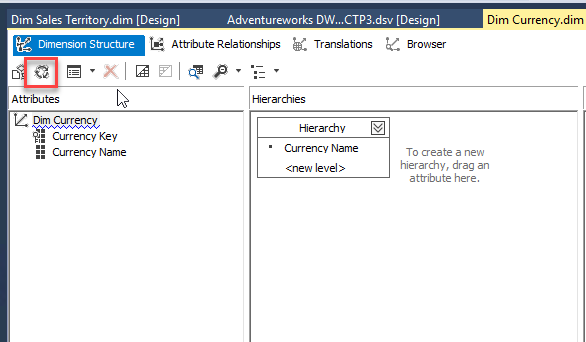
Now, you will have a dimension created like this one.
Drag and drop the Currency Name from the attributes pane to Hierarchy:
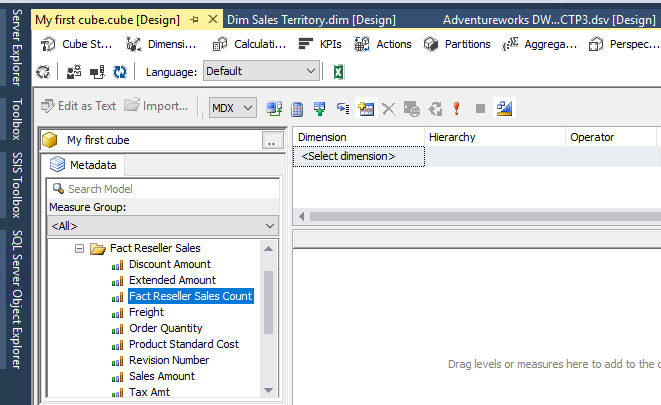
Once that you have the first dimension created, Currency name, we will create the sales territory dimension. In solution explorer, right click Dimensions and select New dimension:
Select the option use an existing table:
Select the table dimsalesterritory:
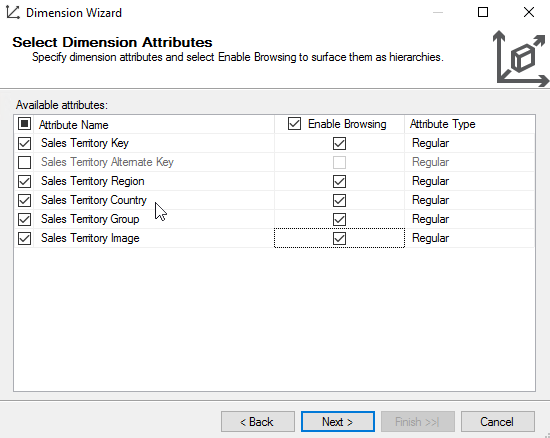
Select the attributes that you want to be browsable in the reports:
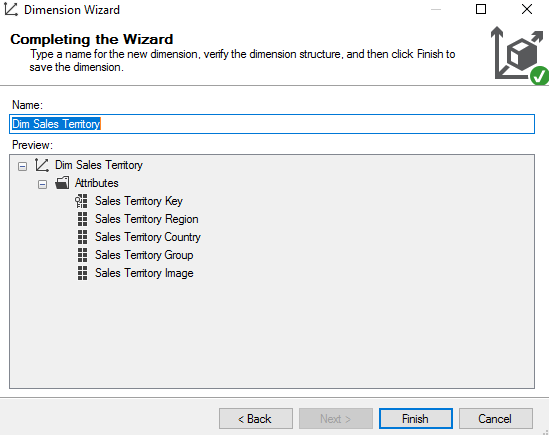
Once that the wizard is completed, press finish:
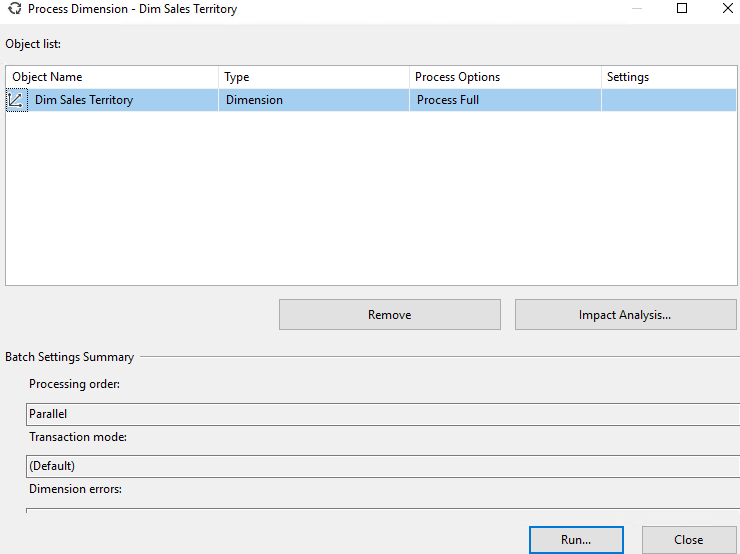
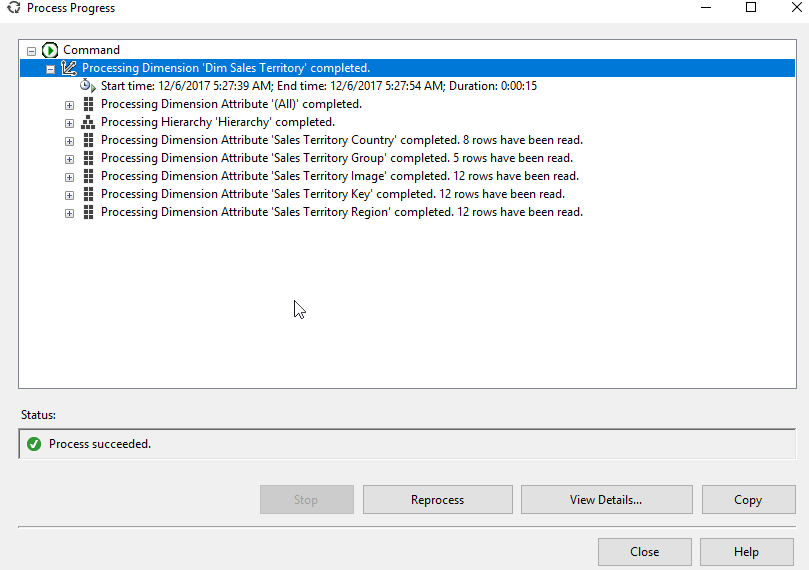
In the new dimension created, click the process icon to process the dimension. The process will generate the structure and load data to the dimension from the SQL Server table:
Press run to process the dimension:
In the Process Progress, close the process once that the process is succeed:
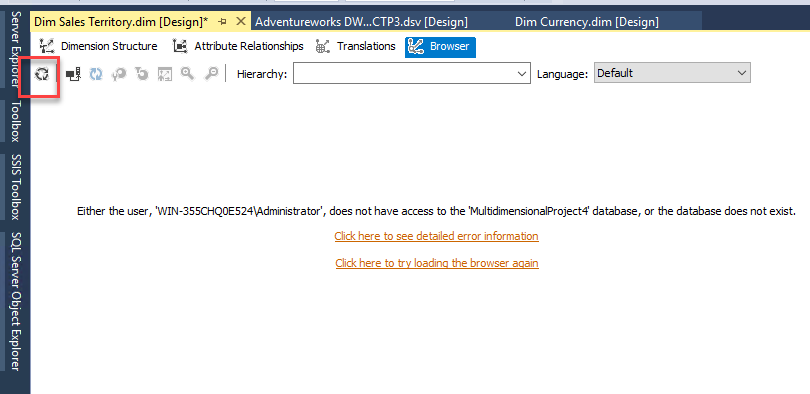
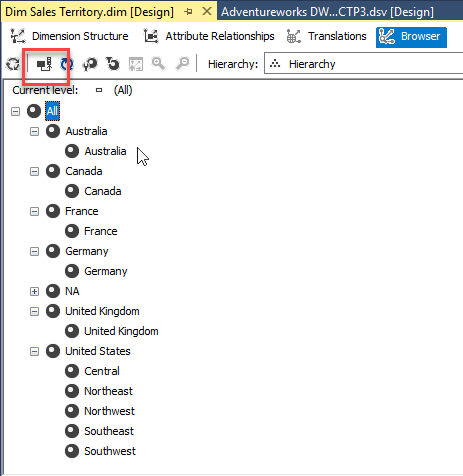
You can refresh the dimension to view the dimension just processed:
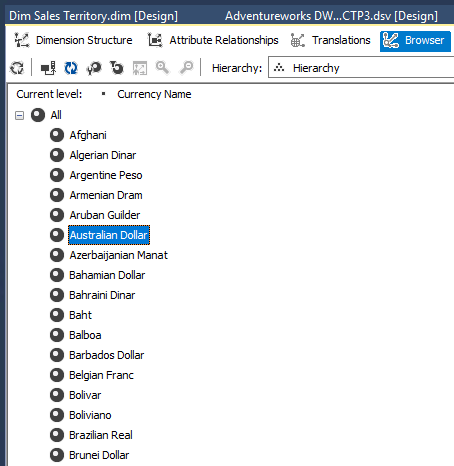
Process the Dim currency dimension also:
Once processed, you can verify in the Browser tab:
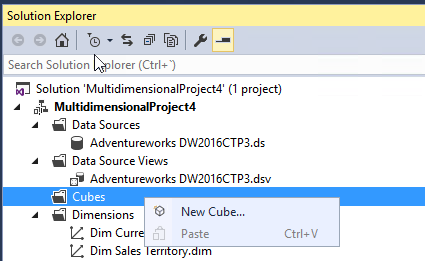
We will now create the cube. In the Solution Explorer, right click Cubes and select New Cube:
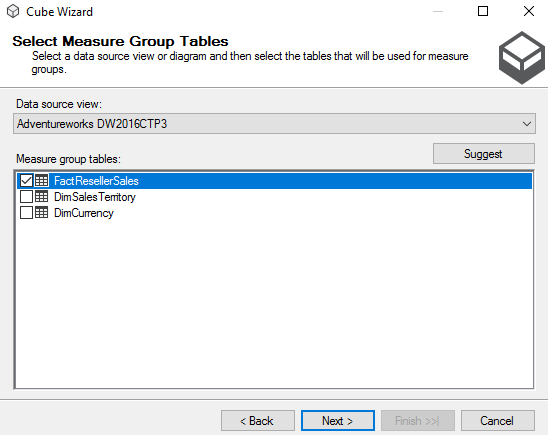
In Select Measure Groups Tables select FactResellerSales table. Measure group tables are used to include the table with data to measure. A measure can be the number of sales, amount sold, freight, etc.:
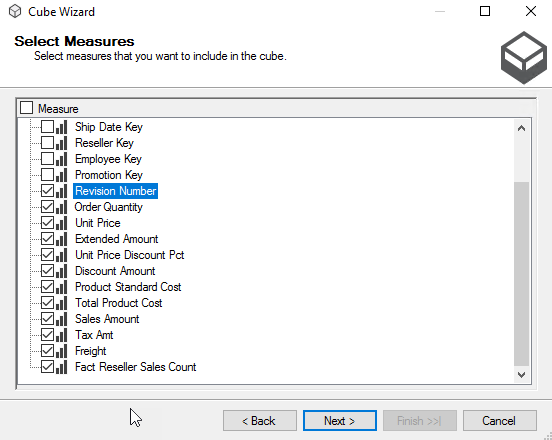
Select the data to measure. We will uncheck the keys and check the other attributes to measure:
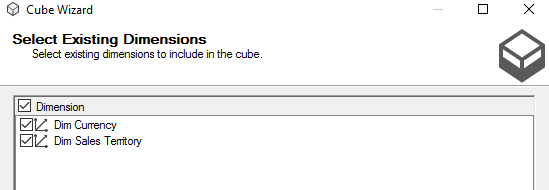
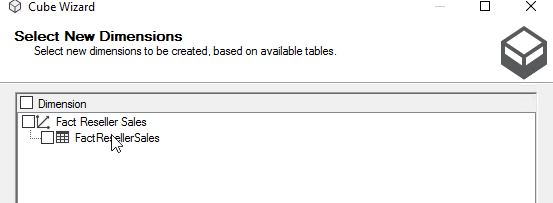
Select the dimensions that you want to add to the cube:
You can also add the fact table as a dimension (degenerate dimension). In this example, we will not add it:
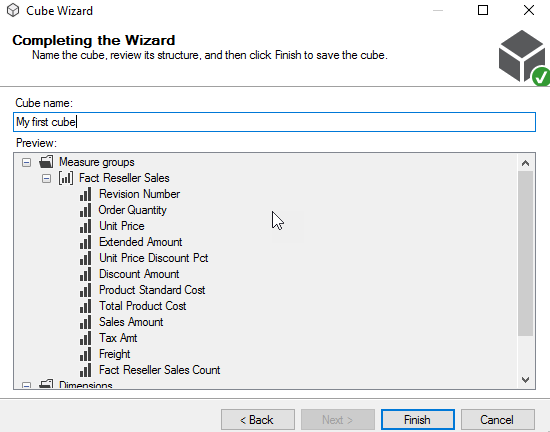
Once that the cube is created, press finish:
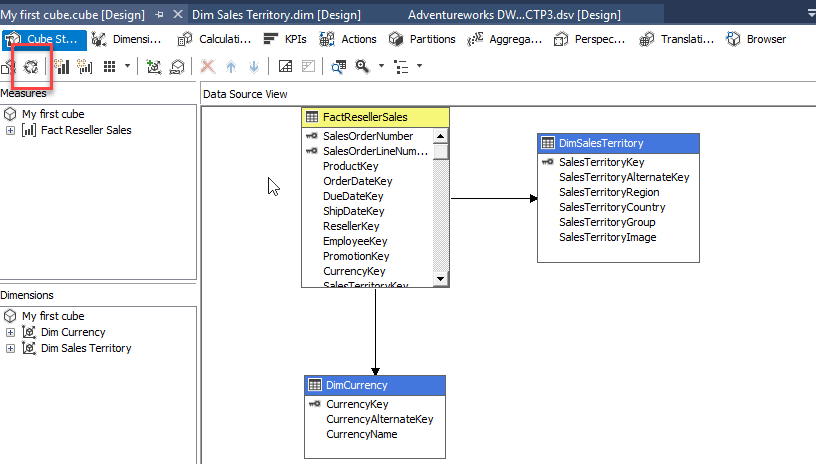
You will have the cube created with the fact table (in yellow) and the dimensions (in blue). Press the process icon to process the cube:
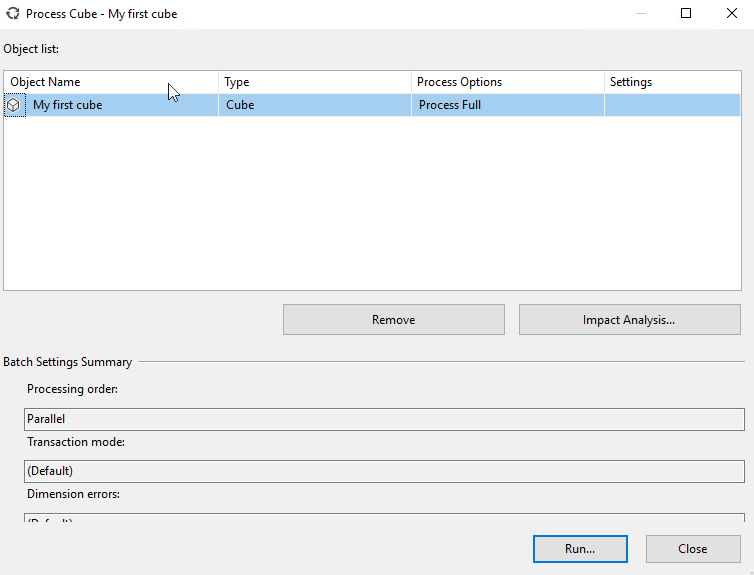
In Process Cube, press run to process the cube:
Once processed, go to the browser:
Press the refresh icon:
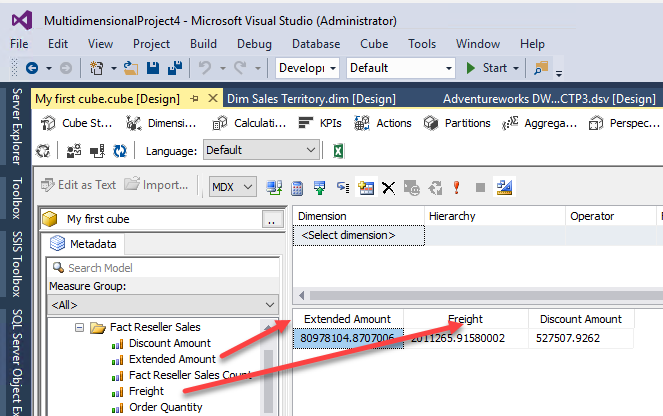
Drag and drop some measures from the Measure Group to the design pane:
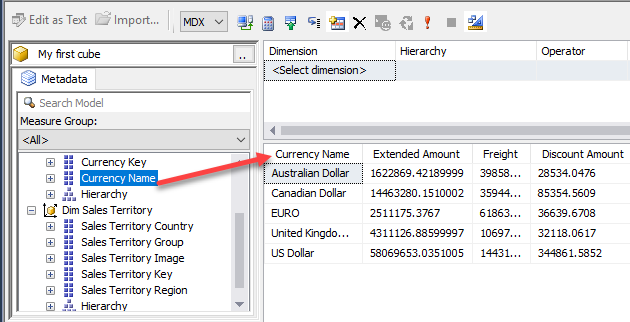
Now drag and drop the currency name to the graph pane, you will be able to see the measures grouped by currency:
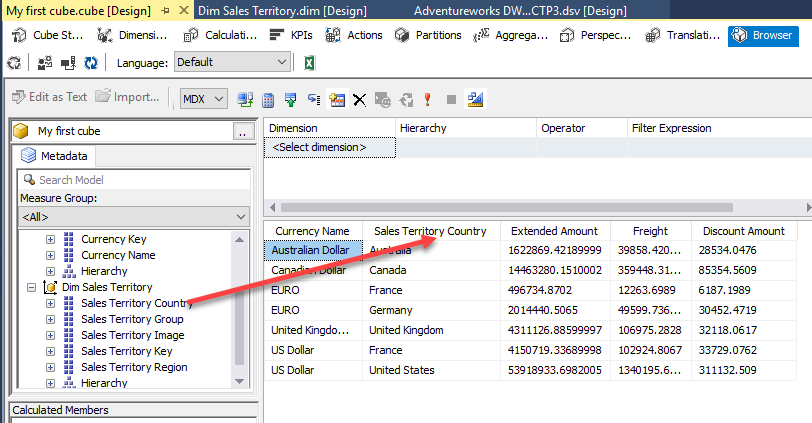
Drag and drop the Sales Territory Country. You will now be able to see the measures grouped by currency and territory:
Conclusion
In this article, we learned how to create a cube in SSAS. We first need to create a data source to connect to our database. In this example, we connected to a data warehouse already created. For our example, we used AdventureworksDW, which is a sample database created for learning purposes.
The next step was to add the fact table and 2 dimensions as data source views. SSAS detected the primary keys and relationships by default.
After that, we added 2 dimensions based on 2 data source views. The currency and sales territory dimensions.
Finally, we created a cube based on the table factresellersales. We selected some columns as measures and we added the dimensions created. With the process buttons, we loaded data to the cubes. The cube as you can see is a simple way to generate multiple reports. You can create multiple reports without SQL knowledge or other reporting tools. With SSAS you can easily generate thousands of reports to accomplish your company needs.
References
For more information about SSAS refer to these links:
- What is Analysis Services?
- Analysis Services Tutorials (SSAS)
- Analysis Services (SSAS) Cubes – Dimension Attributes and Hierarchies
- SSAS Multidimensional or SSAS Tabular

He has worked for the government, oil companies, web sites, magazines and universities around the world. Daniel also regularly speaks at SQL Servers conferences and blogs. He writes SQL Server training materials for certification exams.
He also helps with translating SQLShack articles to Spanish
View all posts by Daniel Calbimonte
- PostgreSQL tutorial to create a user - November 12, 2023
- PostgreSQL Tutorial for beginners - April 6, 2023
- PSQL stored procedures overview and examples - February 14, 2023