

There has been an ever-growing discomfort on documenting things especially when it’s very dynamic in nature and I was at one time undergoing the same. We have been developing SQL Server Analysis Tabular Model’s, which were quite a many in numbers and documenting 50 or 60 models manually is a big effort. In addition, development always demands change or enhancements that incurs changes on the documentation that is a continuous process. Adding the changes on the documentation is a time consuming process and sometimes loses track or remains inconsistent with the code built which is a critical issue when the system is in production for years.
I decided to automate the documentation of the SSAS model, to ease the manual effort here as well as save time. In addition, help the end users to see and review the latest change on the models quickly without even bothering the development team.
Solution
I have used C#.NET to build up the documentation tool referring MSDN help for the libraries used to fetch the detailed properties for the Model. Microsoft has provided Tabular Object Model (TOM) library, which extracts all the metadata and properties for the model from SQL Server 2016 onwards, which is an extension of the AMO library used to extract Multidimensional cube metadata. This library is under Microsoft.AnalysisServices.Tabular.dll assembly.
Overview
An SSAS Tabular model is a database that run in-memory or in DirectQuery mode, accessing data directly from backend relational data sources. The model database is nothing but a Json object based definition that can be accessed via TOM object library.
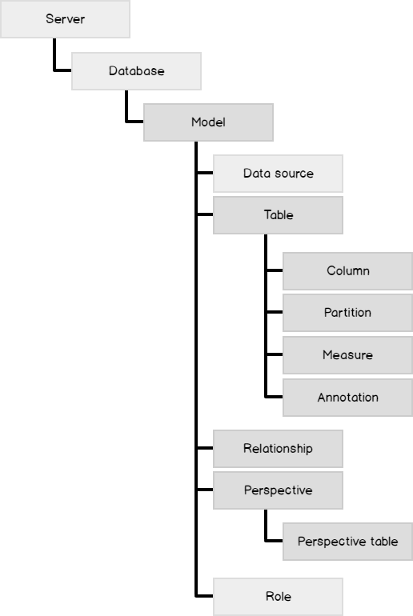
Logically, in a Tabular model, everything is driven from a Model which acts like a root that in turn is descendant of a Database (same as in Multidimensional). Here are the different objects exposed via TOM library referenced from MSDN.
As a part of design documentation, we need mainly four objects, which can be derived from the green highlighted nodes.
- Tables and their relationships with other tables
- Partitions and their corresponding tables
- Columns and their corresponding tables
- Perspectives and their corresponding tables
Input
Now what should be the input to the tool? In order to make this tool friendly with any end user, the input should be simple like the name of Tabular model, which needs documentation with the server name from where the model is present. It should have capability to generate document for multiple models at one time too.
- Server Name
- Model Names in a csv file
Internal Process Overview
Once we receive the input, the code steps will be as follows
Get the Server connectivity for the models to read the metadata.
-
Connect to the server provided. Ensure sufficient access to the user for server access is available.
- Create a new server object
-
Use the Connect method to connect to server where the input parameter is “Provider = MSOLAP; Data Source = “<servername>”
12Server svr = new Server();svr.Connect("Provider = MSOLAP; Data Source = "<servername>”);
-
Iterate on the models one by one and extract the four main objects mentioned above
-
Read the input csv file where the model names are provided which needs to be documented
1string[] allmodels = File.ReadAllLines(<Full input file path>.csv);
-
Iterate over the model names and find the model present on the server
1234Database mdl;string model = allmodels[<incremental array>];string[] values = model.Split(',');mdl = svr.Databases.FindByName(values[0]);
-
Read the input csv file where the model names are provided which needs to be documented
Tables and their relationships with other tables
To get the first main output report for Tables, follow the steps below
-
Once the model name is available, iterate on the tables present on the model.
- Fetch all the tables in the model using in mdl.Model.Tables.ToArray() property and iterate over them one by one using a Table object.
- Get the different properties for the table like Logical Table Name which is a Friendly table name or Displayed table name provided to the table in the model using <Table object>.Name property.
- Get the Table Description property which can be a data dictionary definition given for a table using <Table object>.Description property.
- Get the Physical or the Actual table name using the annotations on the model using <Table object>. Annotations[“_TM_ExtProp_DbTableName”].Value property.
- Get the source query of the physical table used in the model using tbl.Annotations[“_TM_ExtProp_QueryDefinition”].Value property. If the table is hidden or not, get that Boolean flag using <Table object>.IsHidden property.
-
If the table is a Calculated Table, use the partition source property
12345string ParSource = (tbl.Partitions[0].Source.Partition).Source.ToString();if (ParSource != "Microsoft.AnalysisServices.Tabular.QueryPartitionSource"){string CalculatedTableExpression = ((Microsoft.AnalysisServices.Tabular.CalculatedPartitionSource)(tbl.Partitions[0].Source.Partition).Source).Expression.ToString();}
The complete code for step 3 is as below
|
1 2 3 4 5 6 |
foreach (Table tbl in mdl.Model.Tables.ToArray()) { String LogicalTablename = tbl.Name.ToString(); String TableDescription = tbl.Description.ToString(); string PhysicalTablename = tbl.Annotations["_TM_ExtProp_DbTableName"].Value.ToString(); string QueryDefinition = tbl.Annotations["_TM_ExtProp_QueryDefinition"].Value.ToString(); if (tbl.IsHidden) {string IsTableHidden = "Yes"; } |
- Compare the “Relationship To table name” with the Logical name extracted in step 1.c.
- If it is same, get the Relationship name, From Table name using <relationship object>.Name and <relationship object>.FromTable.Name property.
- Get the Physical table name of the From Table name using <relationship object>.FromTable.Annotations[“_TM_ExtProp_DbTableName”].Value.property.
- Get the Logical key name for From Table name used in joining the table using <relationship object>.FromColumn.Name property.
- Get the Physical key name for From Table name used in joining the table based on the Column type – Data or Calculated using <relationship object>.((Microsoft.AnalysisServices.Tabular.DataColumn)rel.FromColumn).SourceColumn
- Or
- <relationship object>.((Microsoft.AnalysisServices.Tabular.CalculatedTableCoumn)rel.FromColumn).SourceColumn
- Repeat steps f to I for “Relationship To Table Name” properties.
- Get the cardinality of the relationships using <relationship object>.FromCardinality and <relationship object>.ToCardinality properties.
- One main important property of a relationship is the joining type based on <relationship object>.RelyOnReferentialIntegrity property. If the property value is true then it is an “Inner Join” else “Outer”
- Get the Boolean value of whether the relationship is active or not using <relationship object>.IsActive property.
Complete code for getting the relationships is as follows
|
1 2 3 4 5 6 7 8 9 10 11 12 13 14 15 16 17 18 19 20 21 22 23 24 |
foreach (SingleColumnRelationship rel in mdl.Model.Relationships) { if (rel.ToTable.Name == LogicalTablename) { string JoinRelationshipName = rel.Name; string JoinFromTable = rel.FromTable.Name.ToString(); if (rel.FromTable.Annotations.Count > 0) { string JoinFromPhysicalTable = rel.FromTable.Annotations["_TM_ExtProp_DbTableName"].Value.ToString(); } String JoinFromTableKey = rel.FromColumn.Name; if (rel.FromColumn.Type.ToString() == "Data") JoinFromPhysicalTableKey = ((Microsoft.AnalysisServices.Tabular.DataColumn)rel.FromColumn).SourceColumn.ToString(); else if (rel.FromColumn.Type.ToString() == "CalculatedTableColumn") JoinFromPhysicalTableKey = ((Microsoft.AnalysisServices.Tabular.CalculatedTableColumn)rel.FromColumn).SourceColumn.ToString(); JoinToTable = rel.ToTable.Name.ToString(); if (rel.ToTable.Annotations.Count>0) { JoinToPhysicalTable = rel.ToTable.Annotations["_TM_ExtProp_DbTableName"].Value.ToString(); } JoinToTableKey = rel.ToColumn.Name; if(rel.ToColumn.Type.ToString() == "Data") JoinToPhysicalTableKey = ((Microsoft.AnalysisServices.Tabular.DataColumn)rel.ToColumn).SourceColumn.ToString(); else if (rel.ToColumn.Type.ToString() == "CalculatedTableColumn") JoinToPhysicalTableKey = ((Microsoft.AnalysisServices.Tabular.CalculatedTableColumn)rel.ToColumn).SourceColumn.ToString(); JoinFromCardinality = rel.FromCardinality.ToString(); JoinToCardinality = rel.ToCardinality.ToString(); if (rel.RelyOnReferentialIntegrity == true) JoinType = "Inner Join"; IsRelationshipActive = rel.IsActive.ToString(); } |
Partitions and their corresponding tables
Once the table metadata is extracted, we need to go one more level down is the Partitions. Let’s understand the properties to get the same.
- For each table in the model, there exist a partition which can be at least one or more than one.
- In the same iterative loop for table, after a single table is fetched get all the partitions for the table using <Table object>.Partitions property
- Get the properties of a partition like partition name using <Partition object>.Name property
-
Get the Partition source which can be of three types using (<Partition object>.Source.Partition).Source property
- Query – Data in this partition is retrieved by executing a query against a DataSource. The DataSource must be a data source defined in the model.bim file.
- Calculated – Data in this partition is populated by executing a calculated expression.
- None – Data in this partition is populated by pushing a rowset of data to the server as part of the Refresh operation.
- Get the Query for partition if the partition is a query source using ((Microsoft.AnalysisServices.Tabular.QueryPartitionSource)(<Partition object>.Source.Partition).Source).Query
- Columns will be of two types – Columns means attributes of a table and Measures that means the summarized or calculated value of a column specifically in a fact table.
-
Once we have the table in a model, in the same iterative loop we can fetch all the columns using <Table Object>.Columns property.
-
Get all the column properties based on the column types.
- DataColumn – For regular columns in regular tables
- CalculatedColumn – For columns backed by DAX expression
- CalculatedTableColumn – For regular columns in calculated tables
- RowNumberColumn – Special type of column internally created by SSAS for every table
- Based on the column type, fetch the physical column name using ((Microsoft.AnalysisServices.Tabular.DataColumn)<Column Object>).SourceColumn propery. Change the casting to Calculated and CalculatedTableColumn based on the column types.
- Get the logical column name which is a friendly column name given to the column using <Column object>.Name property.
- Get the display folder, which is a logical grouping of different attributes shown in form of folder when the model is browsed using <Column object>.DisplayFolder property.
- Get the Format string, source type, formula properties using “FormatString”,”SourceProviderType”, and “SummarizeBy” properties.
- Get the basic properties like Description, Hidden and Datatype using “Description”,”IsHidden”, and “ColumnDataType” properties.
-
Get all the column properties based on the column types.
- After the columns, get the measure metadata from the table object by iterating using <Table object>.Measures property.
- Extract all properties like Measure Name, Data Type, Display Folder, Expression which is the calculation used, Format string, description, Hidden using code below
- Iterate over all perspectives on the model using <Model object>.Model.Perspectives property
- Get the Table name in the perspective using <Perspective object>.PerspectiveTables property
- Introduction to a Tabular Object model
- Tabular Library reference for objects
- Write Data to Excel file
- Automate documentation of SQL Server Analysis Server Tabular Model - March 13, 2018
Complete code for step 2 is as below
|
1 2 3 4 5 |
foreach (Partition p in tbl.Partitions) { PartitionName = p.Name.ToString(); string ParSource = (p.Source.Partition).Source.ToString(); if (ParSource == "Microsoft.AnalysisServices.Tabular.QueryPartitionSource") { PartitionQueryDefinition = ((Microsoft.AnalysisServices.Tabular.QueryPartitionSource)(p.Source.Partition).Source).Query.ToString(); } |
Columns and their corresponding tables
The next level is to get the column definitions present in the table.
Complete code for step 2 is as follows
|
1 2 3 4 5 6 7 8 9 10 11 12 13 14 15 16 17 18 |
foreach (Column clm in tbl.Columns) { string clmtype = clm.Type.ToString(); if (clmtype == "Data" || clmtype == "Calculated" || clmtype == "CalculatedTableColumn") { if (clm.Type == Microsoft.AnalysisServices.Tabular.ColumnType.Data) { PhysicalColname = ((Microsoft.AnalysisServices.Tabular.DataColumn)clm).SourceColumn.ToString(); CalculationFormula = clm.SummarizeBy.ToString(); } else if (clm.Type == Microsoft.AnalysisServices.Tabular.ColumnType.Calculated) { PhysicalColname = ""; CalculationFormula = (Microsoft.AnalysisServices.Tabular.CalculatedColumn)clm).Expression.ToStr } else if (clm.Type == Microsoft.AnalysisServices.Tabular.ColumnType.CalculatedTableColumn) { PhysicalColname = ((Microsoft.AnalysisServices.Tabular.CalculatedTableColumn)clm).SourceColumn.ToString(); } LogicalColname = clm.Name; DisplayFolder = clm.DisplayFolder; FormatString = clm.FormatString; SourceProviderType = clm.SourceProviderType; if (clm.IsHidden) { isAttributeHidden = "Yes"; } ColumnDescription = clm.Description; ColumnDataType = clm.DataType.ToString(); } |
|
1 2 3 4 5 6 7 8 |
foreach (Measure meas in tbl.Measures) { MeasureName = meas.Name.ToString(); MeasureDataType = meas.DataType.ToString(); MeasureDisplayFolder = meas.DisplayFolder.ToString(); MeasureExpression = meas.Expression.ToString(); MeasureFormatString = meas.FormatString.ToString(); MeasureDescription = meas.Description.ToString(); if (meas.IsHidden) MeasureIsHidden = "Yes"; } |
This completes the Table level iterative loop and continue the same loop until all the tables metadata is extracted and can be saved in a Data Table. The Data table is then exported to excel.
Perspectives and their corresponding tables
After tables, we can extract the Perspectives on the model which will give an idea which table belongs to which perspective. Here we are extracting only tables in the perspective, but can be extended to get the columns exposed in the perspective also.
Here is the complete code to get the perspectives
|
1 2 3 4 5 6 |
foreach (Perspective pers in mdl.Model.Perspectives) { string PerspectiveName = pers.Name; foreach (PerspectiveTable perstable in pers.PerspectiveTables) { string LogicalTablename = perstable.Name; } } |
Output
I have extracted all the above four main objects in different Data Tables and then exported to Excel in different work sheets which provides a good documentation for end users. There are lot of references available to write data to excel, my version is as follow
Create a method to write data to Excel that takes the datatable as input and writes to different sheets
|
1 2 3 4 5 6 7 8 9 10 11 12 |
Object[] myExcelObject = new object[<Row count>+ 1, <Column count>]; for (int row = 0; row < <Row count>; row++) { for (int col = 0; col < <Column count>; col++) { myExcelObject [row + 1, col] = < DataTable.>Rows[row][col]; } } _excelRange_S1 = _excelSheet1.get_Range("A1", Missing.Value); _excelRange_S1 = _excelRange_S1.get_Resize(<Row Count> + 1, <Column Count>); _excelRange_S1.set_Value(Missing.Value, myExcelObject); _workBook.SaveAs(fileName, _value, _value, _value, _value, _value, Microsoft.Office.Interop.Excel.XlSaveAsAccessMode.xlNoChange, _value, _value, _value, _value, null); _workBook.Close(false, _value, _value); |
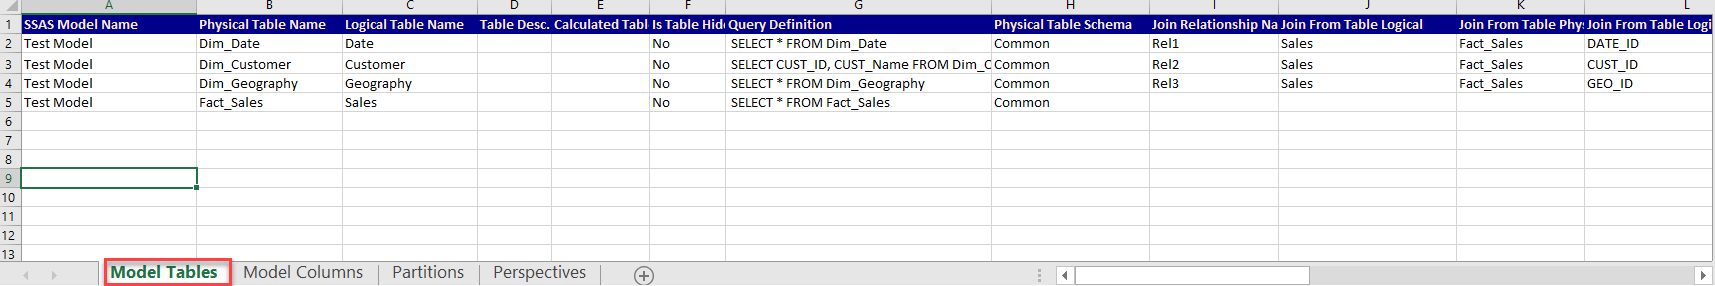
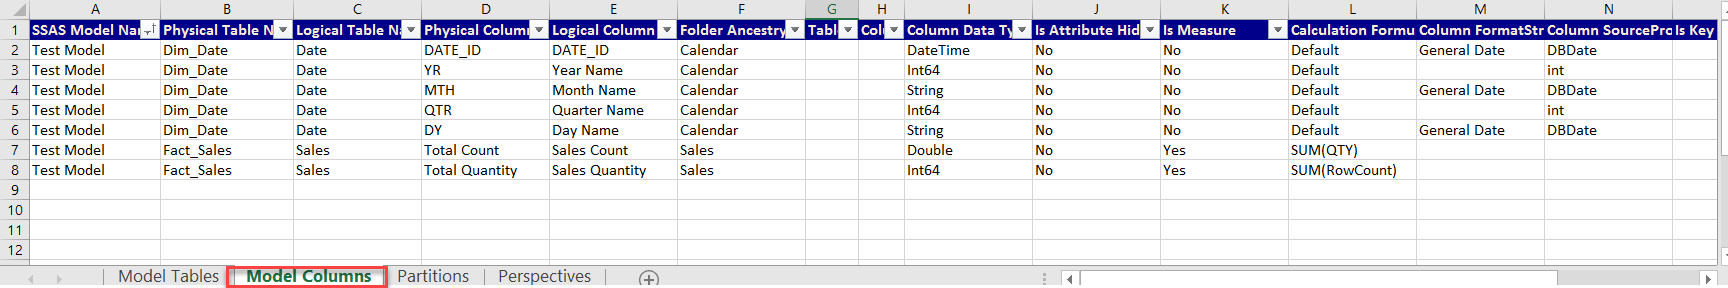
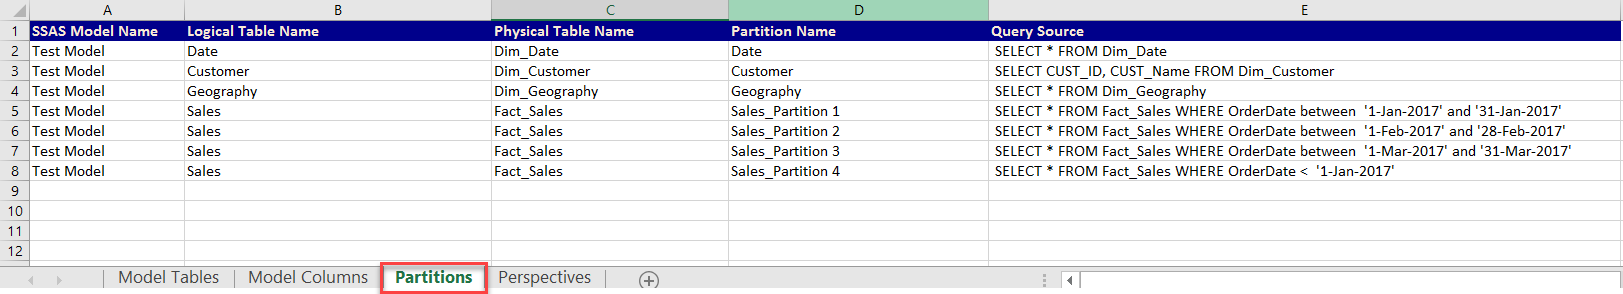
Screenshot sample of the output file
Sheet Model Tables – Tables information and their relationship
Sheet Model Columns – Columns information with their corresponding tables
Sheet Partitions – Partitions information with their corresponding tables
Sheet Perspectives – Perspectives and their corresponding tables

Conclusion
The automation of documentation of the model in an excel file makes it very easy for any type of user to view the model and use it accordingly. The tool is built with all references available from MSDN and can be enhanced further to add further more objects and properties.
Feel free to contact me on the complete code for the tool or suggest any feedback.
See more
For SSAS cube documentation, consider ApexSQL Doc, a tool that offers the possibility of documenting both Multidimensional and Tabular databases in different output formats.
References

View all posts by Divya Agrawal