
The challenge
With the popularity of social networking and sharing sites and their widespread availability, internet marketing techniques have also been rapidly influenced. Sharing sites with high visitor traffic offers great potential for advertisers, so much so that it is almost unheard of now that brands or products do not have a profile or group on a social networking site. Markets have the opportunity to communicate directly with consumers by creating profiles or groups in sharing sites. Thanks to the comments and forums on the pages, they are able to follow both positive and negative attitudes of the target groups about themselves and thus have more precise ideas about what to do next.
Due to all of this above and more, in this article we will integrate Facebook Graph API with Power BI to see if we can tap into this wealth of information. Power BI offers a Facebook connector and this connector is capable of mining data from Facebook (posts, likes, comments etc…). This connector uses Facebook Graph API. This API provides read and write access to the Facebook social graph. With the help of these APIs, we will create a SQLShack Facebook analysis dashboard.
Power BI Facebook Connector
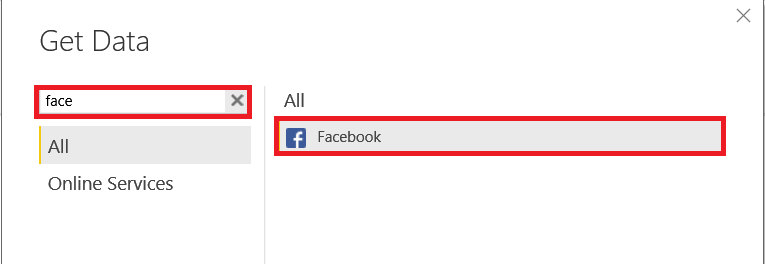
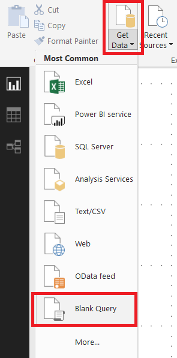
With this connector, we can connect to and get data from Facebook. When you click “Get Data” and then “More”, we can find Facebook connector.
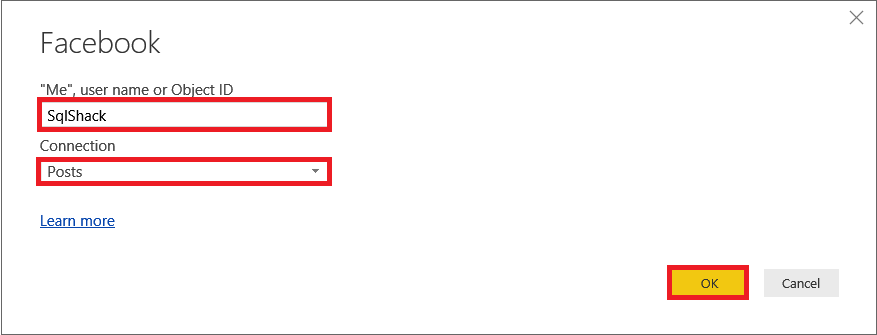
We will write the account name of the person on Facebook for whom we want to get the data.
But, in this article we won’t use the Power BI standard Facebook connector. We will create Facebook Graph API query and then get the data with JSON (JavaScript Object Notation; JSON is a lightweight data-interchange format) format from Facebook.
Because JSON format is always more flexible than other connection types because it is HTTP-based data and has wide usage.
Facebook Graph API Explorer
Facebook Graph API provides to get data out of Facebook. Facebook Graph API Explorer help us to test and create query data. Graph API provides JSON-based data, and for this reason, we can use it in Power BI. In our Power BI dashboard, we will need
- Post caption
- Post name
- Post message
- Post id
- Post created time
- How many people like this post
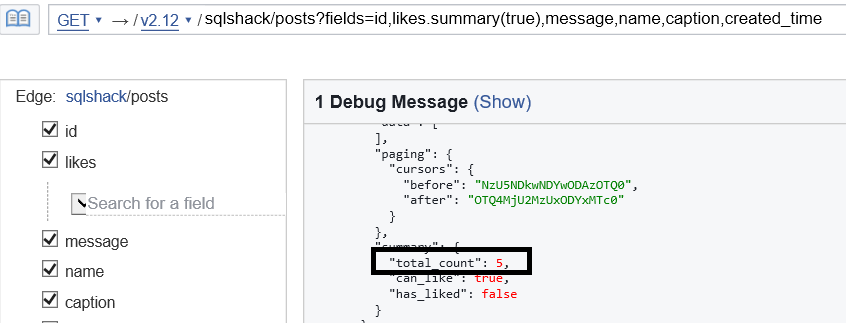
We have to write the query that will return us the above fields. With this query, we can get above fields.
sqlshack/posts?fields=id,likes.limit(10).summary(true),message,name,caption,created_time
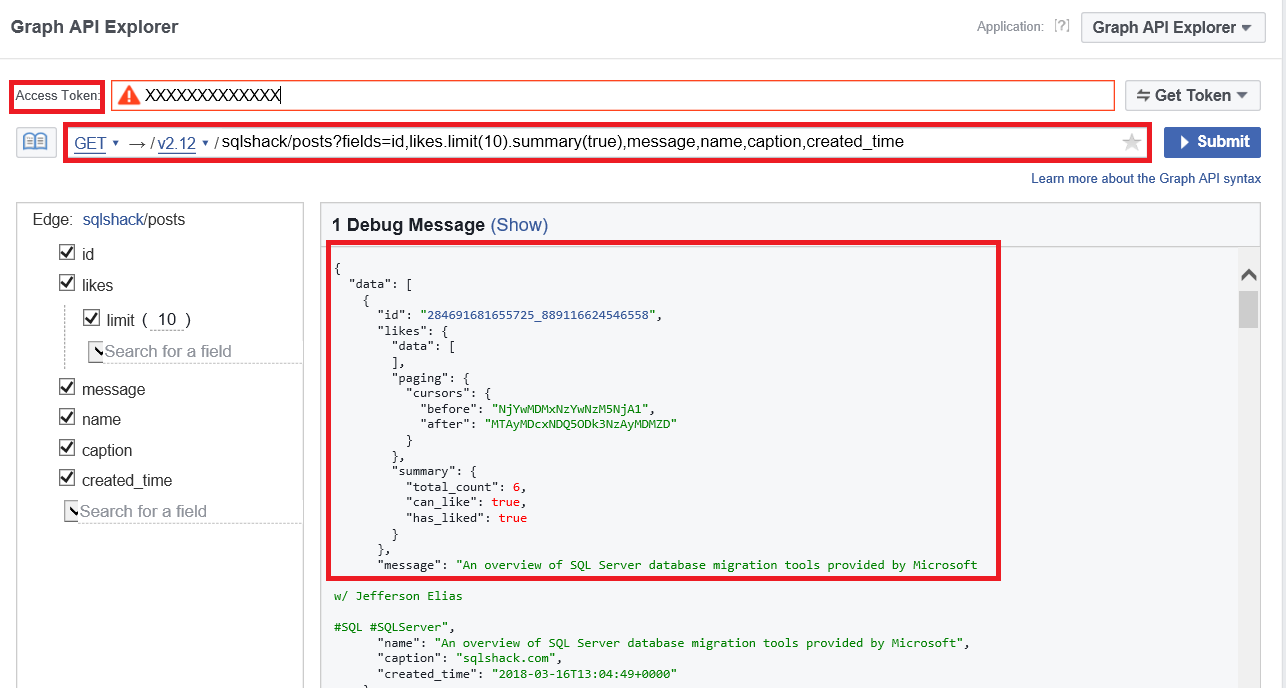
Access Token provides a secure connection between Facebook and requested program.
Create Facebook Analyze Dashboard on Power BI
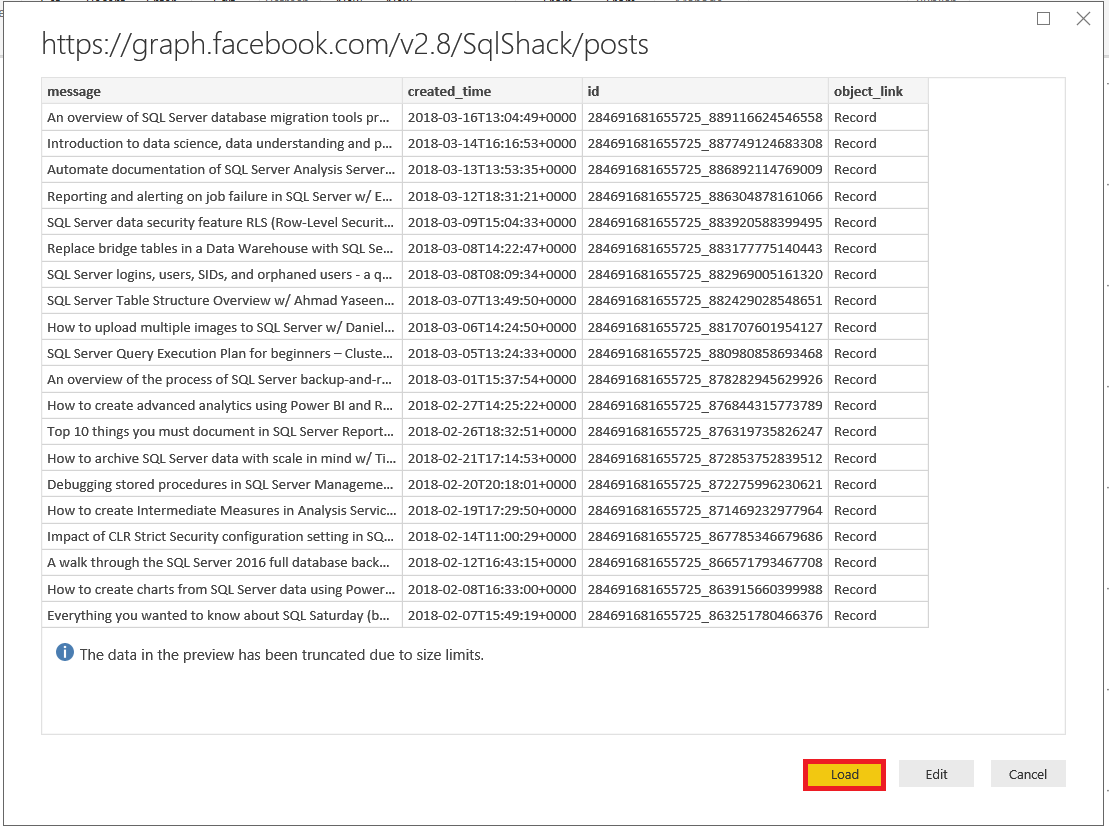
Our Facebook Graph API query is ready for getting data over Facebook. In this step, we will prepare data for Power BI dashboard. We will open Power BI and select ‘Get Data’ then click ‘Blank Query’
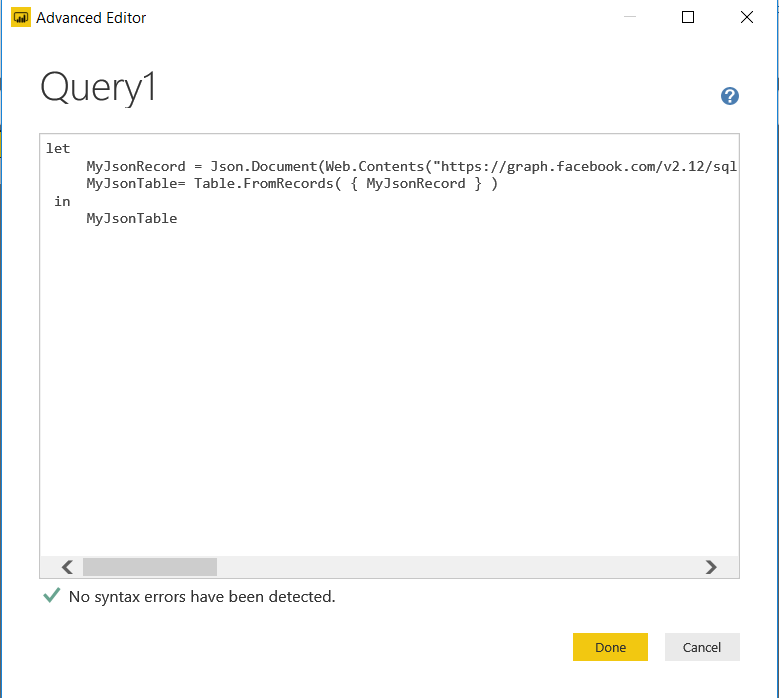
We will open “Advanced Editor” and paste our function script to query editor. In this script web URL request data from Facebook.

|
1 2 3 4 5 |
let MyJsonRecord = Json.Document(Web.Contents("https://graph.facebook.com/v2.12/sqlshack/posts?fields=id,likes.summary(true),message,name,caption,created_time&access_token=WRITEACCESSTOKENHERE ")), MyJsonTable= Table.FromRecords( { MyJsonRecord } ) in MyJsonTable |
This step is very complex because we will convert JSON data to data table, split some of the text values and make some data conversions. For this reason, we will follow step by step.
-
Get Facebook data with JSON format

-
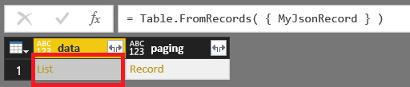
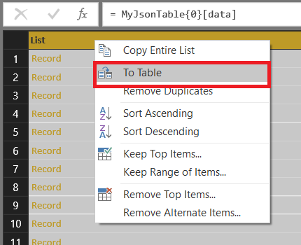
Click list data and open record data
-
Convert record dataset to table
-
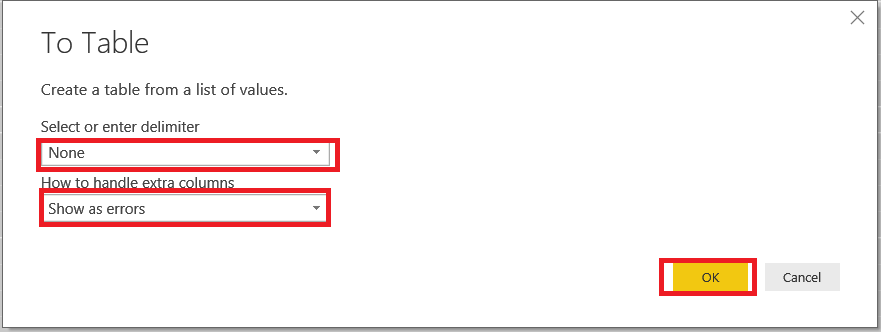
Chose “Select or enter delimiter” property as None and chose “How to handle extra columns” as “Show as errors”
-
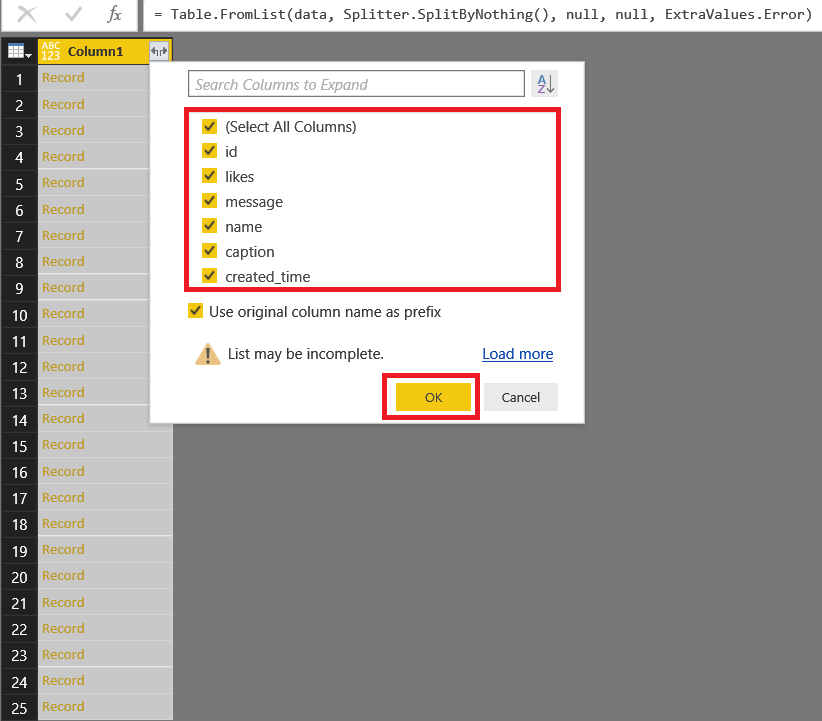
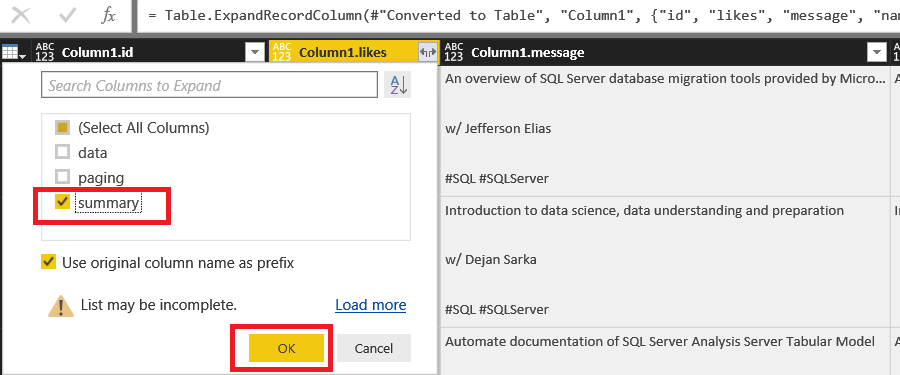
Select all columns for data table
-
Select summary fields on Column1.likes. Because incoming data from Facebook summary fields includes total_count. This field defines a total number of post likes.
-
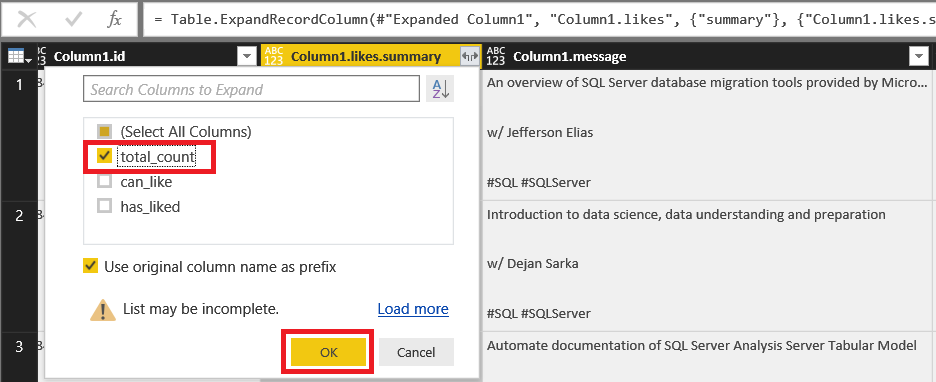
Select total_count field on Column1.likes.summary
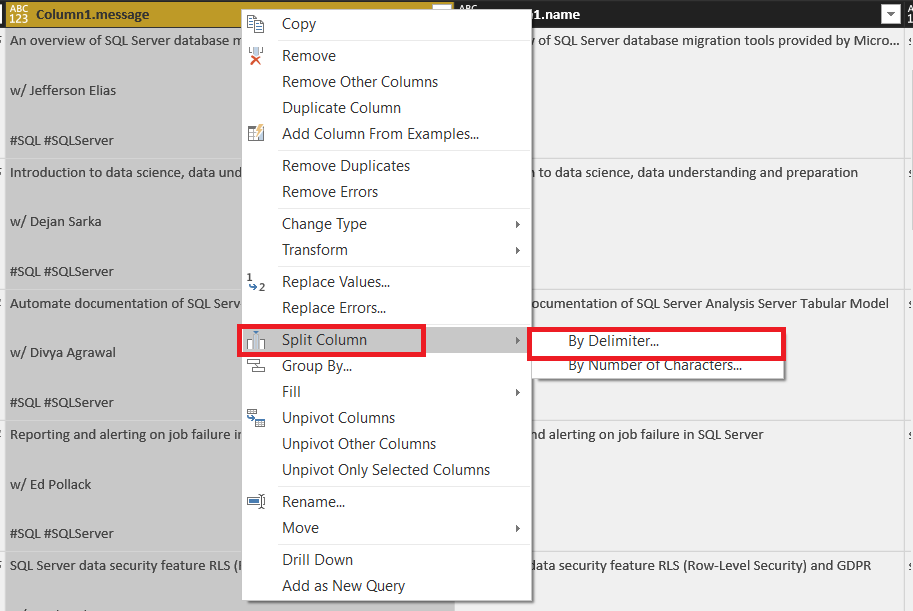
After these steps Facebook raw data is ready. Now, we will split SQLShack Facebook post to find article writer. Because SQLShack Facebook post includes the article writer name between /w and # characters. Through this logic will split Column1.message and get the name of the article writer.
-
Click column1.message and select “split column”
-
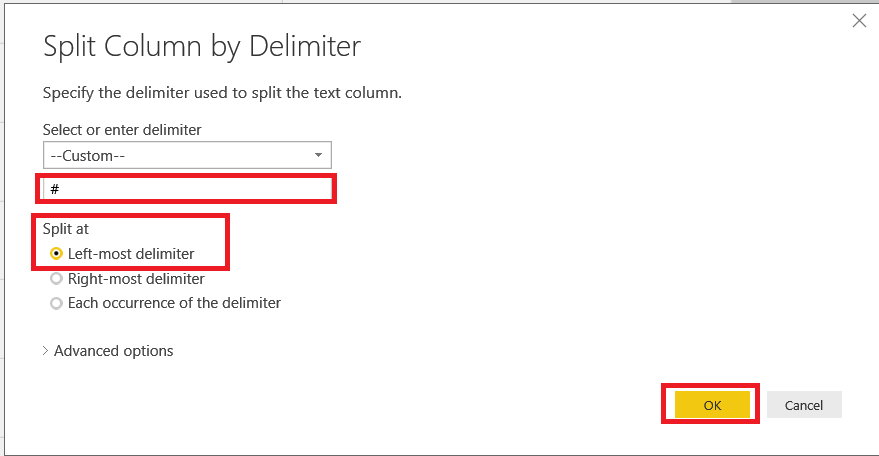
Select custom delimiter and write /w to text box. Click “OK”
-
Repeat the previous step over Column1.2 and split “Left-most delimiter”
-
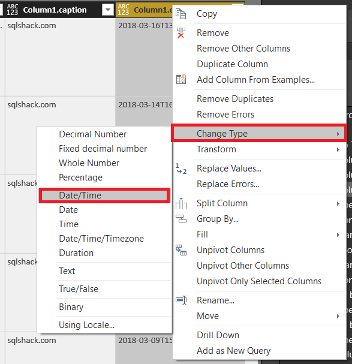
Change created_time column data type to “Date/Time”
-
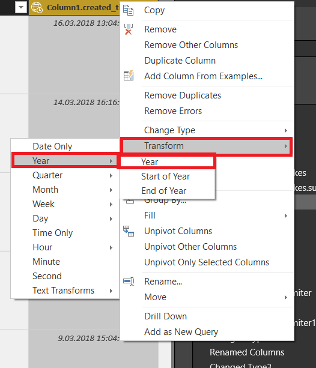
Transform changed field to year and month
- It can use Power BI multiple platforms
- Easy report development
- Simple usage experience
- Marketplace support for third-party component.
- Various data connector support
- Interactive reports and geo-map visualizations
- Leader of Gartner Magic Quadrant for Business Intelligence
- Facebook analytics using Power BI Desktop
- Graph API – Facebook for Developers
- Create Power BI Reports from JSON Data Exposed by REST Service
- SQL Performance Tuning tips for newbies - April 15, 2024
- SQL Unit Testing reference guide for beginners - August 11, 2023
- SQL Cheat Sheet for Newbies - February 21, 2023

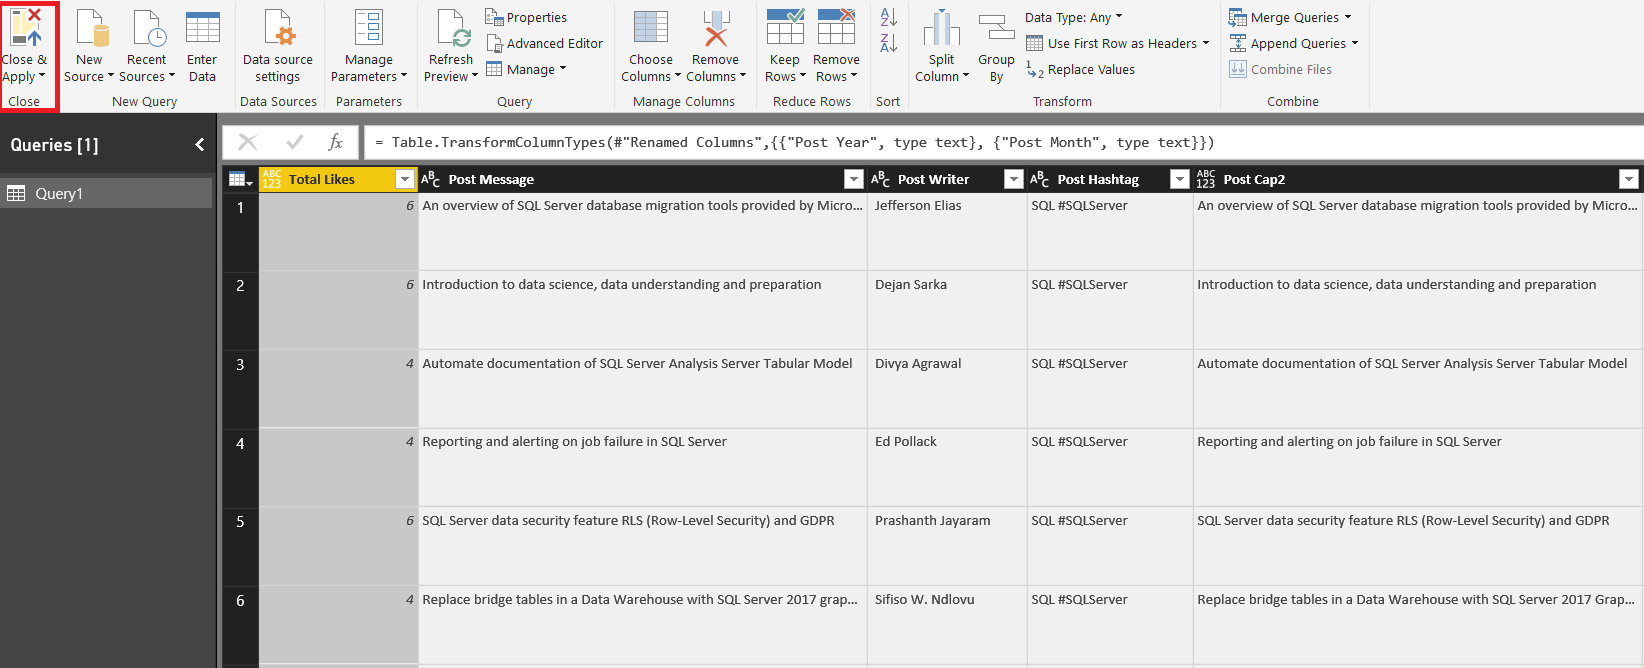
In this step, we will add year and month to the column over created_time
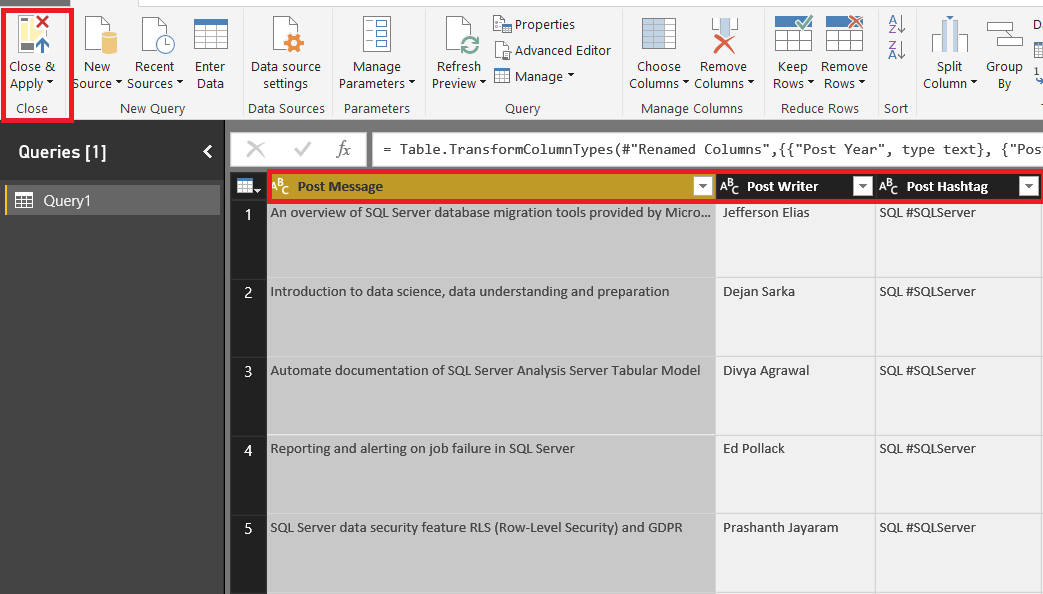
Finally, we will rename columns and then click “Close & Apply”
You can use the below script but pay attention to add access token
|
1 2 3 4 5 6 7 8 9 10 11 12 13 14 15 16 17 18 19 |
let MyJsonRecord = Json.Document(Web.Contents("https://graph.facebook.com/v2.12/sqlshack/posts?fields=id,likes.summary(true),message,name,caption,created_time&access_token=writetokenhere ")), data = MyJsonRecord[data], #"Converted to Table" = Table.FromList(data, Splitter.SplitByNothing(), null, null, ExtraValues.Error), #"Expanded Column1" = Table.ExpandRecordColumn(#"Converted to Table", "Column1", {"likes", "message", "name", "caption", "created_time"}, {"Column1.likes", "Column1.message", "Column1.name", "Column1.caption", "Column1.created_time"}), #"Expanded Column1.likes" = Table.ExpandRecordColumn(#"Expanded Column1", "Column1.likes", {"summary"}, {"Column1.likes.summary"}), #"Expanded Column1.likes.summary" = Table.ExpandRecordColumn(#"Expanded Column1.likes", "Column1.likes.summary", {"total_count"}, {"Column1.likes.summary.total_count"}), #"Changed Type" = Table.TransformColumnTypes(#"Expanded Column1.likes.summary",{{"Column1.created_time", type datetimezone}}), #"Duplicated Column" = Table.DuplicateColumn(#"Changed Type", "Column1.created_time", "Column1.created_time - Copy"), #"Extracted Year" = Table.TransformColumns(#"Duplicated Column",{{"Column1.created_time", Date.Year, Int64.Type}}), #"Extracted Month" = Table.TransformColumns(#"Extracted Year",{{"Column1.created_time - Copy", Date.Month, Int64.Type}}), #"Split Column by Delimiter" = Table.SplitColumn(#"Extracted Month", "Column1.message", Splitter.SplitTextByDelimiter("w/", QuoteStyle.Csv), {"Column1.message.1", "Column1.message.2"}), #"Changed Type1" = Table.TransformColumnTypes(#"Split Column by Delimiter",{{"Column1.message.1", type text}, {"Column1.message.2", type text}}), #"Split Column by Delimiter1" = Table.SplitColumn(#"Changed Type1", "Column1.message.2", Splitter.SplitTextByEachDelimiter({"#"}, QuoteStyle.Csv, false), {"Column1.message.2.1", "Column1.message.2.2"}), #"Changed Type2" = Table.TransformColumnTypes(#"Split Column by Delimiter1",{{"Column1.message.2.1", type text}, {"Column1.message.2.2", type text}}), #"Renamed Columns" = Table.RenameColumns(#"Changed Type2",{{"Column1.likes.summary.total_count", "Total Likes"}, {"Column1.message.1", "Post Message"}, {"Column1.message.2.1", "Post Writer"}, {"Column1.message.2.2", "Post Hashtag"}, {"Column1.created_time", "Post Year"}, {"Column1.created_time - Copy", "Post Month"}, {"Column1.caption", "Post Caption"}, {"Column1.name", "Post Cap2"}}), #"Changed Type3" = Table.TransformColumnTypes(#"Renamed Columns",{{"Post Year", type text}, {"Post Month", type text}, {"Total Likes", type number}}) in #"Changed Type3" |
In this step, we will click “Close & Apply” and will focus on Power BI design screen. In this screen, we will add different types of charts and tables.
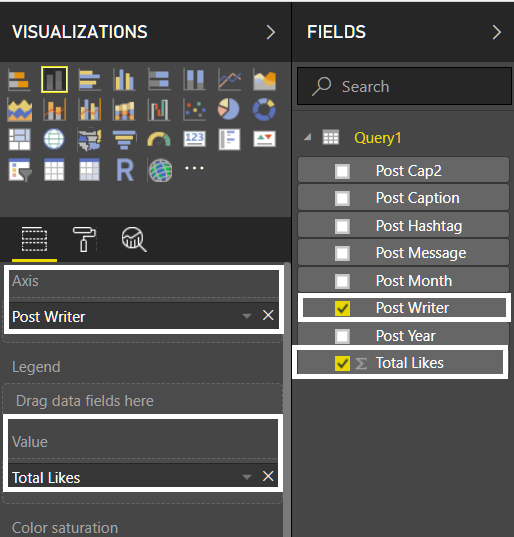
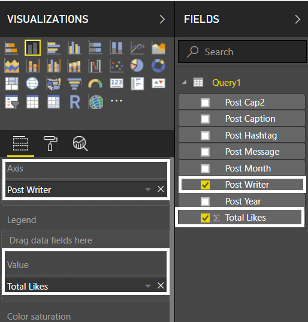
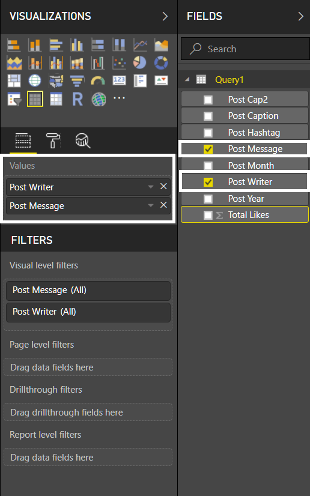
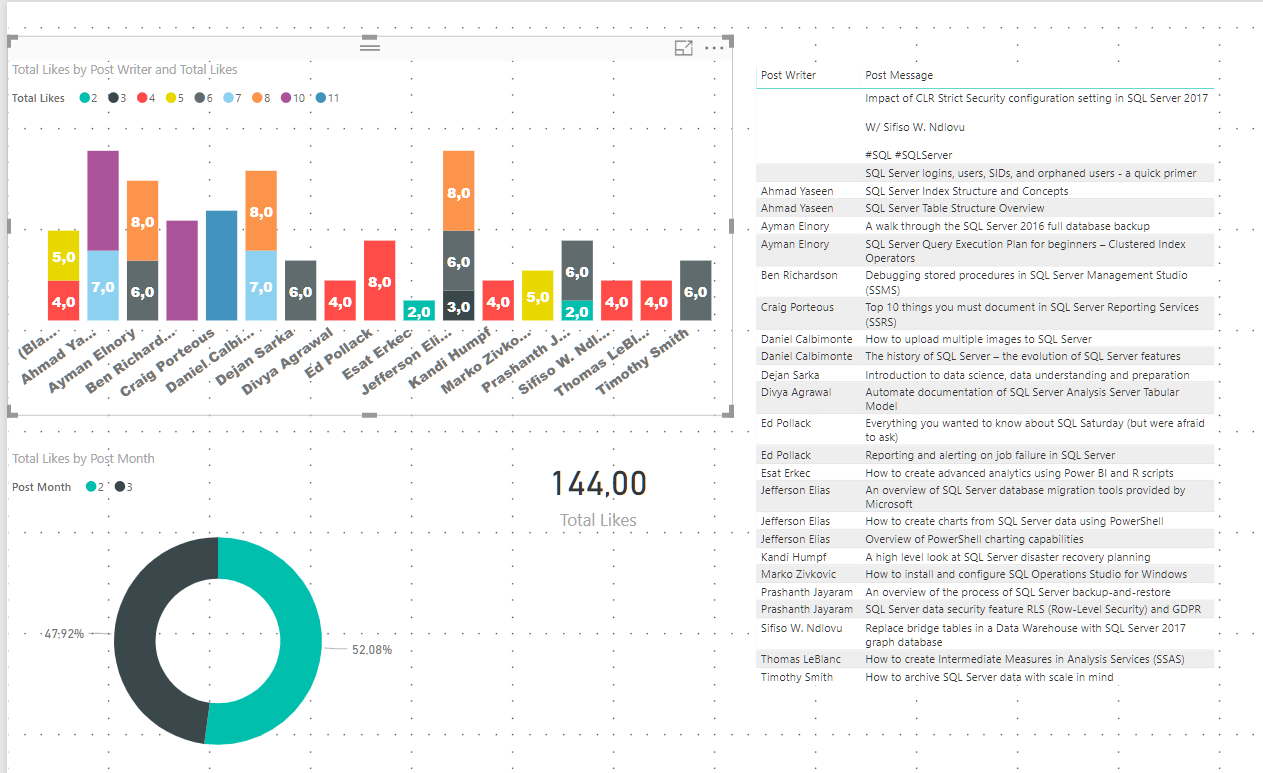
Now, we will add “Stacked Column Chart” to visualize the writers and likes of the article on the graph. We will drag and drop “Post Writer” column to Axis field and “Total Likes” column to “Value” field.
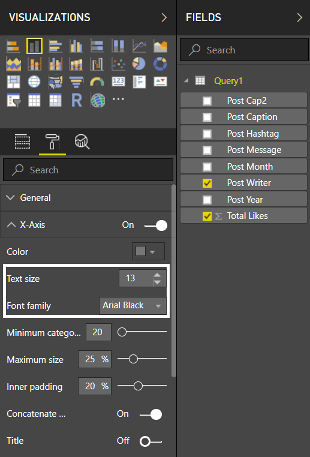
In this step, we will change some of stacked column chart format properties. We will increase “Text-size” property under “X-Axis” tab and change Font-Family to “Arial Black” because in x-axis we will show the writer names.
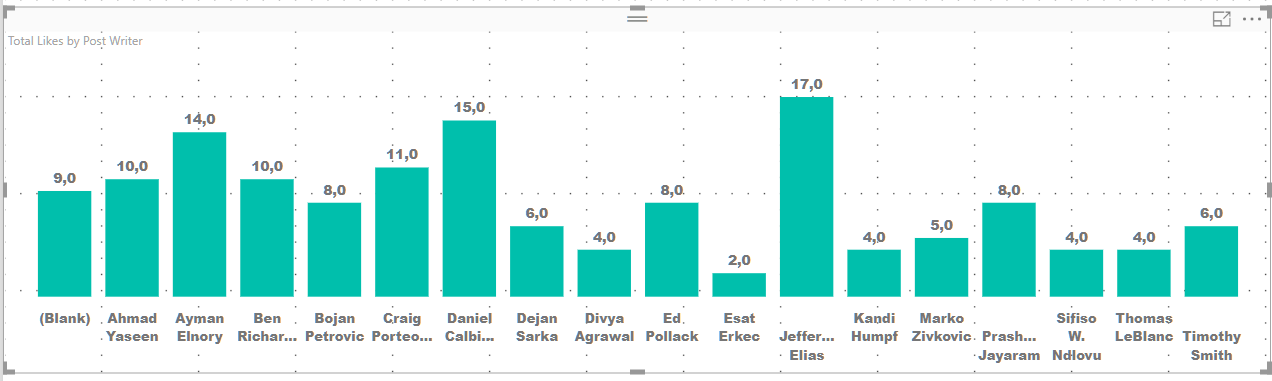
Finally, we can look at stacked column chart. This chart defines which writer get how many likes.
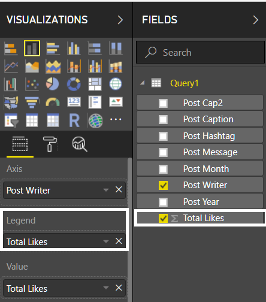
When we will drag and drop total likes to legend field. This graphic will define a number of likes per individual article.
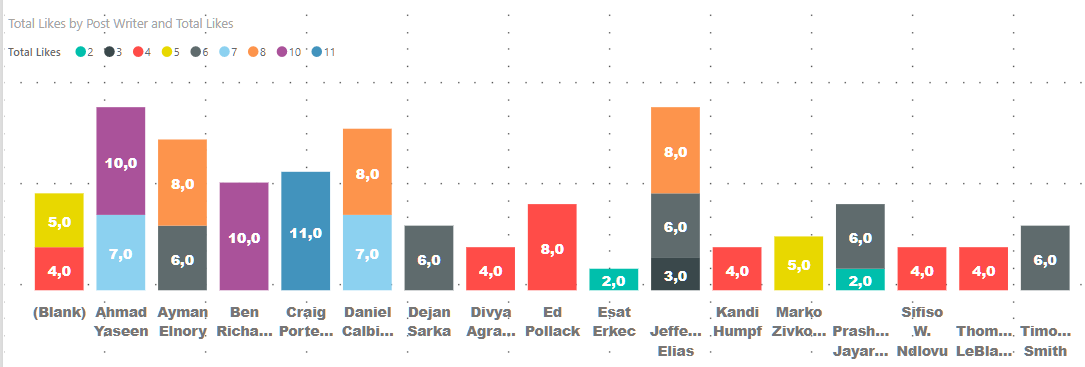
Note: In the above chart we see a “blank” writer. It means the split function cannot split article writer name.
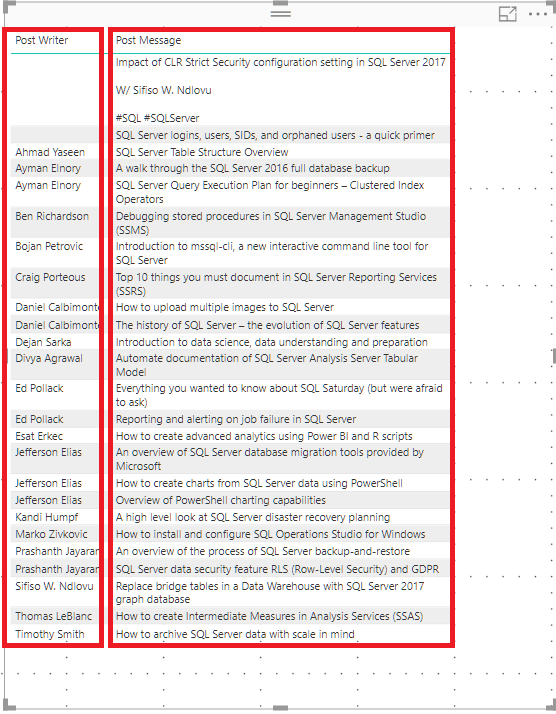
We will add a table to show post writer and post a message. We will drag and drop “Post Message” and “Post Writer” columns to values field.
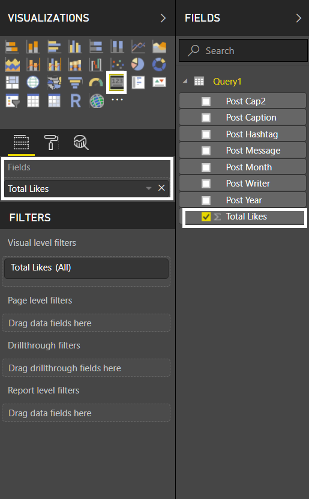
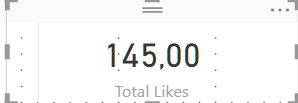
We will add a card to show a total number of likes.
In this last step, we will add “Donut Chart” and percentage of post likes. We will add donut chart and will drag and drop “Post Month” to “Legend” field and “Total Likes” to “Values” field.

Finally, our dashboard is ready.
Conclusion
In this article we talked about Power BI and Facebook integration. This integration is one of the Power BI advantages. But Power BI offers various capabilities.
Due to above descriptions Power BI development team seems very motivated to offer new features.
References

Most of his career has been focused on SQL Server Database Administration and Development. His current interests are in database administration and Business Intelligence. You can find him on LinkedIn.
View all posts by Esat Erkec