

In this article, we’ll look at how to create a Word cloud generator in Power BI Desktop, including importing data, customization and more.
In my last article, Power BI Desktop Interactive chord diagrams, we learned about customized visualizations in Power BI Desktop. These visualizations are free to install and we can use them with our data set and customize charts as per our requirements.
Overview
A Word Cloud is a visualization that draws an image from frequently appearing words in the data set. These words are arranged in a cloud shape. The size of the words in the cloud image is proportional to its frequency.
Below is an example of how Word cluster looks like (Image Courtesy – Wikipedia)

We can use word clusters to display keywords, tags, etc. We can quickly locate the items in the Word Cloud based on the size and color of the word.
For example, in the above example, we can see that the fewer words are appearing in the larger font size that shows the most used keyword as per the conditions defined.
We can use Power BI Desktop to create an interactive visualization with control on the appearance of the word cluster on the text, size, color, number of words, background, rotation etc.
Importing Sample data for Word Cloud Generator
To create a word cloud generator, we’ll first need data. In this example, we will use sample data books.csv from GitHub. This data shows the title, author, genre and publisher details.
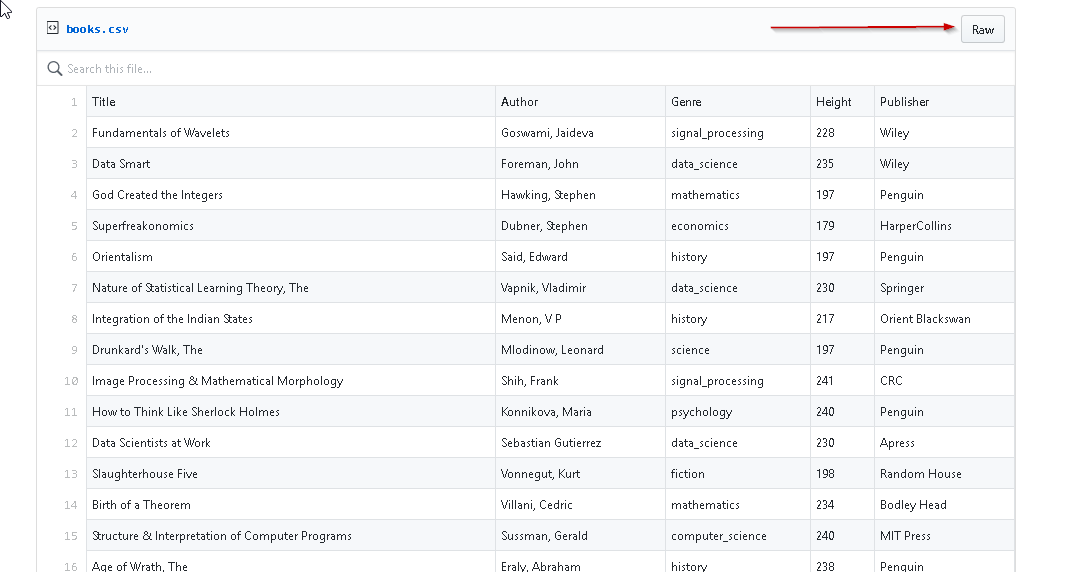
Click on Raw, copy and save the data into.CSV file. We will import this.CSV file to create the Word cloud generator in Power BI Desktop.
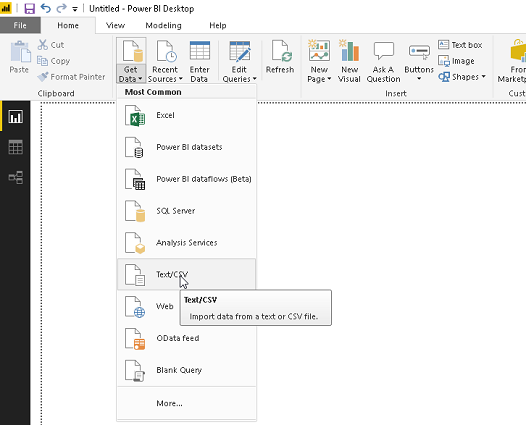
Now open Power BI Desktop and click on ‘Get Data’. Choose ‘Text\CSV’ source from the list.
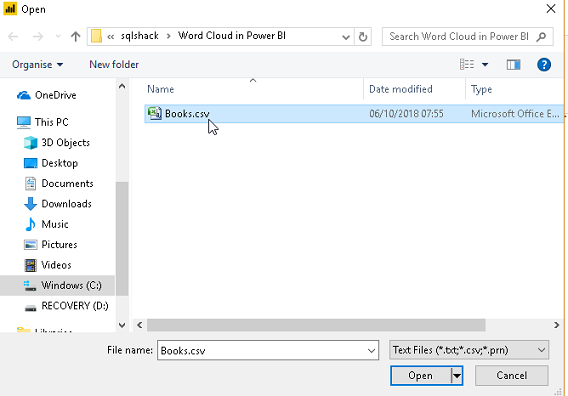
Provide the location of the source data (books.csv) and click Open.
We can get a preview of the data here. If we do not want to make any changes in the data, then click on Load.
In this example, some of the fields contain blank values as well. Therefore, we do not want those blank values data to create a Word Cloud generator. Click on Edit
In this example, some of the fields contain blank values as well. Therefore, we do not want those blank values data to create our Word cluster. Click on Edit
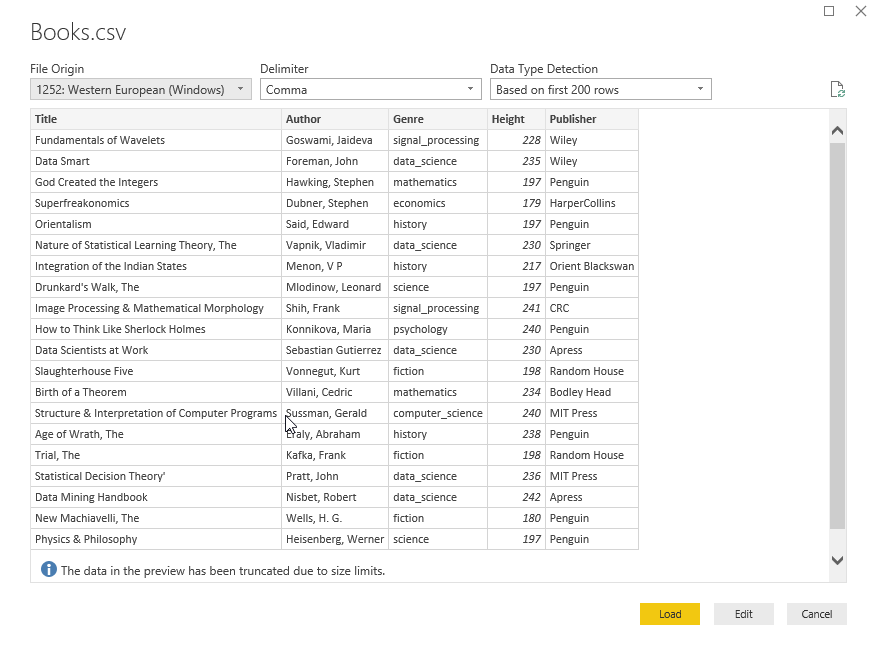
In this example, some of the fields contain blank values as well. Therefore, we do not want those blank values data to create our Word cloud generator. Now click on Edit to make changes in the data.
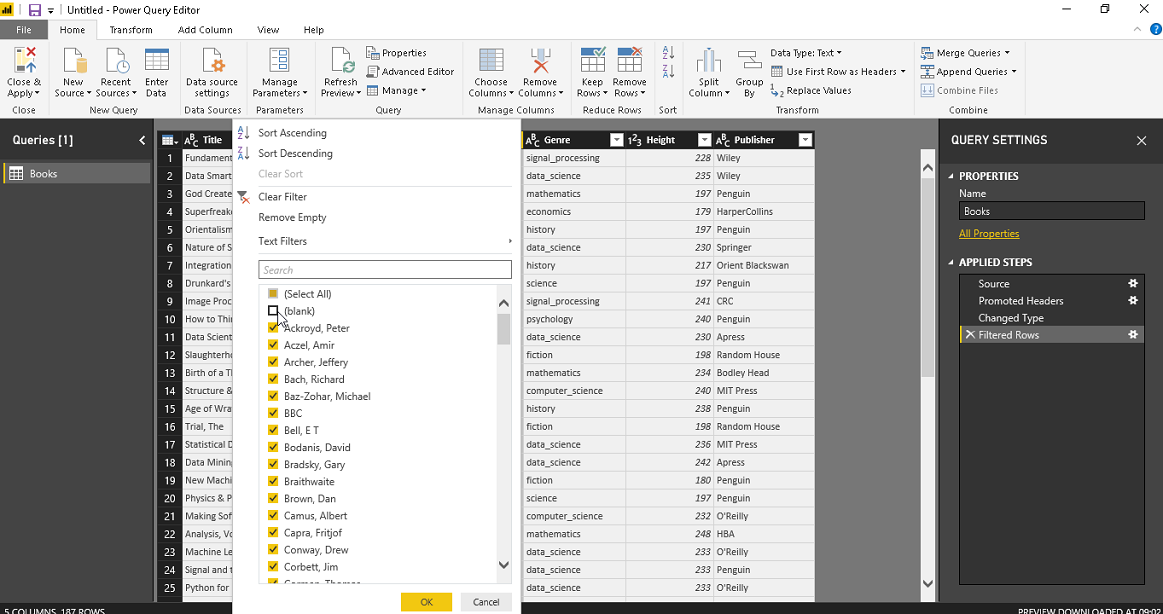
This opens Power Query Editor. Click on the columns and uncheck the blank value option from the publisher column.
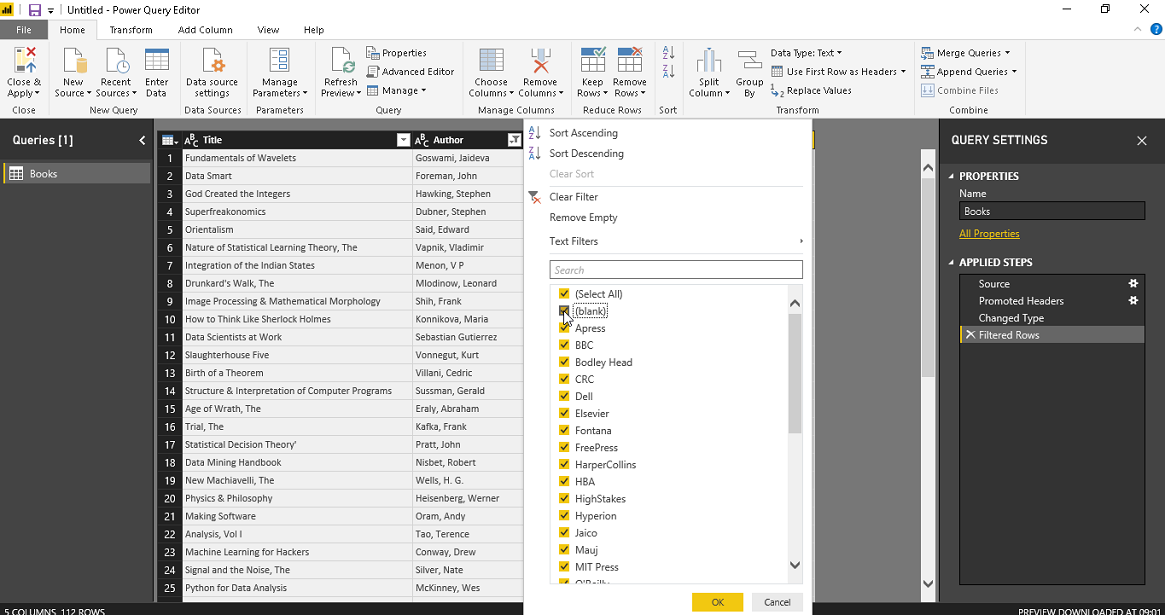
Similarly, uncheck the blank value from the ‘Author’ column.
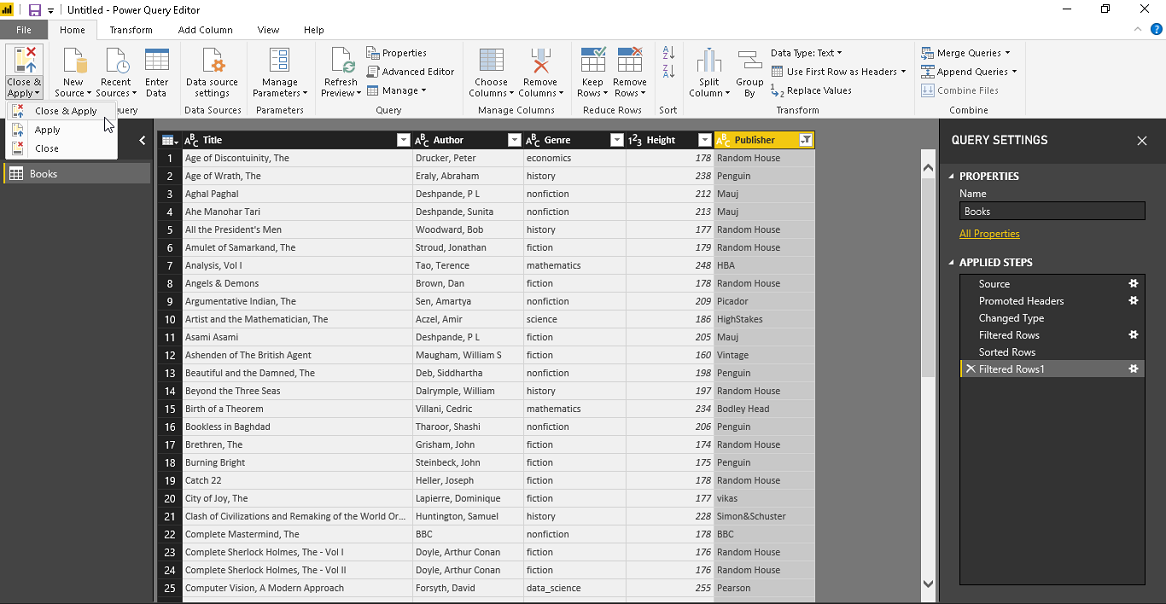
Once we are done, click on ‘Close and Apply’
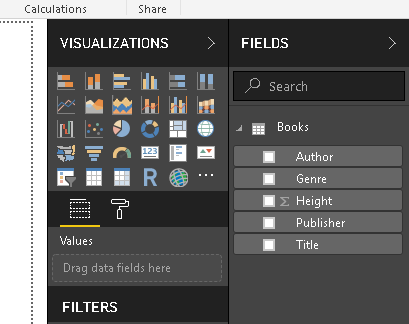
Now, we can see the fields in our dataset in the ‘Fields’ section.
Importing from Microsoft AppSource for Word Cloud Generator
We can get the Word cluster from the Microsoft AppSource. We can view a brief description and tutorial video clip on the page.
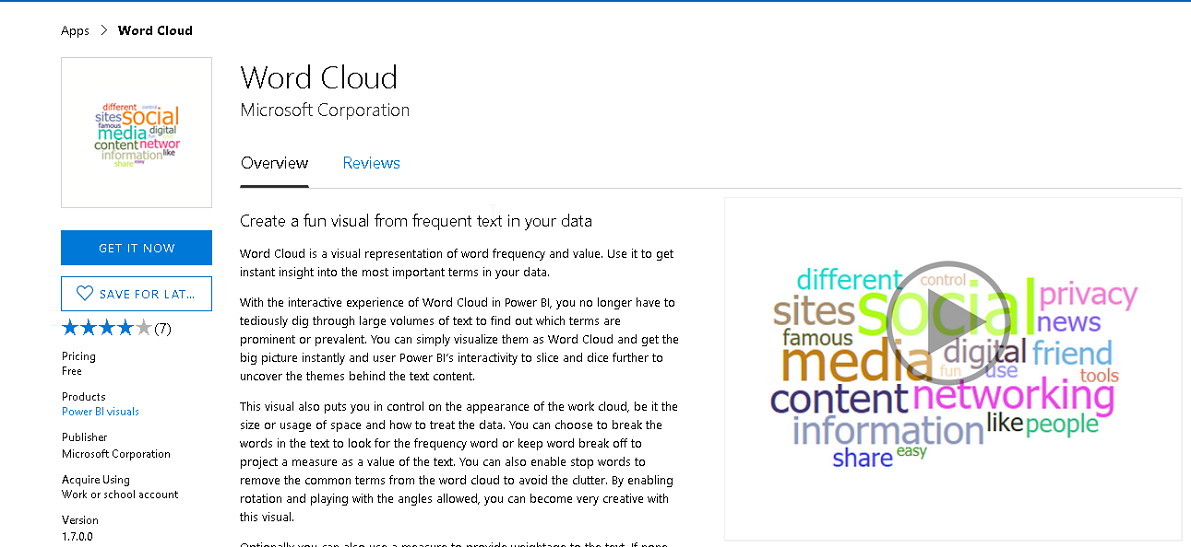
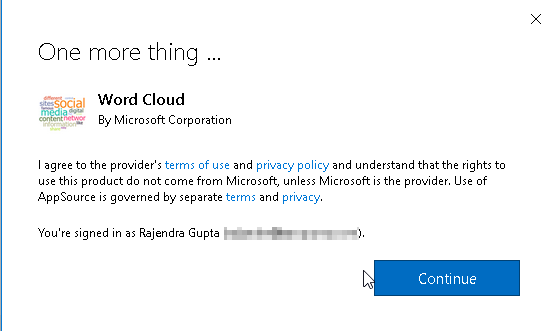
Click on ‘Get IT Now’ and click on continue to accept the terms and conditions. Please note you need to log in with a work account in order to install a Word cluster in Power BI Desktop.
Click on Download for Power BI
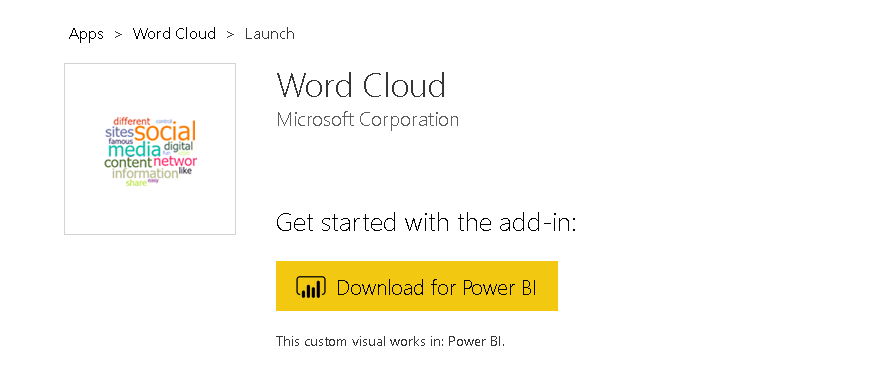
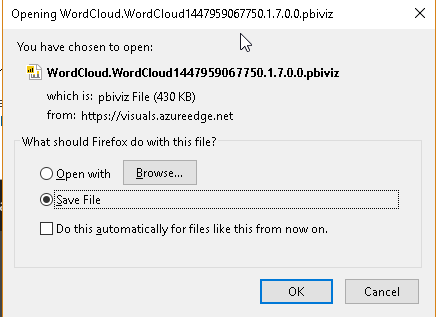
Save the .pbiviz file into the desired location. We will use this file to import into Power BI Desktop.
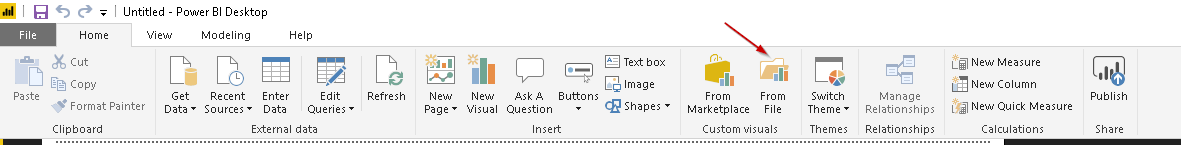
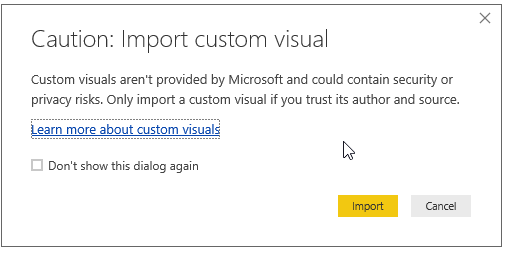
Now in the Power BI Desktop, Click on custom visual section From File. We get a warning message that the custom visuals are not provided by Microsoft and we should consider security or compliance risks before proceeding.
Click on Import to move further.
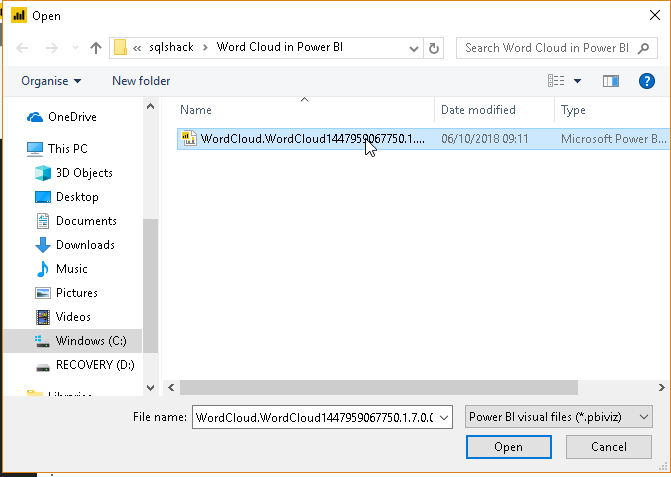
Provide the path of the Power Bi visual file (.pbiwiz) downloaded earlier and click open.
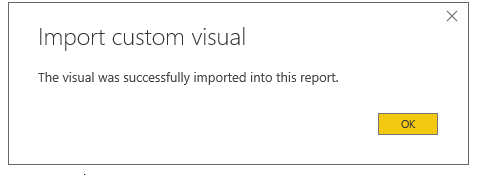
This imports the custom Word cluster visual and results in the following success message.
We can see below the icon for Word cluster in the visualization section of Power BI Desktop now.
![]()
Custom visualizations
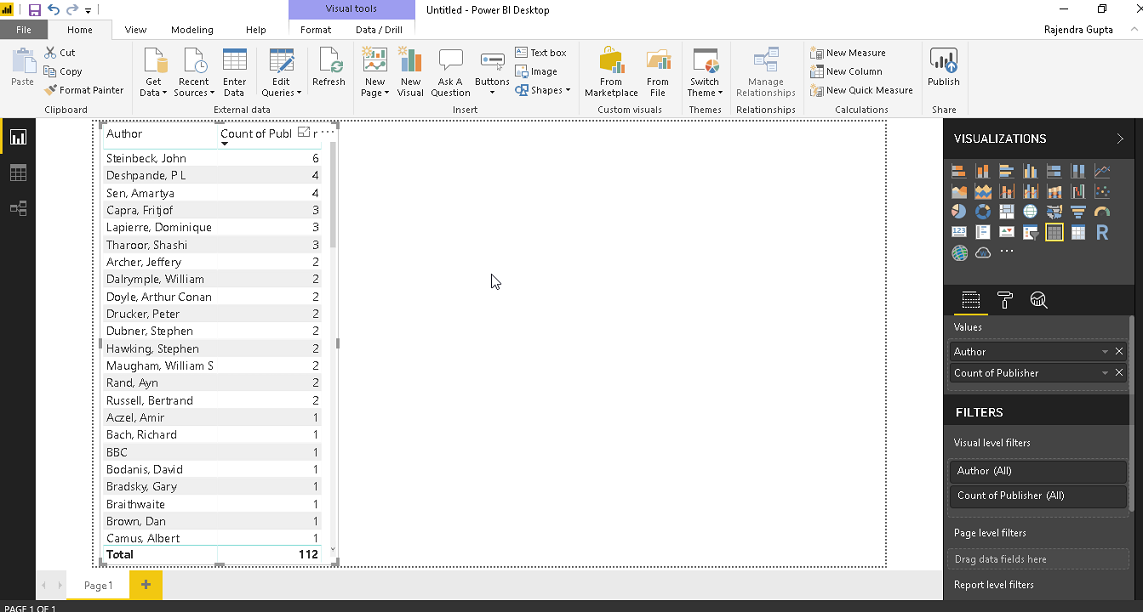
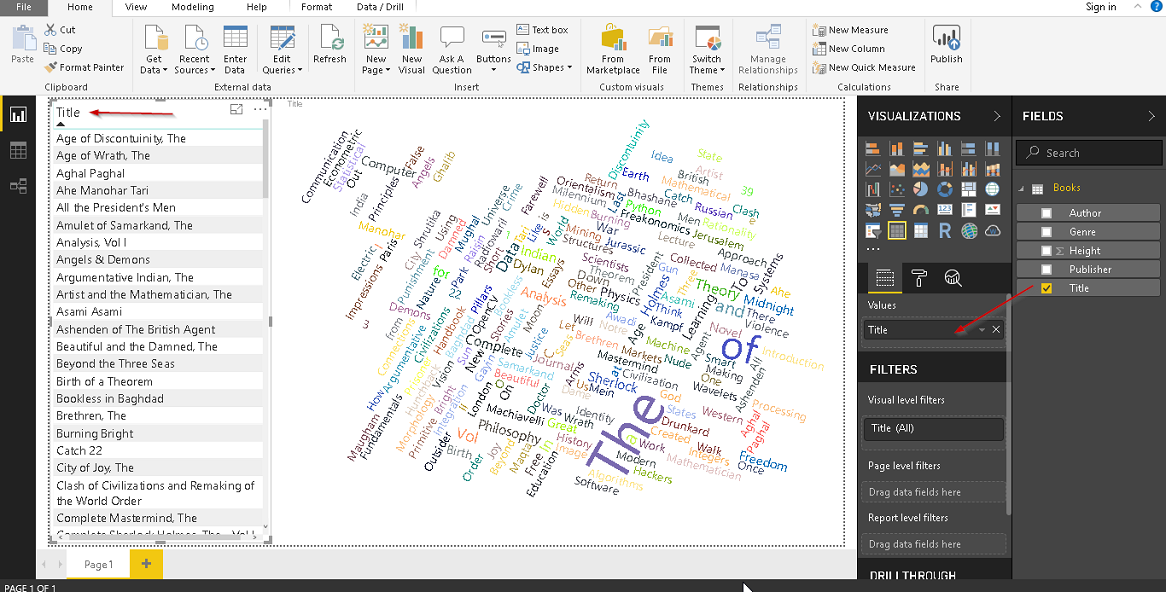
Before we create the Word cloud generator, let us understand the sample data further. Put a check on the Author and Publisher columns and we can see both columns data on the left-hand side.
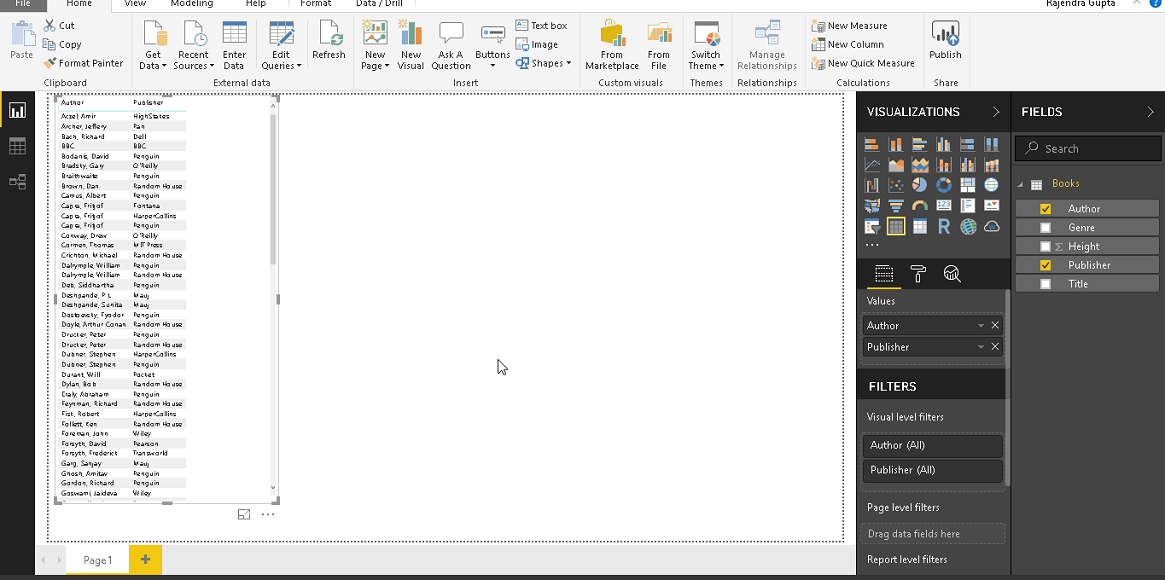
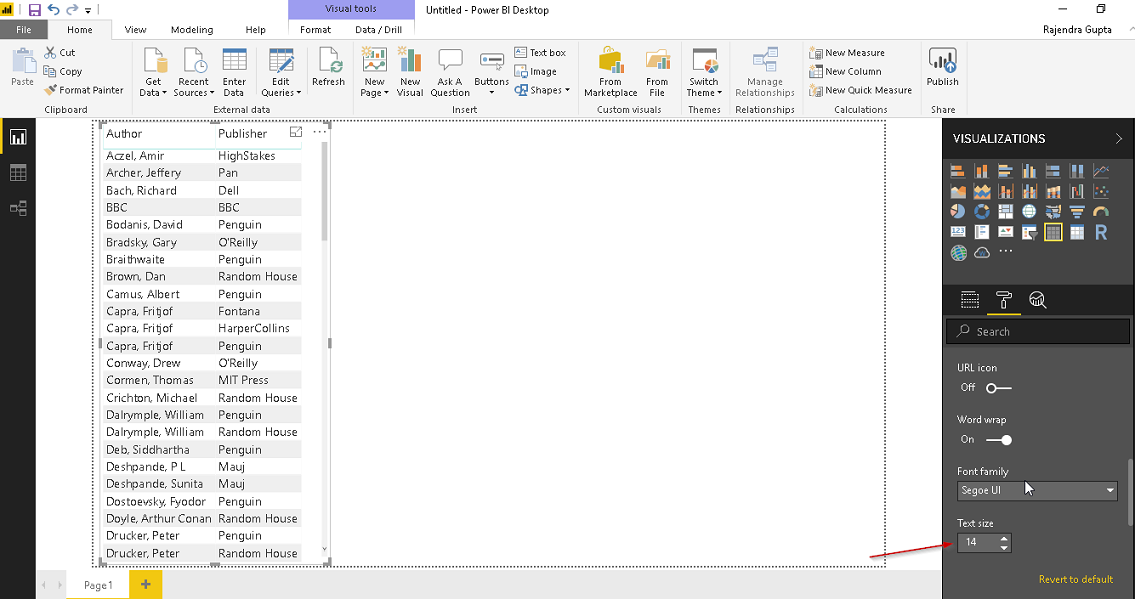
Let us increase the font size of the data to view it properly. To do so, increase the font size from
Format > Column header > Text Size
Format > Values >Text Size
Data is now visible properly. Click on publisher column and select Count.
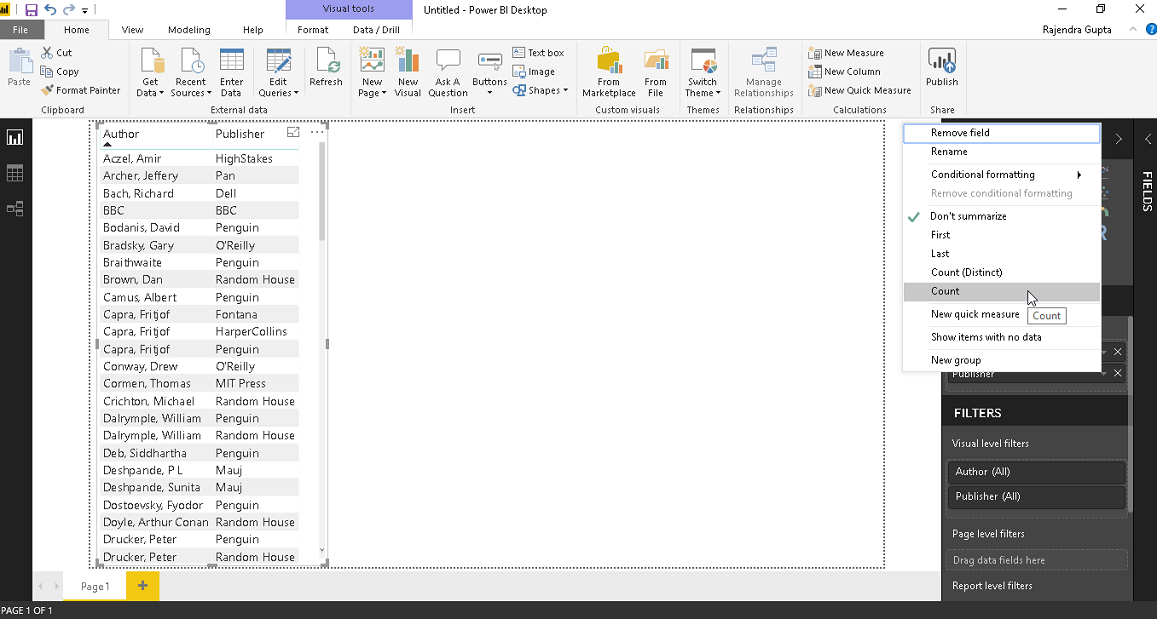
This shows the count of the publisher for the authors.
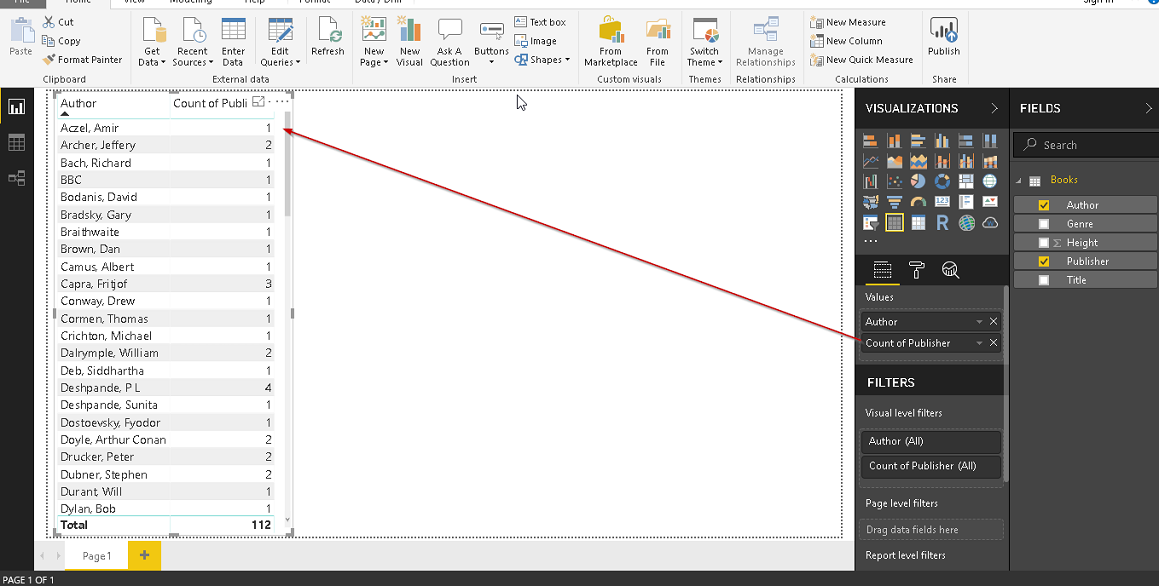
We can sort the data here easily. Simply, click on the column name and sort it in ascending or descending order.
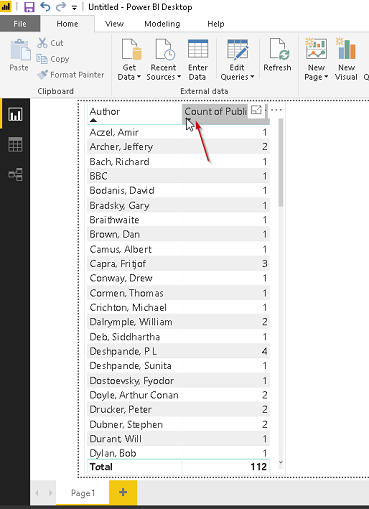
Now, our data looks like below and we are now ready to create a Word Cloud generator from this.
Click on Word Cloud Generator icon from the Visualization section and this draws a blank chart.
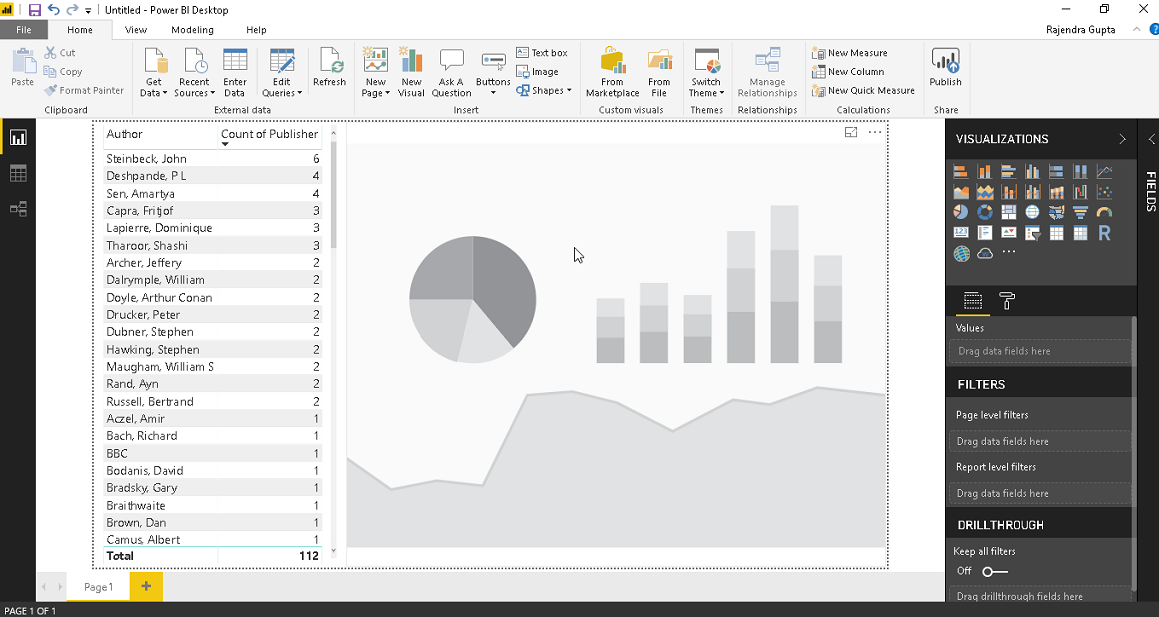
Drag the fields from the data set in the category and values section. Below we can see fields as
Category -> Authors
Values -> Publishers
This draws up the Word cluster based on the data we selected.
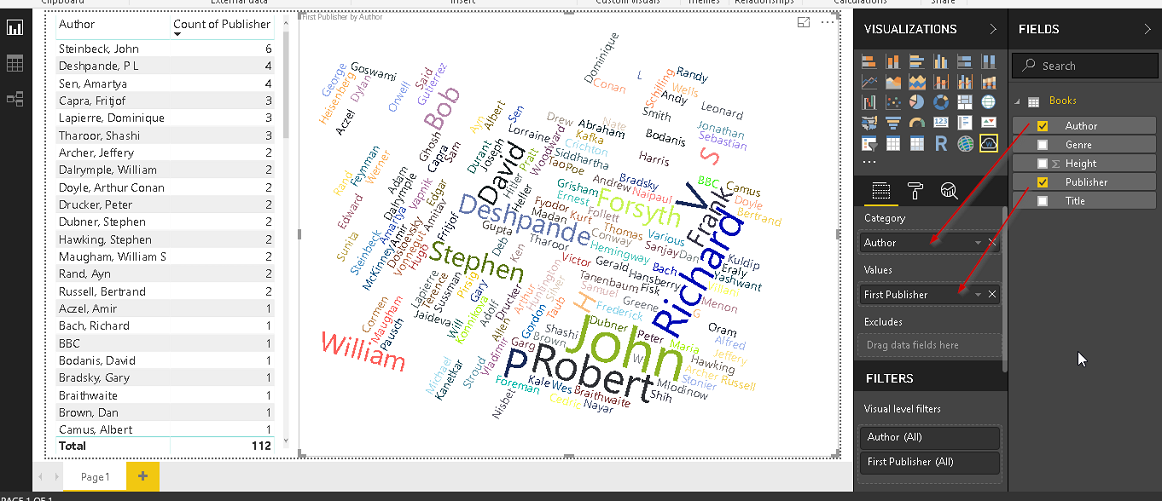
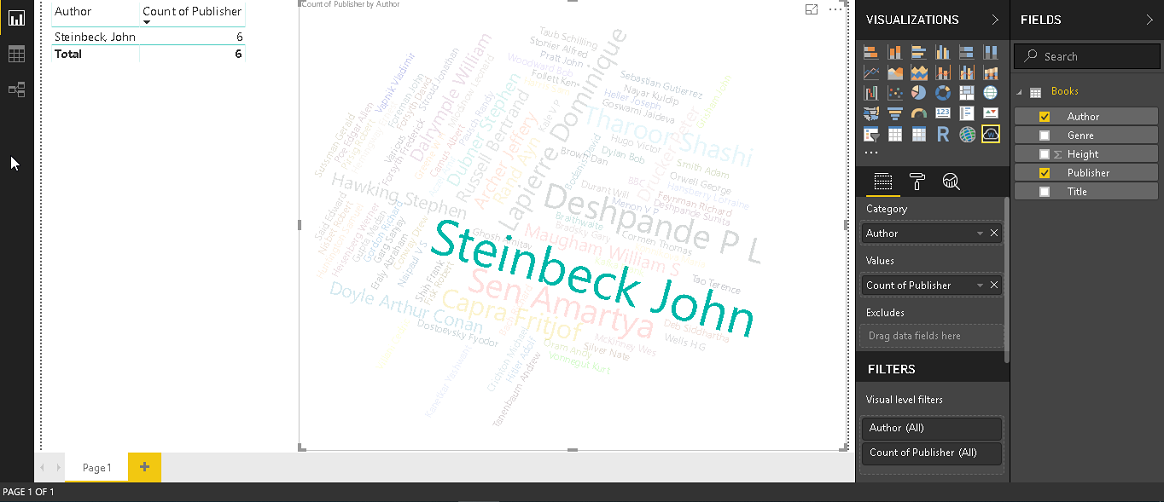
If we click on any particular word, it shows up the details of that particular author. However, as we can see, for author John , it just looked at the first name John and combined the data together.
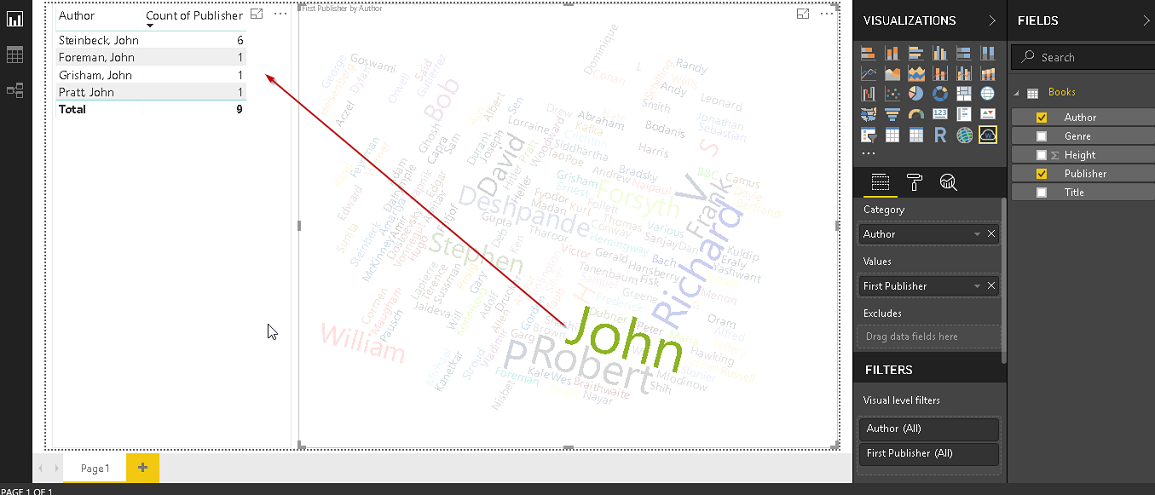
Similarly, we can change the value to Count of the publisher from the drop-down option.
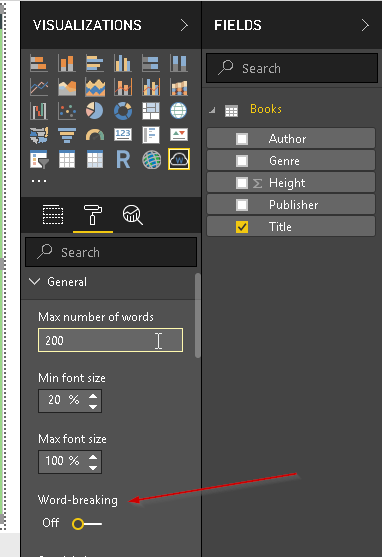
By default, the Word cluster looks for the first word in the value section in Word Cloud Generator. It does not look the entire word as a single word. If we want to create a Word cloud generator for the complete name, go to General ->Word-breaking. By default, it is turned on. Move the slider and turn off the word breaking.
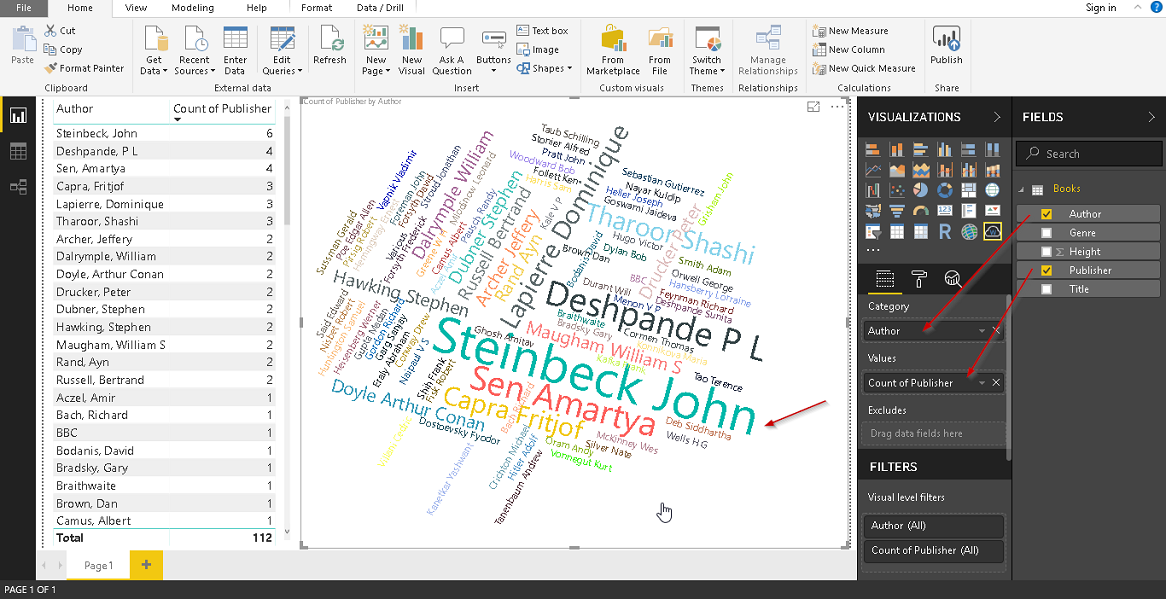
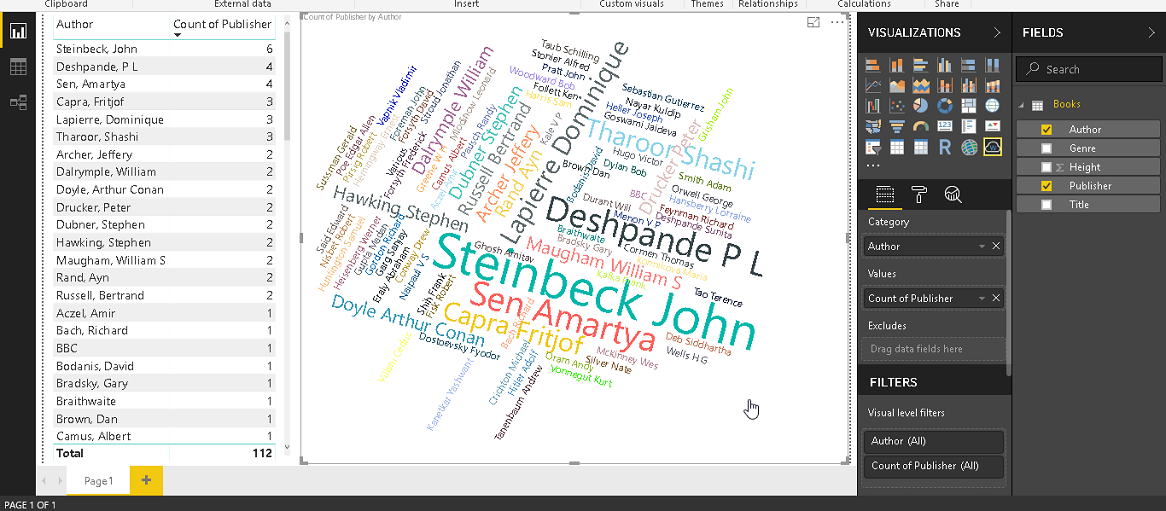
We can now observe the Word cluster; this is now showing the complete name of the author. If we look at our data table, Steinbeck John is having the highest count and it reflects in the Word cluster. The font size of Steinbeck John is largest in the visual.
Now if we click on it, we can see that only one row for it.
Stop Words in Word Cloud Generator
We normally use some common words, for example, a, an, the, etc. Sometimes we do not want these words to appear in the Word cluster since they are commonly used words and if our dataset contains these words, it would be difficult to get a true picture of Word cluster by showing frequently used words.
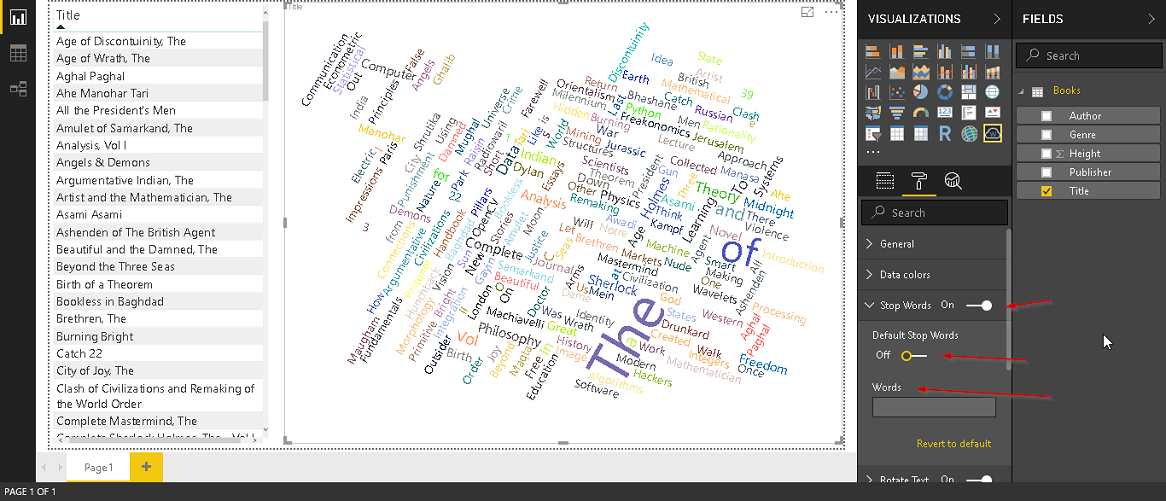
In the below example, we created a Word Cluster visual for ‘Title’.
We can see above, there are a few words (the, of) appearing in the visual and we do not want to show them in this Word cluster.
To exclude those words, go to format -: Stop Words.
Move the slider to turn on this feature and enable Default-Stop Words.
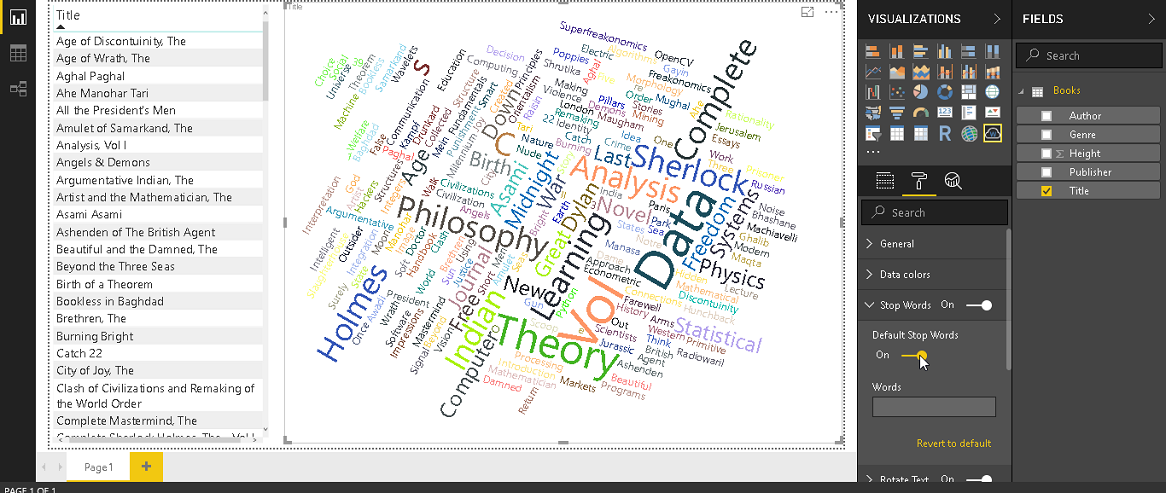
Default stop words removed commonly used stop words from the Word Cloud Generator.
We can see the below visual after we turned on Default-Stop Words.
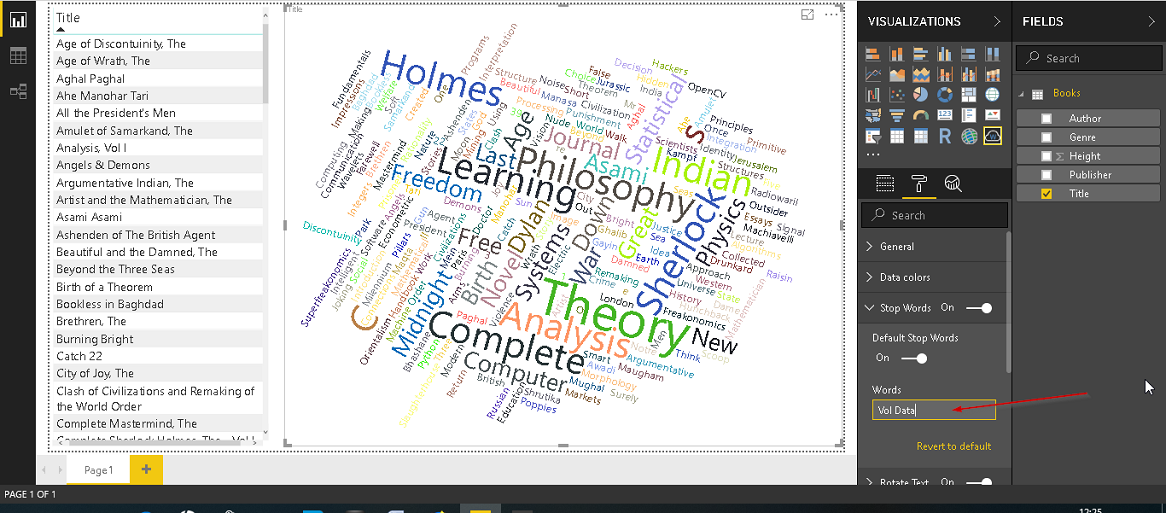
We can also specify words to exclude apart from the default stop words. For example, we want to exclude the word ‘Vol’ so specify ‘Vol’ in the words section as shown below
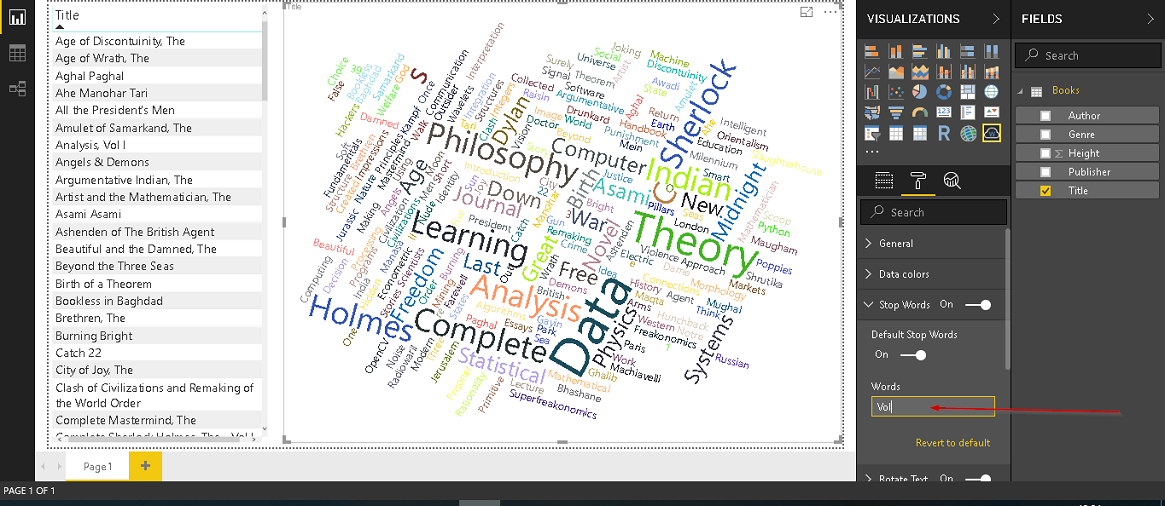
If we want to exclude multiple words, specify them with space. For example, in below visual, we excluded ‘Vol data’ keywords.
Customization in Word Cloud Generator
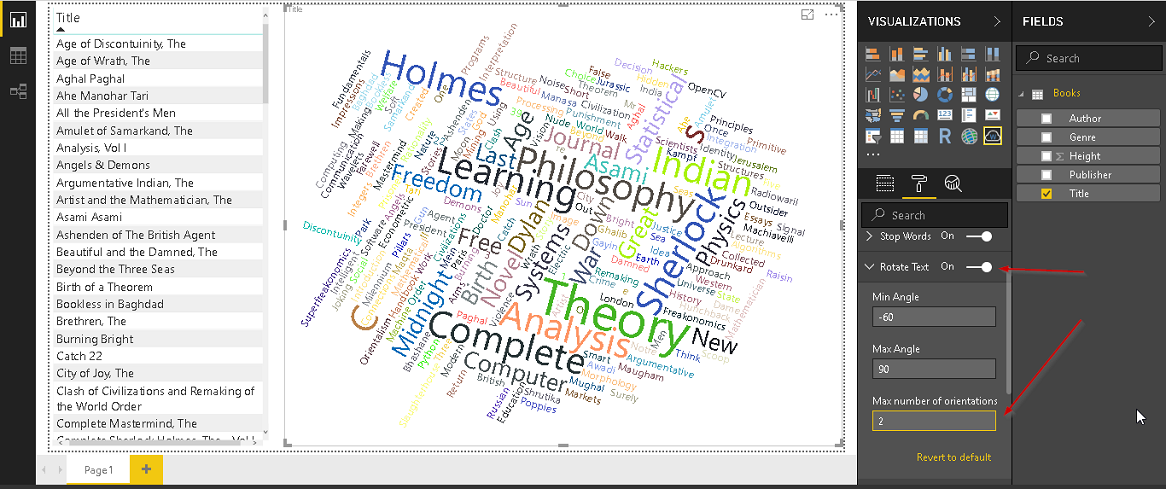
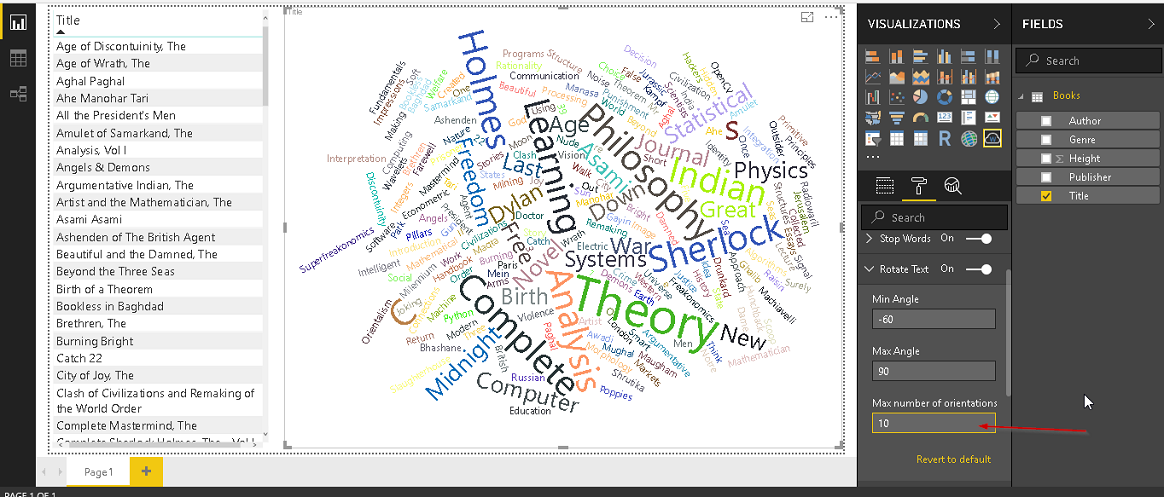
Rotation: we can specify the min and max angle of rotation along with Max number of rotations.
Go to the format section and Rotate Test. Change the desired property and observe the change in the Word cluster visual

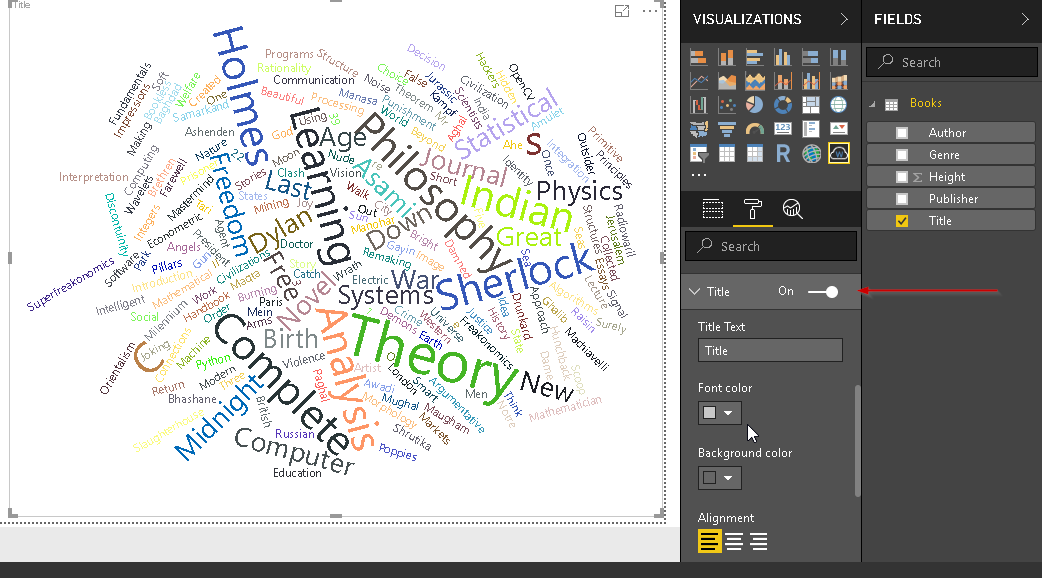
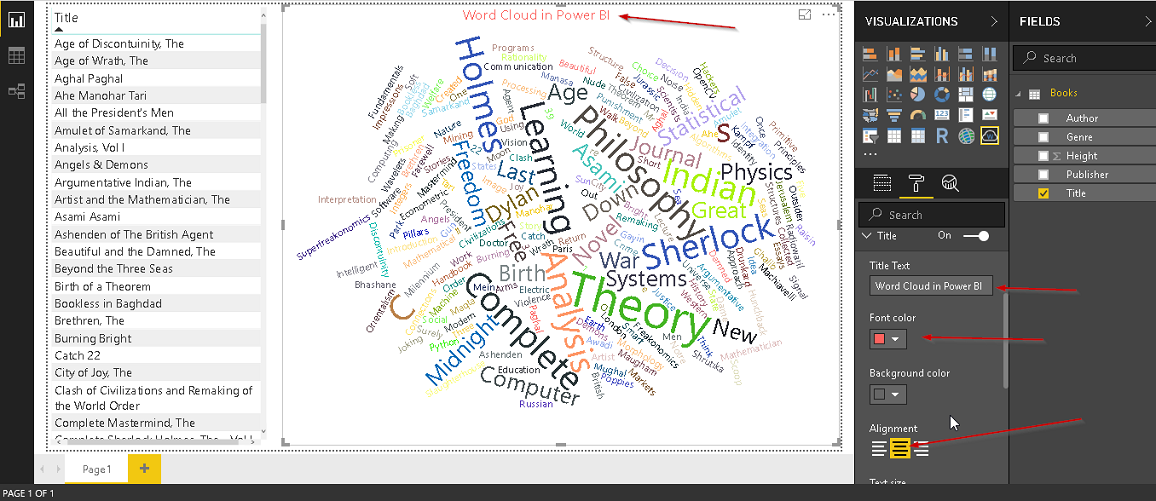
Title: We can set the title of the Word cluster visual from the format ->Title section. If we do not want the title, turn it off.
Specify the title, font colour, size, alignment and we can see that in the Word cluster visual
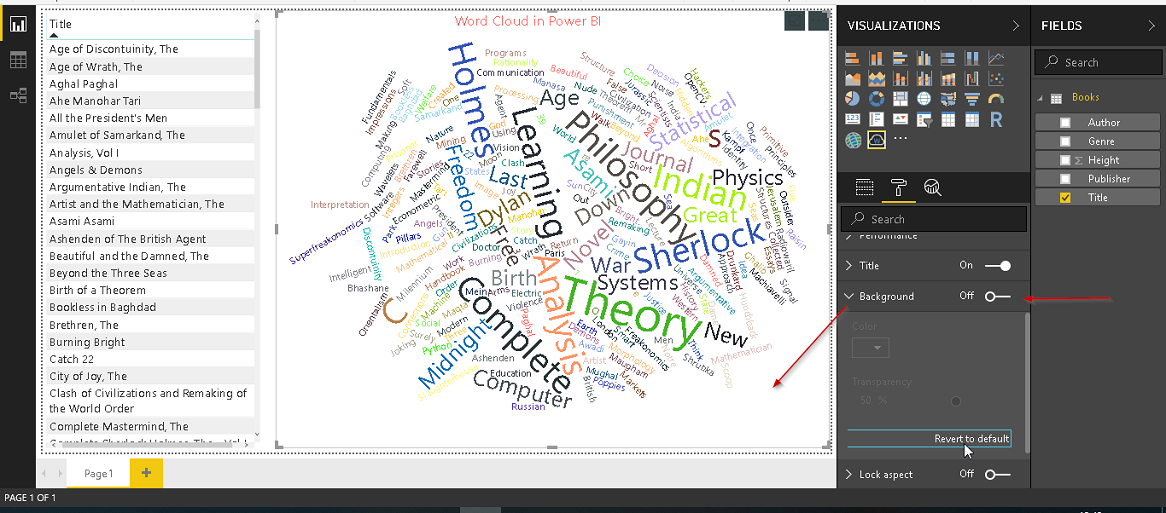
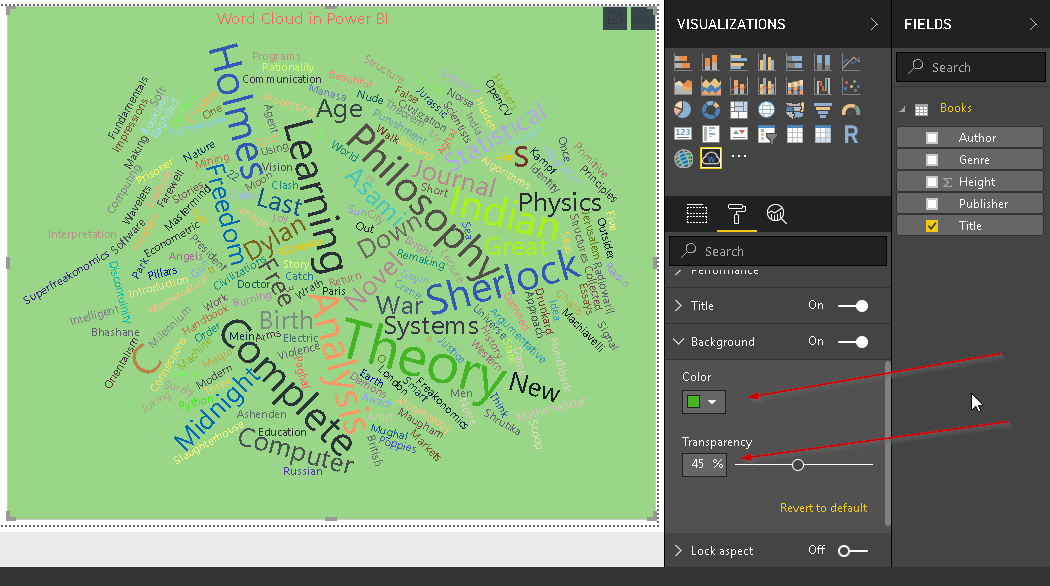
Background: we can change the background color of the Word cluster visual using this property. Go to Background in the format section
Turn it on and select the background color and transparency level
Conclusion
Word Cloud Generator in Power BI offers an interactive method to do the analysis for frequently used words, text with customization. In this article, we reviewed how to create a Word cloud generator with Power BI Desktop. Explore these techniques with your own data sets and enjoy clouding!
Table of contents

I am the author of the book "DP-300 Administering Relational Database on Microsoft Azure". I published more than 650 technical articles on MSSQLTips, SQLShack, Quest, CodingSight, and SeveralNines.
I am the creator of one of the biggest free online collections of articles on a single topic, with his 50-part series on SQL Server Always On Availability Groups.
Based on my contribution to the SQL Server community, I have been recognized as the prestigious Best Author of the Year continuously in 2019, 2020, and 2021 (2nd Rank) at SQLShack and the MSSQLTIPS champions award in 2020.
Personal Blog: https://www.dbblogger.com
I am always interested in new challenges so if you need consulting help, reach me at rajendra.gupta16@gmail.com
View all posts by Rajendra Gupta
- Understanding PostgreSQL SUBSTRING function - September 21, 2024
- How to install PostgreSQL on Ubuntu - July 13, 2023
- How to use the CROSSTAB function in PostgreSQL - February 17, 2023