
Over the past three years, I read some interesting news about Microsoft which was “Microsoft acquires mobile business intelligence leader Datazen”. This news made me excited because showing Reporting Service reports in mobile devices can be painful and often not effective for end users. After this acquisition, Microsoft developers worked quickly to adapt the Datazen application to SQL Server Reporting Services and this effort culminated in Microsoft SQL Server Mobile Report Publisher.
Microsoft SQL Server Mobile Report Publisher is a report design tool which allows us to create mobile reports and publish them to SQL Server Reporting Services. We can use these reports on mobile devices very easily. In this article, we are going to explore how to create a mobile dashboard with SQL Server Mobile Report Publisher and publish this mobile report to SQL Server Reporting Services.
Before starting the demonstration, I want to add some additional notes about report design. Microsoft recommends two report design approaches;
- Design First
- Data First
Design First: In this approach, we will create the report design without any data. If your BI department has formed design and data development teams, you can use this approach; because the report designer does not need to wait for dataset creation.
Data First: In this approach, we will populate all required data to mobile report and then design to report. The advantage of this approach is we can design all elements with real data. But if you ask my work approach, first of all, I would create a draft Excel file which includes all columns name with some sample data and develops the report design with this Excel file. And then I will discuss the report with the owner (customer) over this report prototype. Finally, I will make the changing to the report and connect to real time data.
Demonstration
Creating data source and dataset
In the first step of this demonstration; we will create a data source and dataset in SSRS.
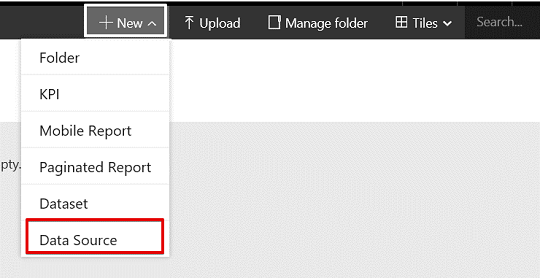
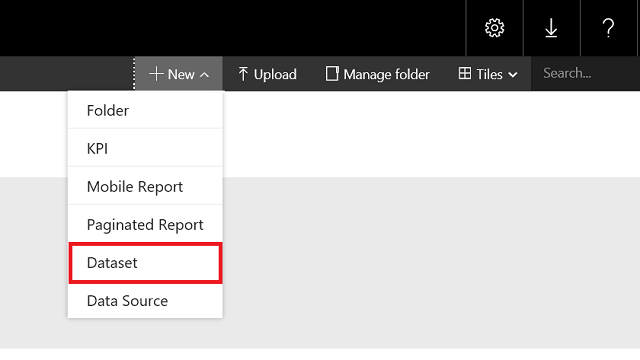
Open the Reporting Services web portal. Click the New button and select Data Source.
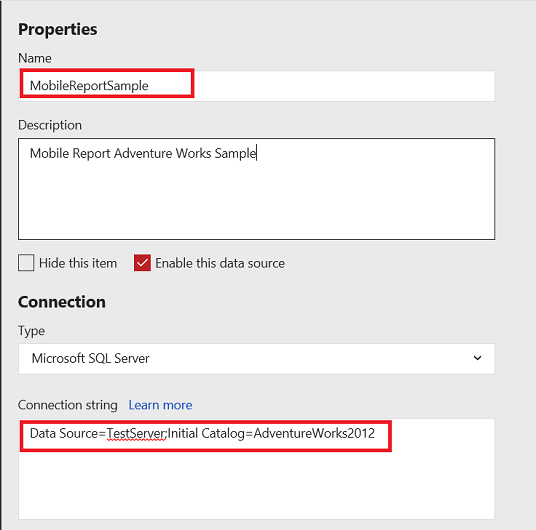
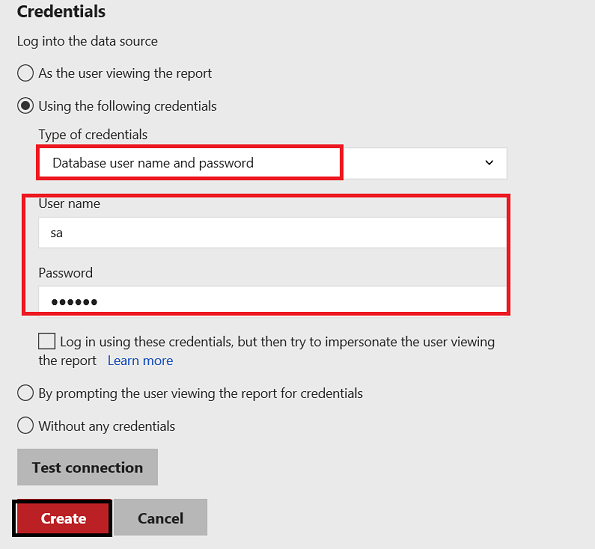
We will give a name (MobileReportSample) to our data source and then we will fill the required fields for connection strings. In this settings page; we will select a connection type and set the credentials of connection.
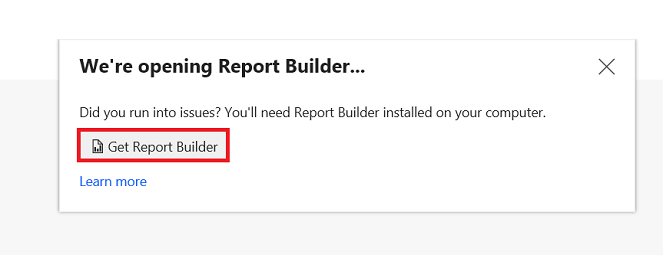
Now, we will create a data source for our mobile report. Click New and then select DataSet. If the Microsoft SQL Server Report Builder is installed your computer, it will automatically be opened. If you have not installed the Report Builder you can click Get Report Builder link and download Report Builder.
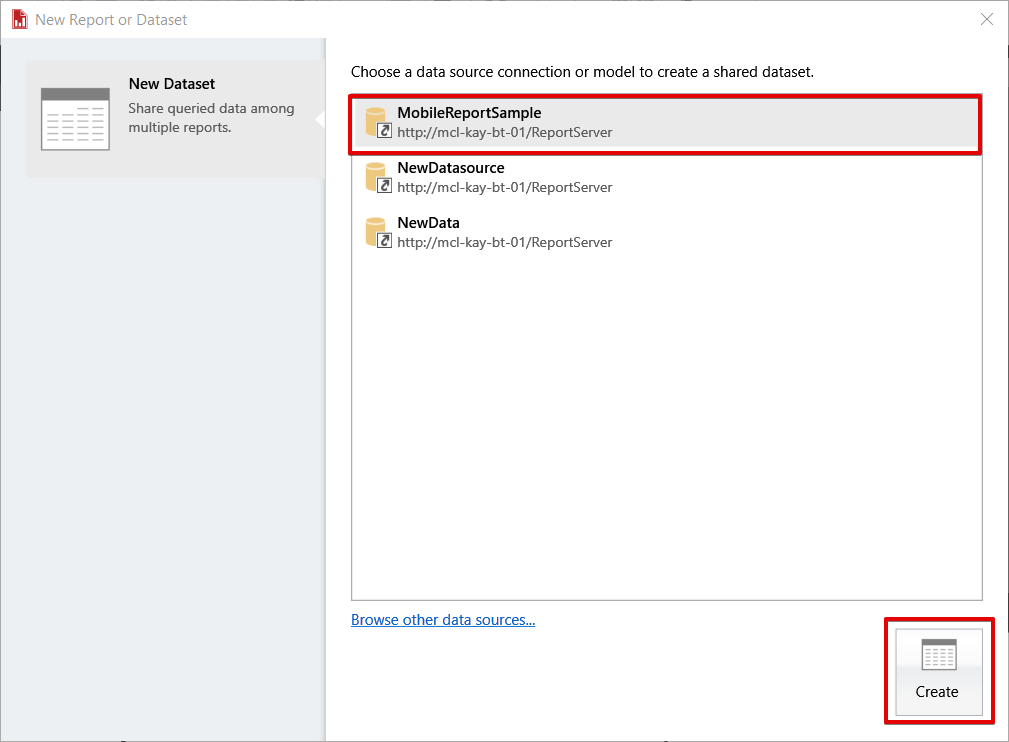
Select the MobileReportSample dataset which was created in the previous step and clicks Create.
Tip: This script will generate a sample data for mobile report. This data simulates territory sales which are made by salesperson. We will use this data in our mobile dashboard graphics.
|
1 2 3 4 5 6 7 8 9 10 11 12 13 14 15 16 17 18 |
DROPTABLEIFEXISTS DemoForMobileReport CREATETABLE DemoForMobileReport (Id INTPRIMARYKEYIDENTITY(1,1), Dt DATE, SalesPerson VARCHAR(200), SalesAmnt FLOAT, TargetSaleAmnt FLOAT, ContOfSale VARCHAR(200), ContOfCountry VARCHAR(200)) INSERTINTO DemoForMobileReport values ('20180112',' Charles','7985.80','7137','Europe','Norway'), ('20180208','Steven','3133.34','3565','Europe','Turkey'), ('20180311','Michael','2158.64','2500','Asia','Japan'), ('20180318','George','11332.86','14300','Europe','Germany'), ('20180402','Jonny','938.98','1200','Africa','Tunisia'), ('20180322','Jonny','807','3000','Oceania','New Zeland') |
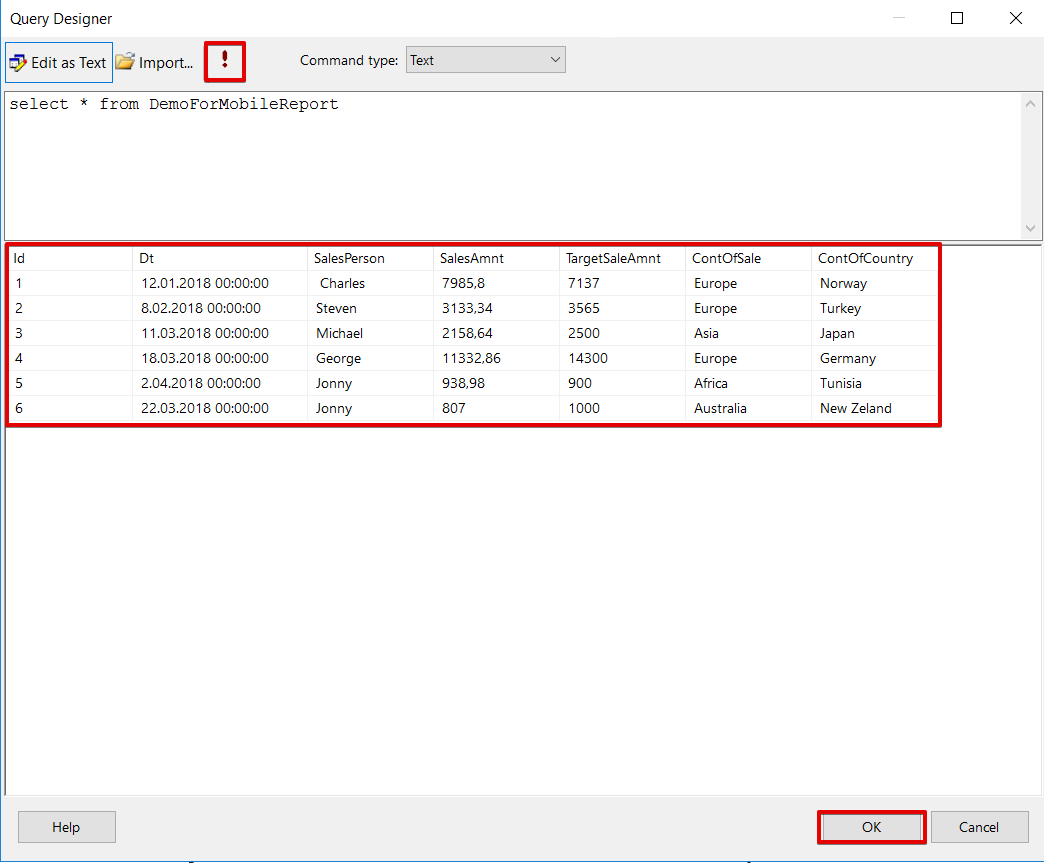
Click Edit as Text and copy/paste the following query.
|
1 |
SELECT*FROM DemoForMobileReport |

Click (!) exclamation mark and populate data. Click save button and save the dataset to report server.
Designing mobile dashboard
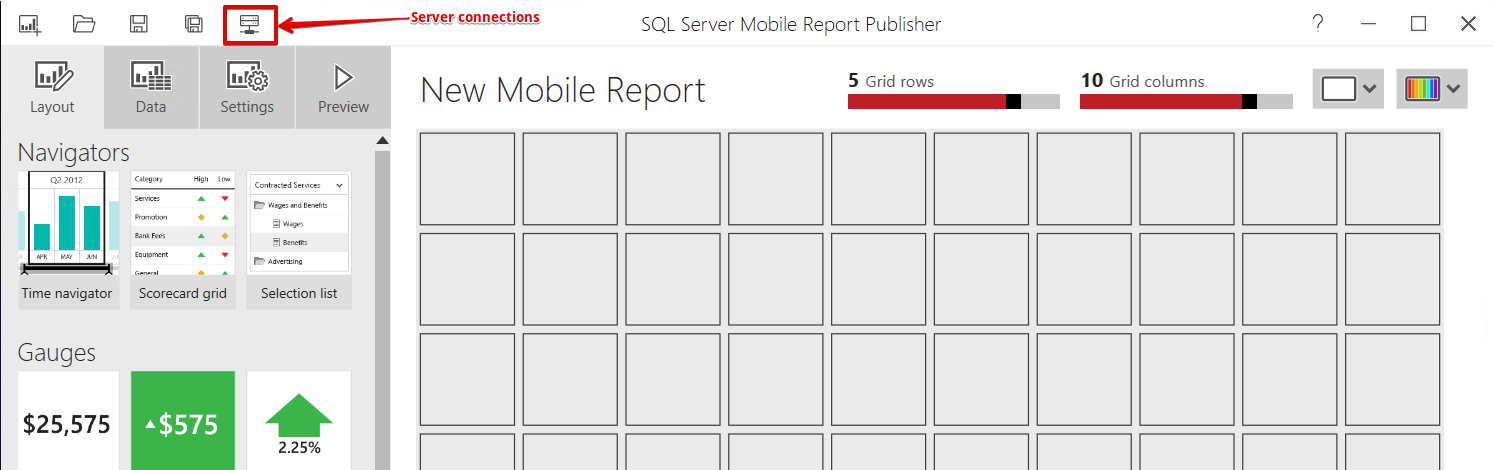
Launch the Microsoft SQL Server Mobile Report Publisher. In the first step we will create data connections between SSRS and mobile report.
Click Server connections in top of the panel.
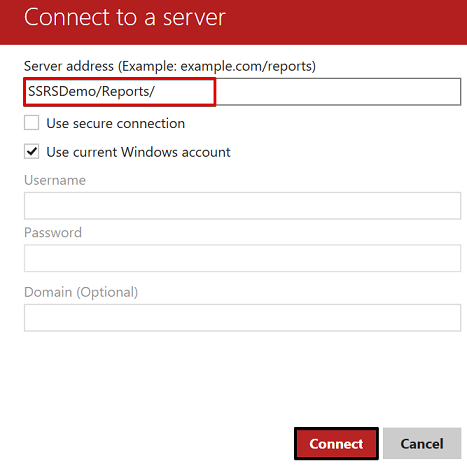
Fill the required fields with the SSRS web portal URL and credentials. Click Connect.
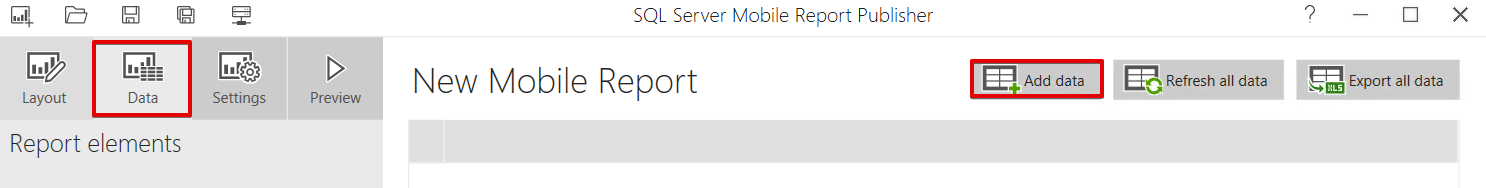
Select Data tab and click Add data
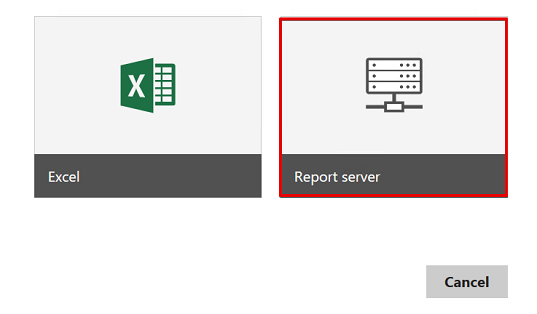
Select Report server …
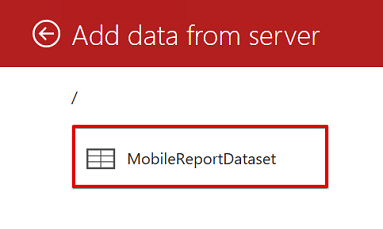
Select the data set …
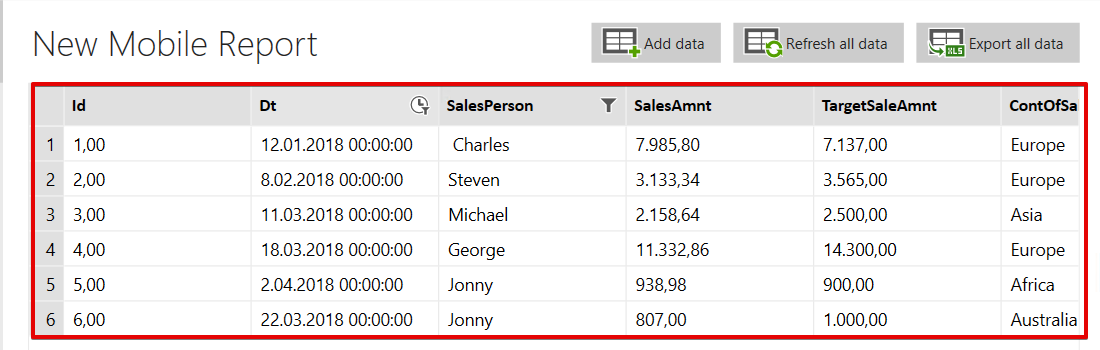
Data will populate the mobile report screen …
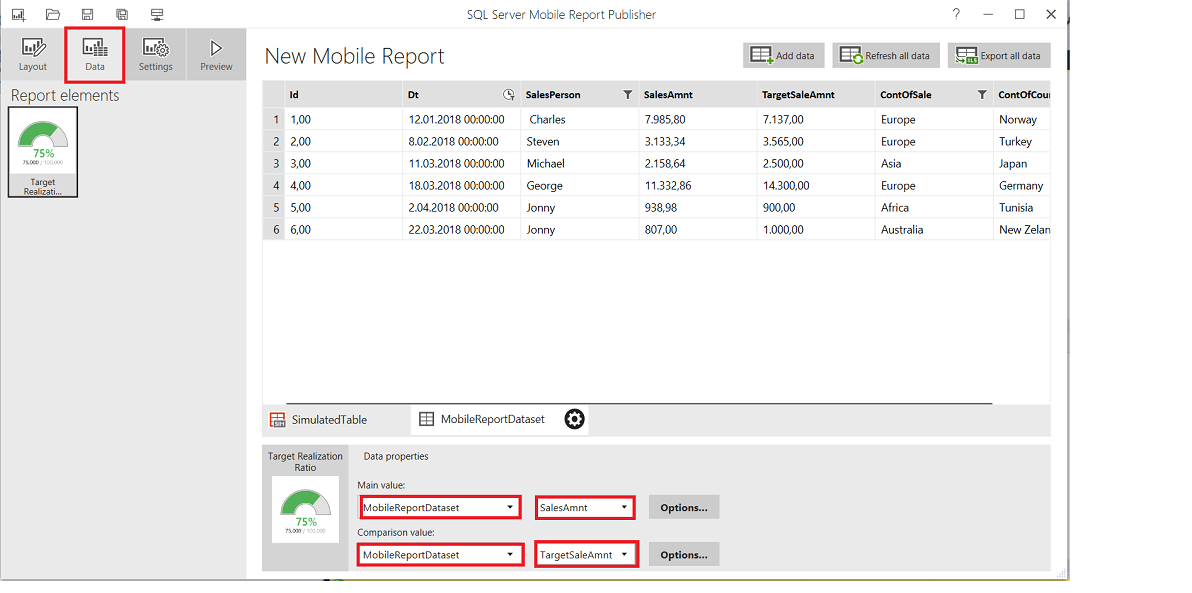
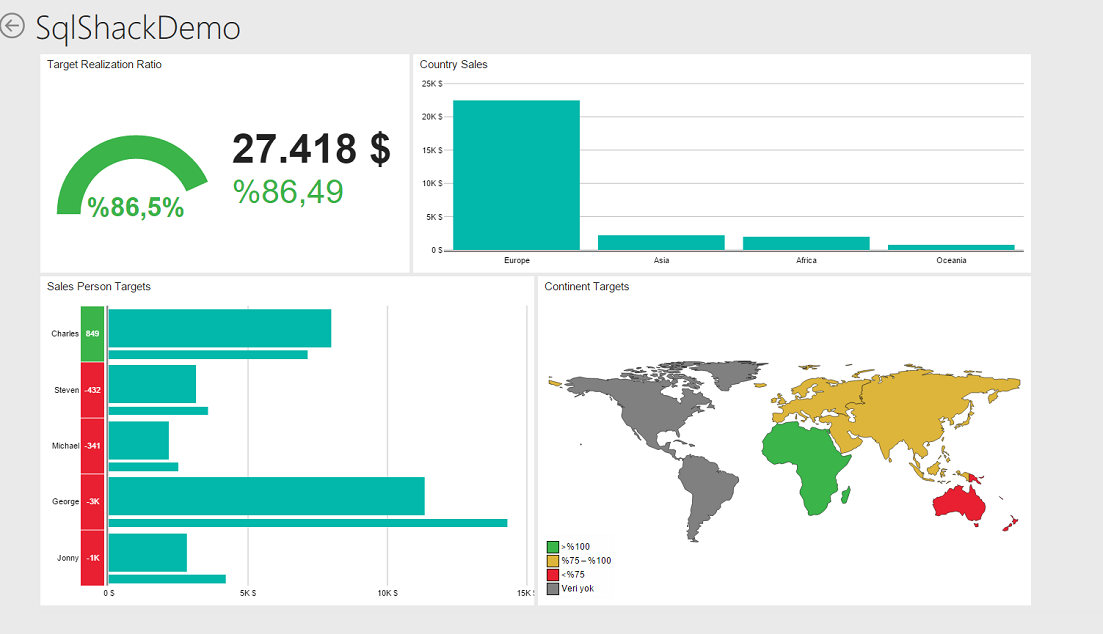
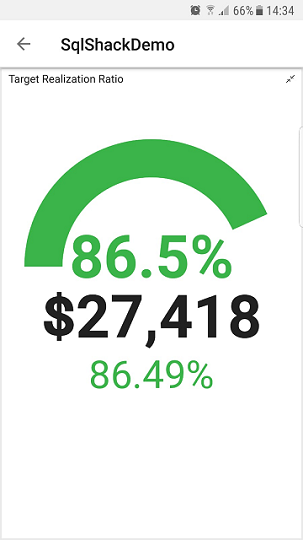
In our mobile report design; first, we will add Half-donut gauge. The purpose of this gauge is to compare SalesAmnt field and TargetSaleAmnt field so we will show target realization ratio.
Add the Half-donut component to design layout and change title as “target realization ratio”
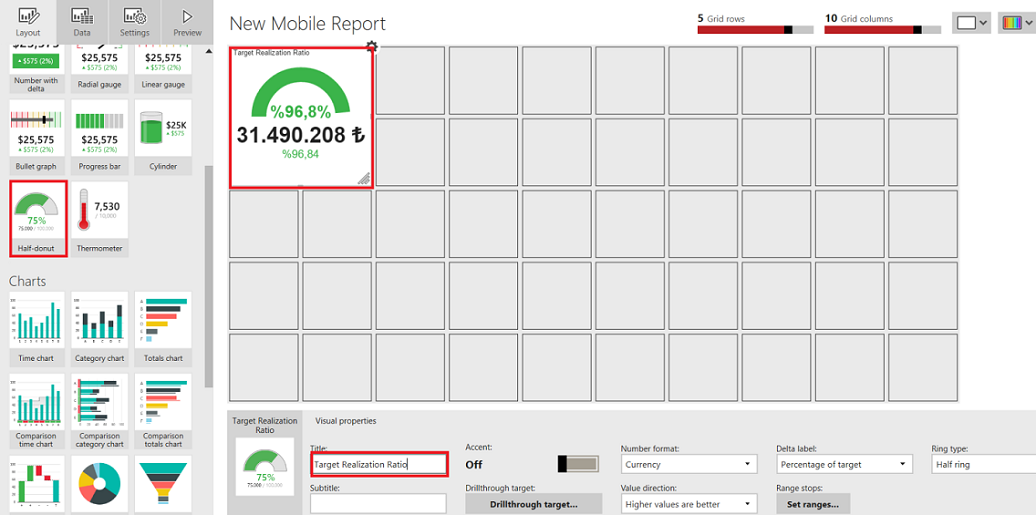
Click the Data tab and change the data properties …
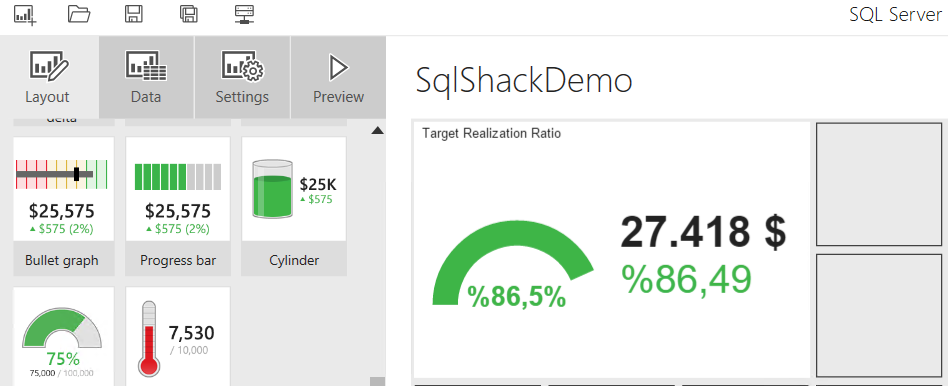
The last layout of Half-donut will like this …
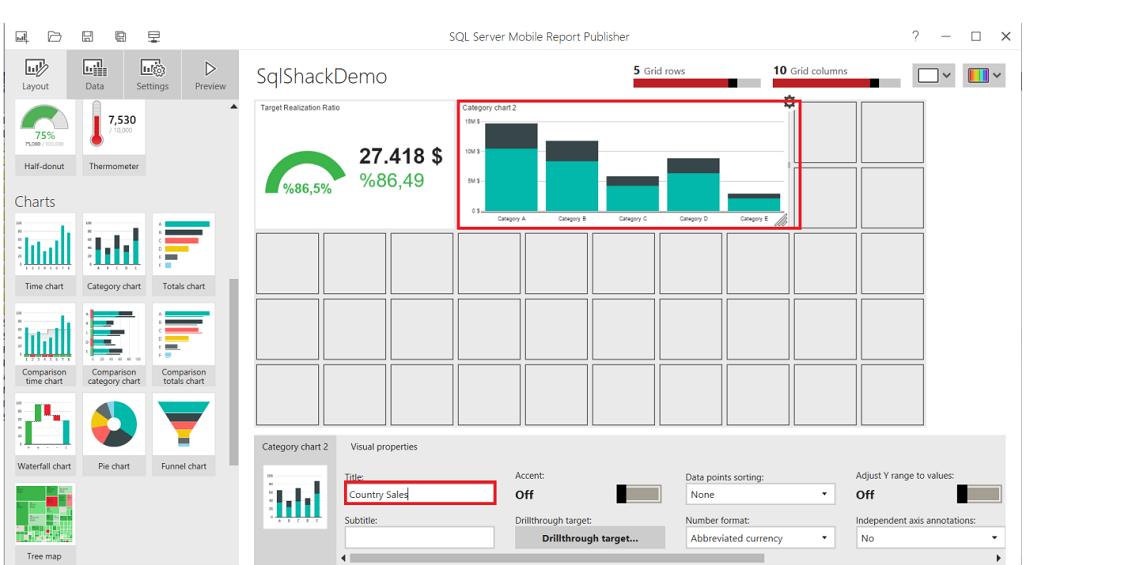
The second component will be a category chart in our mobile report design. This chart will help us to show country sales comparison.
Add a Category-chart component to the design layout and change the title to Country Sales.
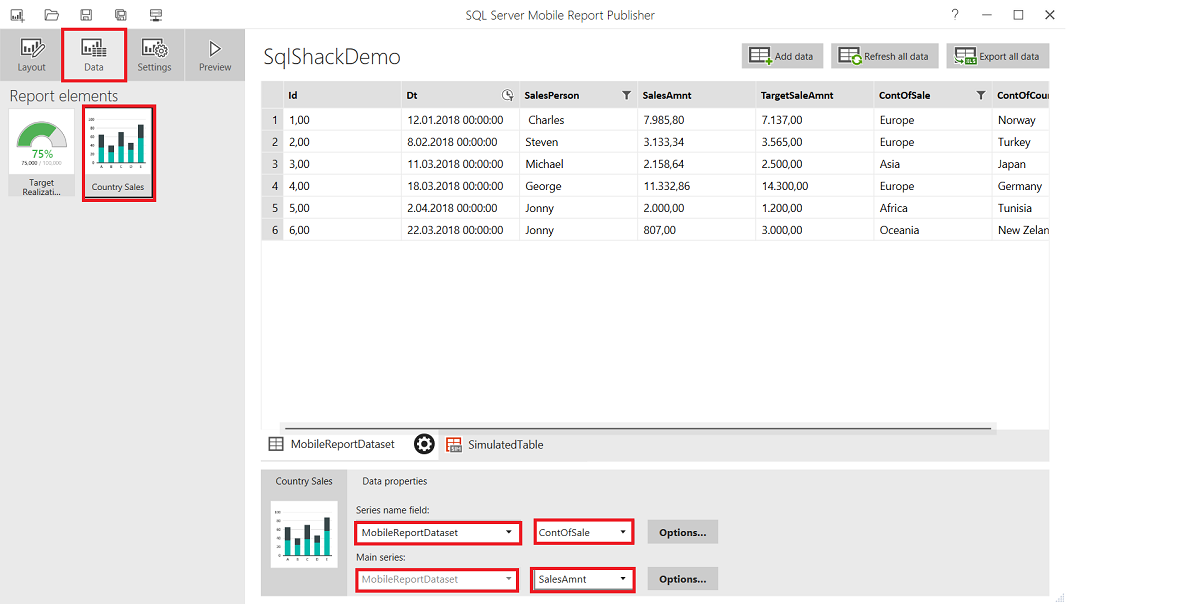
Click the Data tab and change the data properties of the Category Chart.
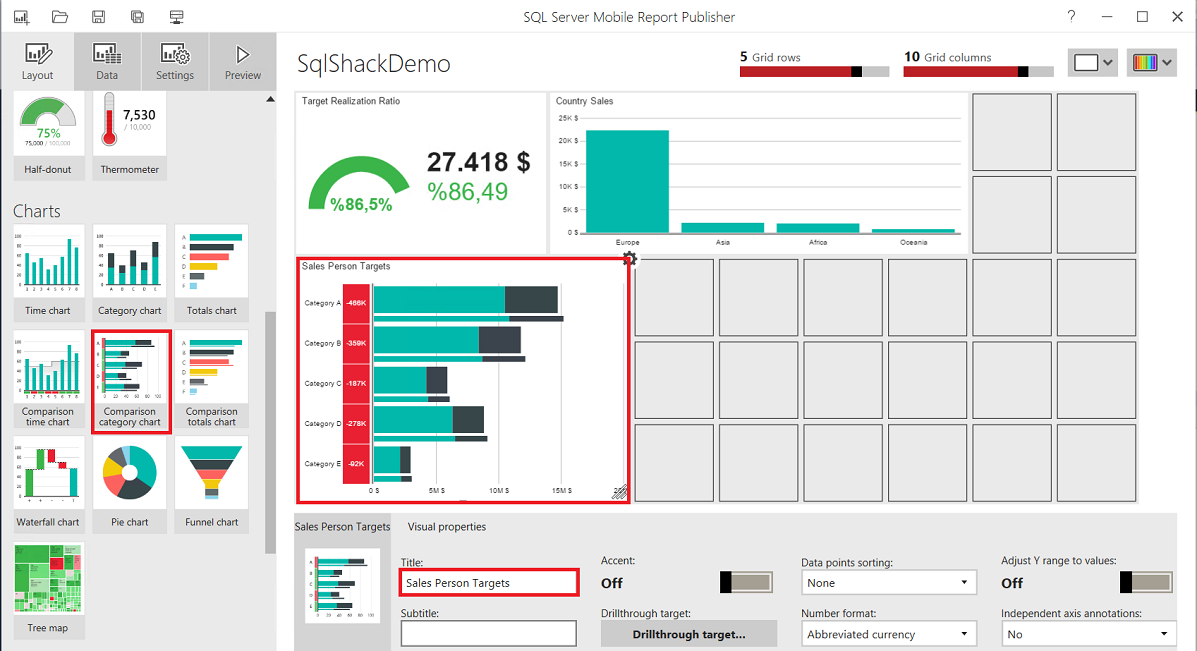
We will add Comparison totals chart in our mobile report design. This chart will help us to show salesperson target realizations.
Add the Comparison category chart to design layout and change title to Sales Person Targets.
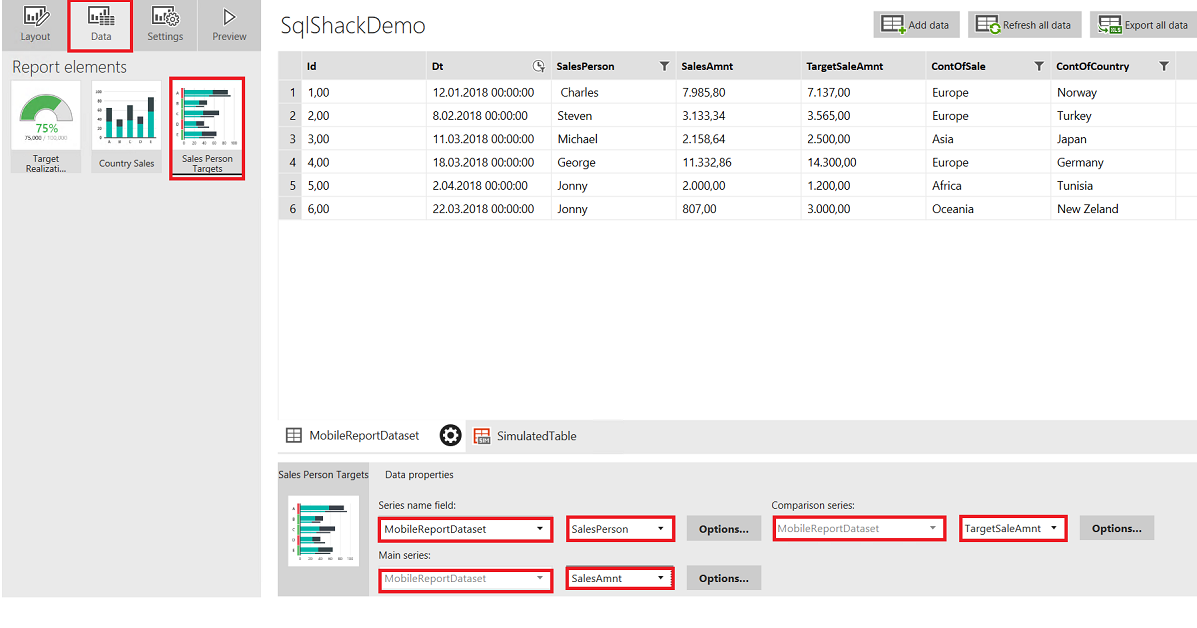
Click the Data tab and change the data properties …
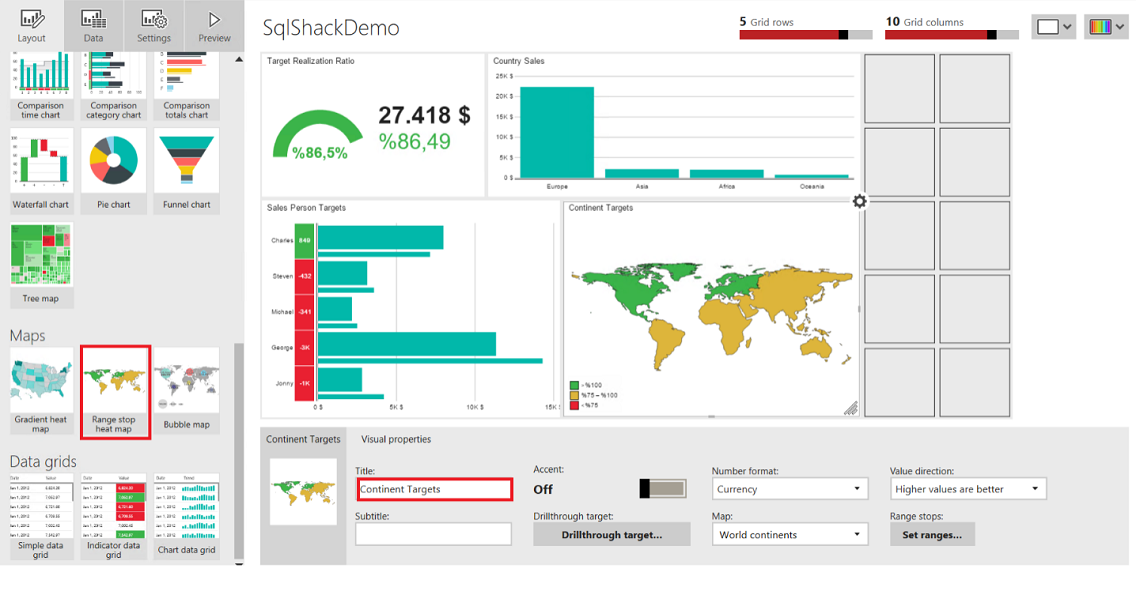
And the final component is Range stop heat map. The aim of this chart is to show the target realization rate by continent.
Add the Range stop heat map to design layout and change title to Continent Targets.
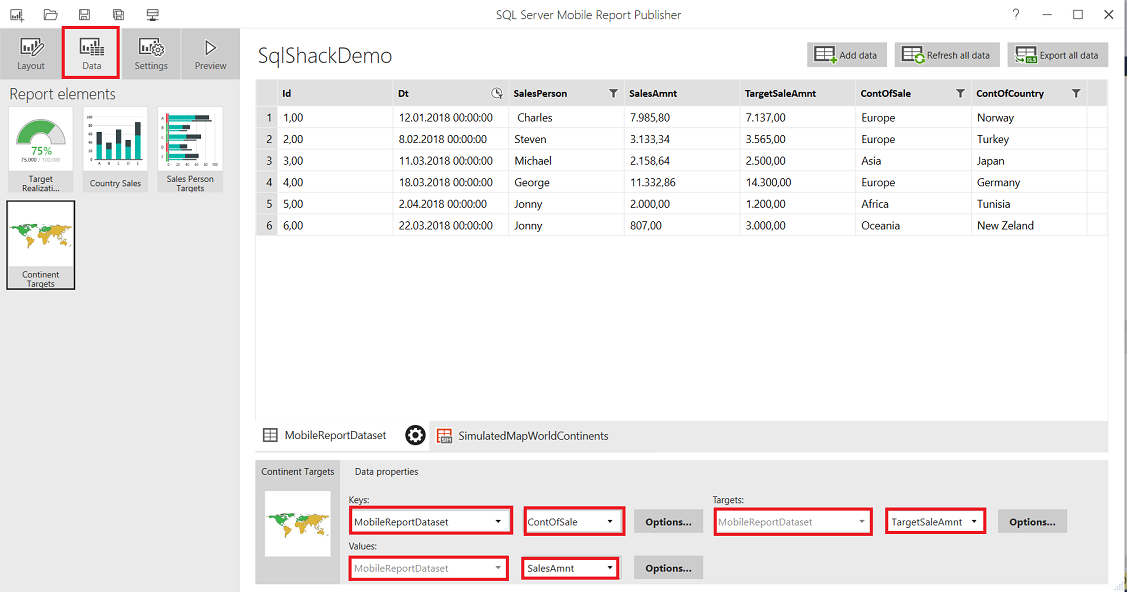
Click Data tab and change the data properties of Range stop heat map …
Click the Preview button …
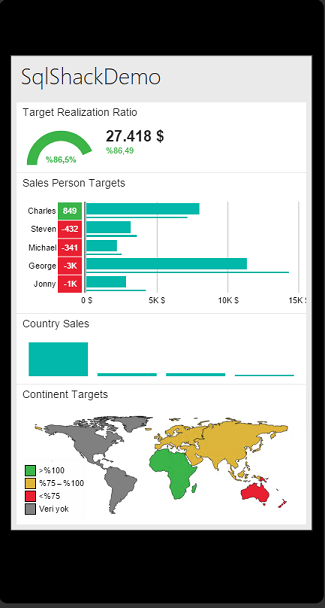
In this step; we will create our design for mobile devices.
Change the design layout for Phone and arrange the report elements like this. And click the Preview button.

The final design of our dashboard will look like the bellow image …
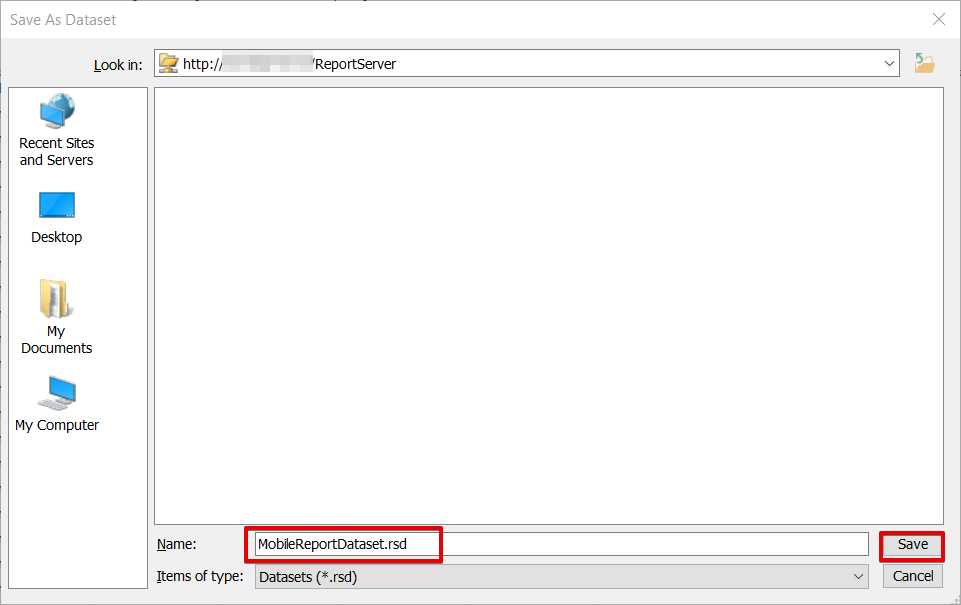
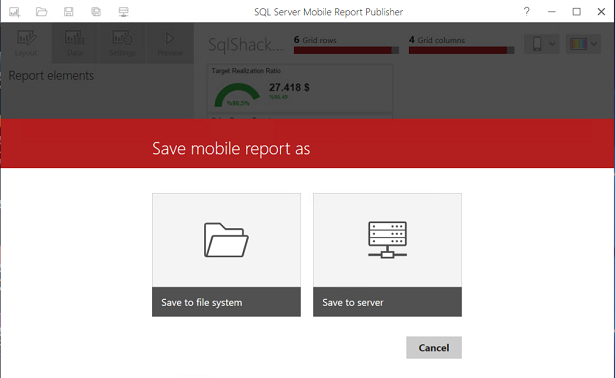
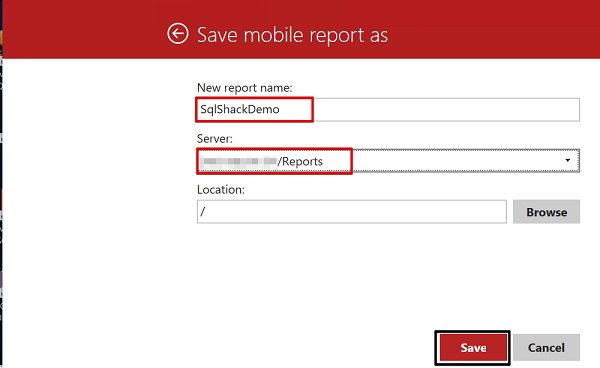
We will click the double floppy disk icon and save it to SSRS web portal …
Mobile dashboard
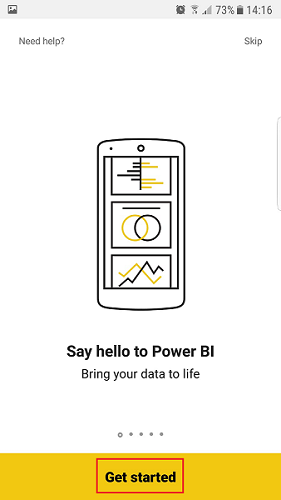
In this section of article, we will focus on settings of mobile reports in a mobile device. As we mentioned at the beginning of the article; you will find the Power BI mobile app in mobile marketplaces. The following settings cover Android devices after the installation of Power BI – Business data analytics.
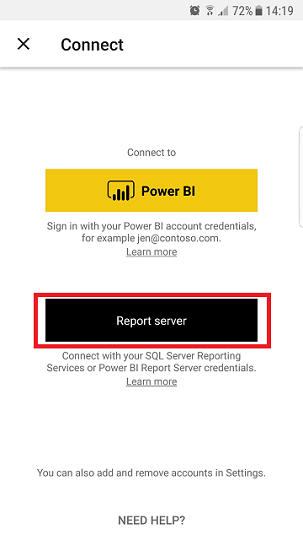
Click Get started and select Report Server in your mobile device.

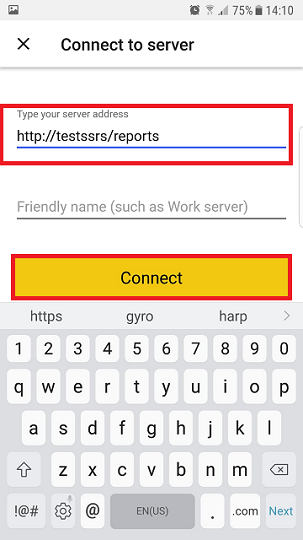
Connect to the server …
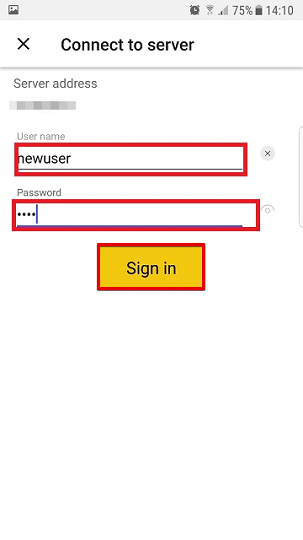
Fill the credentials for the report server. Click the Sign In button.
Click Start Exploring and open the SqlShackDemo dashboard. Finally, our mobile dashboard appears on screen.
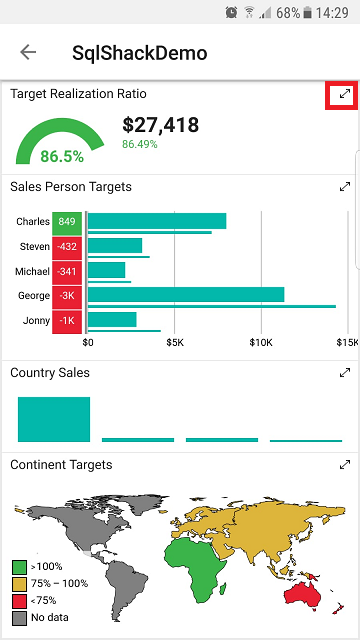
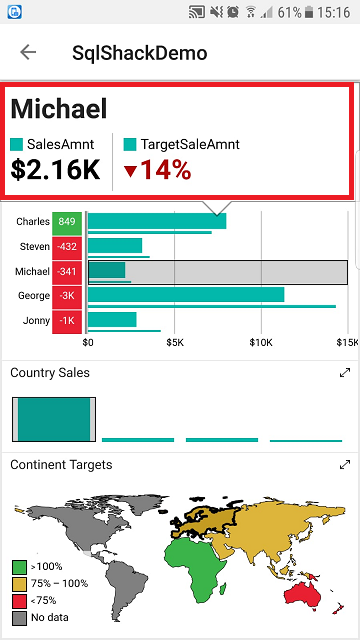
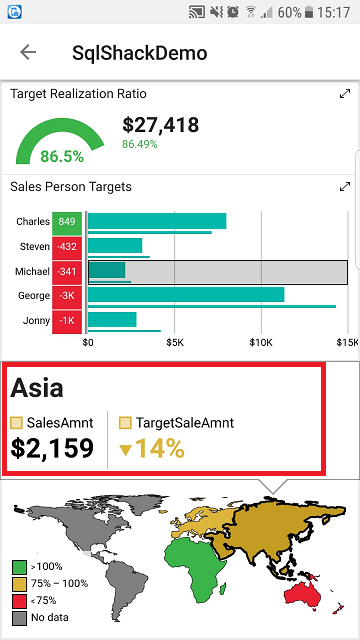
When you click both side arrow; the report element appears in full screen.
When you click the bars or regions; you can get details about this part of the graphic.
Summary
In this article, we created a very basic mobile dashboard in SQL Server Microsoft Mobile Publisher from end to end. SQL Server Microsoft Mobile Publisher has various, powerful capabilities. With this technology, we can create mobile reports parameters or navigators for mobile reports. In the mobile device, you can refresh report real-time.
In some cases, this real-time refresh can cause performance problems. If you think you will face this type of issue in your production environment you can create caching plans for data sources in SSSR web portal. On the other hand, you can analyze your KPI (key performance indicators) in the mobile app.
But otherwise, happy report building for mobile devices!

Most of his career has been focused on SQL Server Database Administration and Development. His current interests are in database administration and Business Intelligence. You can find him on LinkedIn.
View all posts by Esat Erkec
- SQL Performance Tuning tips for newbies - April 15, 2024
- SQL Unit Testing reference guide for beginners - August 11, 2023
- SQL Cheat Sheet for Newbies - February 21, 2023