
The concept of the IOT (Internet of Things) is that every object that you might think of is somehow accessed and connected to other devices on the internet. Nowadays every electronic device is now becoming smart and these devices are now able to communicate with each other. Many ideas and technology on IOT are being developed and are even being used today.
With the help of IOT, it is possible to collect and analyze automatically which part of a city is concentrated, where people spend more time and in which area, how much time a person spends on average in a shopping mall and so on. In this way, a statistical institution can now obtain any statistical information about larger masses more easily without conducting a survey.
With the improvement of IOT apps and sensors, real-time data visualization is the main requirement for a lot of scenarios. Assume that you are working for a production company and you want to track production line speed or you want to track quality ratio on time. Because, if some problem occurs in the production line, you have to handle this issue immediately. For this reason, we need to real-time data visualization.
Power BI has a real-time data visualization capability. In other words, we push streaming dataset to Power BI and Power BI updates dashboards in real time. Primarily, we will examine what is streaming dataset.
Streaming dataset
We can define streaming dataset as it is continuously and real-time data which transport to Power BI. Power BI stores this data in temporary cache for a little time. The streaming dataset can visualize data in dashboard tiles (A tile is a snapshot of your data, pinned to the dashboard).
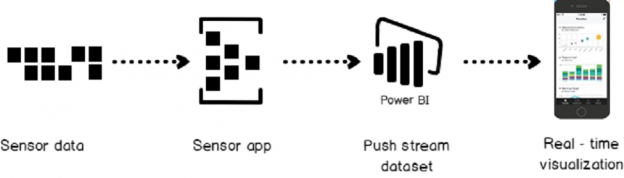
Now, we will create a demonstration of real-time data visualization in Power BI. The below architecture diagram can describe the main framework of our demonstration. According to this the diagram as you can see data flow is only one way. Sensor App pushes data to Power BI over an end-point. This end-point define as Push URL by Power BI.
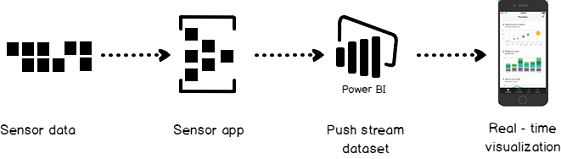
When we analyze the architecture diagram, it includes 3 steps;
- Sensor collects the data
- Sensor App captures sensor data and pushes this data to Power BI
- Power BI handle this data create and update the dashboard information
Demo:
Creating a new streaming dataset
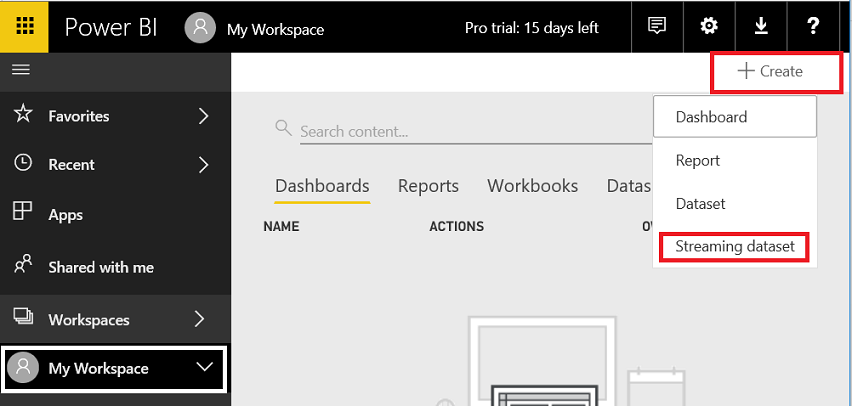
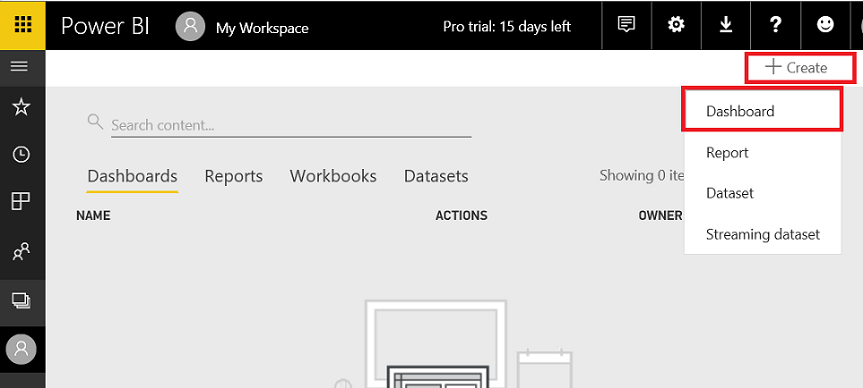
We will sign into Power BI portal and then select a workspace and click (+) create a link. We will select Streaming dataset.
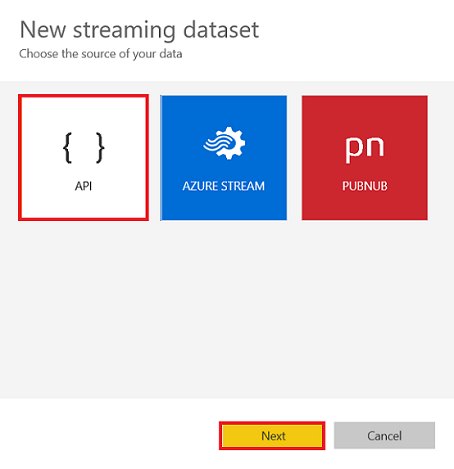
On this page, we will select API and then click Next.
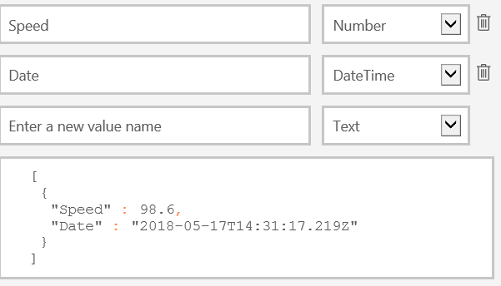
In this page, we will make some definition about our stream dataset. We will describe the structure of stream dataset and will define the data type of fields, which will be in JSON format. We will define a very simple dataset. This stream dataset only includes speed and date.
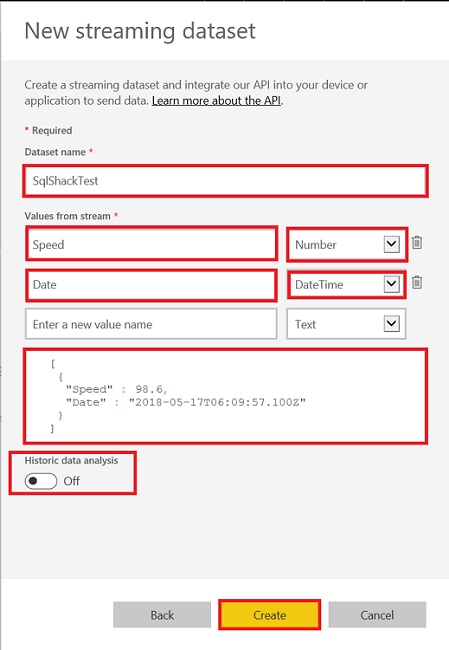
At the bottom of the page, you will see a Historic Data Analysis option. When this option is disabled it means streaming dataset stores in a temporary cache for a little time. But when we enable this option this data will start to store. But it has some limitations to post rows, including:
- 75 max columns can post
- 75 max tables can post
- 200,000 max rows stored per table
- 1,000,000 rows added per hour per dataset
- And 4,000 characters per value for string column
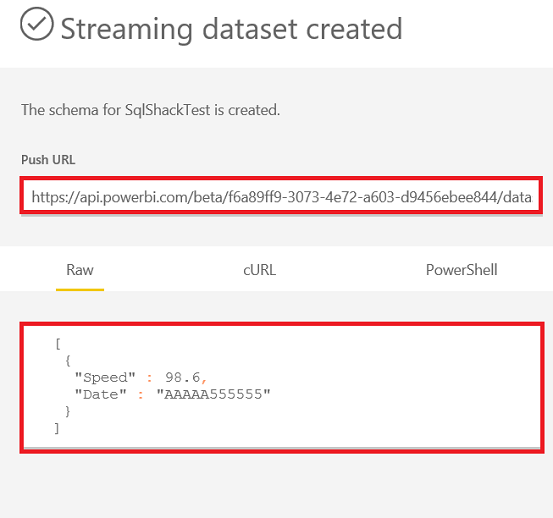
When we click Create button, Power BI generates Push URL. We will use this URL to push stream dataset.
At this point, we will look again at the architecture diagram and explain details of Sensor app functions.
- Sensor app will convert sensor data to JSON format
- Sensor app will send data to Power BI over push data URL
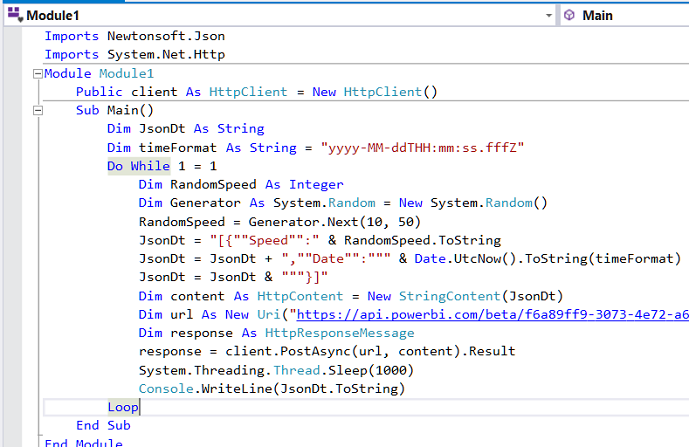
- Now, we will create a synthetic sensor app with VB.net.This app creates random speed values and sends to Power BI push data URL.
-
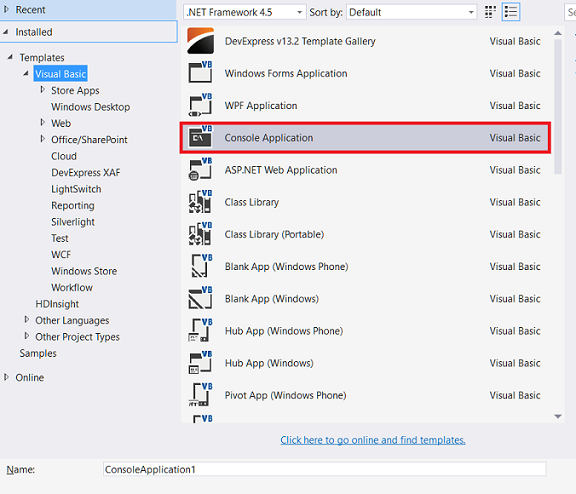
Open console application in Visual Studio

-
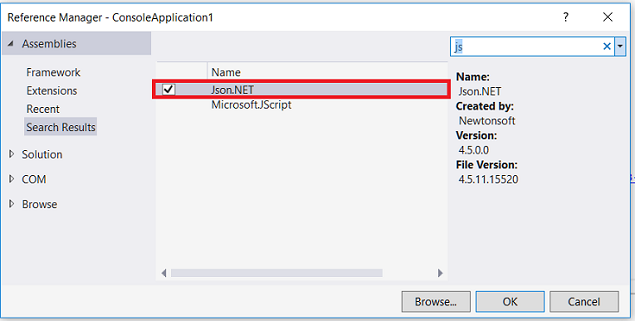
Add Json.NET and System.Net.Http references.
-
Paste this small dummy code to visual studio code pane
123456789101112131415161718192021222324Imports Newtonsoft.JsonImports System.Net.HttpModule Module1Public client As HttpClient = New HttpClient()Sub Main()Dim JsonDt As StringDim timeFormat As String = "yyyy-MM-ddTHH:mm:ss.fffZ"Do While 1 = 1Dim RandomSpeed As IntegerDim Generator As System.Random = New System.Random()RandomSpeed = Generator.Next(10, 50)JsonDt = "[{""Speed"":" & RandomSpeed.ToStringJsonDt = JsonDt + ",""Date"":""" & Date.UtcNow().ToString(timeFormat)JsonDt = JsonDt & """}]"Dim content As HttpContent = New StringContent(JsonDt)Dim url As New Uri("https://api.powerbi.com/beta/f6a89ff9-3073-4e72-a603-d9456ebee844/datasets/9d8b59be-0c77-4486-aed3-xxxxx/rows?key=xxxxx_yourkey_xxxx ")Dim response As HttpResponseMessageresponse = client.PostAsync(url, content).ResultSystem.Threading.Thread.Sleep(1000)Console.WriteLine(JsonDt.ToString)LoopEnd SubEnd Module
-
Run console application
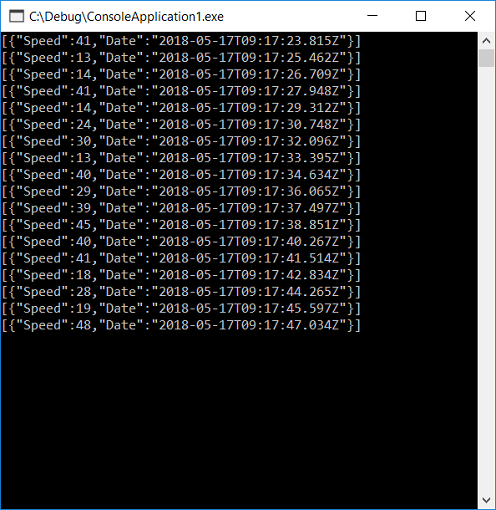
This code generates random speed data and pushes to Power BI over push URL. If you look at the structure of data which created by console application is the same as the Power BI JSON template.
|
1 2 3 4 5 6 |
[ { "Speed":18, "Date":"2018-05-17T09:15:02.565Z" } ] |
Create dashboard
After completing these steps, we can start to develop the dashboard. In this dashboard, we will create gauge which shows to speed and will create line chart which visualizes speed and date interaction.
We will click (+) Create and chose dashboard.
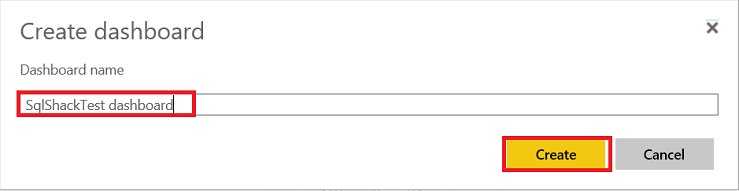
We will define dashboard name and click Create
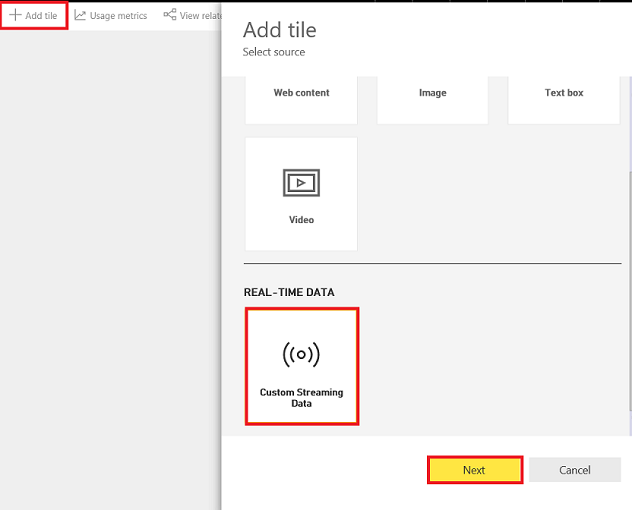
We will click + Add tile and then select REAL-TIME DATA (Custom Streaming Data), click Next
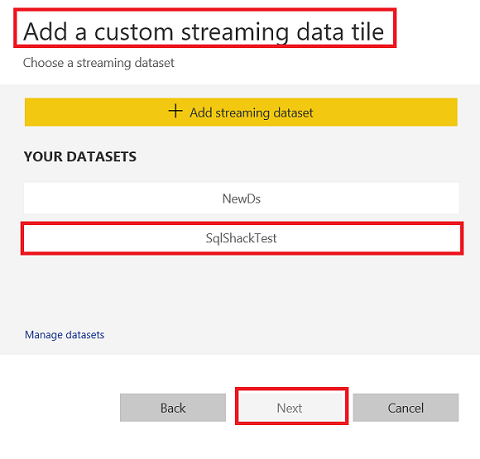
In this Add a custom streaming data tile page, we will choose our streaming dataset which we created at the beginning of demo and then click Next.
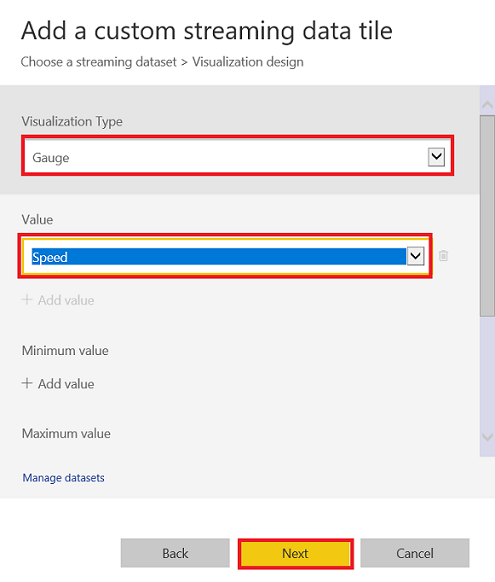
In this page, we will choose our dashboard component. In the first step, we will add Gauge. We will set speed value to value field. We will click Next.
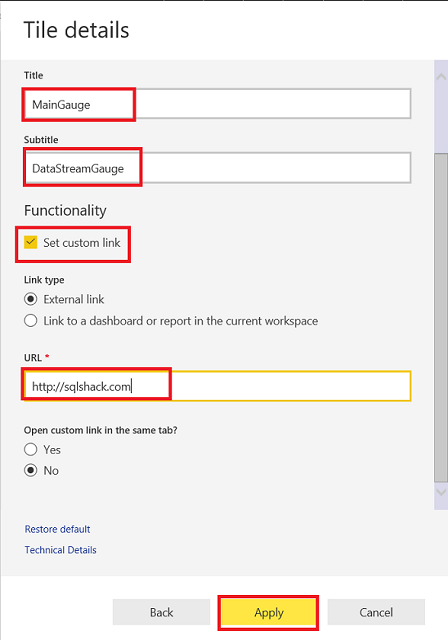
In Tile details page we will set the gauge Title and Subtitle. At the same time, we can enable Set Custom Link. This option is offered when we click gauge so it can redirect any link. We will click Apply.
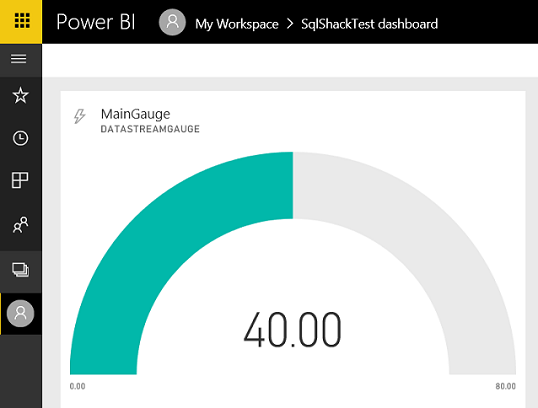
Finally, our gauge is ready.
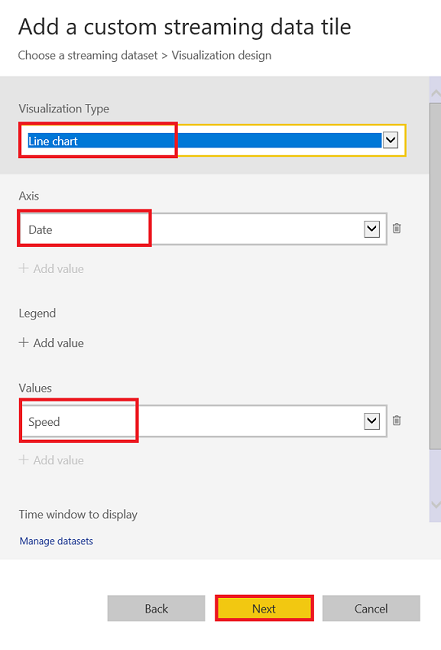
Now, we will add line chart. In Add a custom streaming data tile page chose Line chart. In the Axis field select Date field and in the Values field select speed.
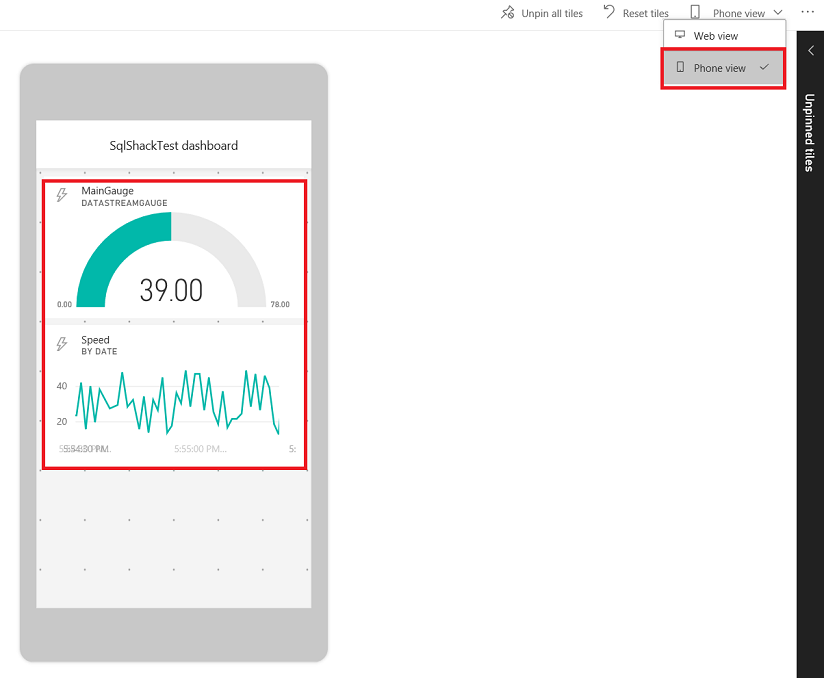
In this step, we will select Phone view and we can see the suitable phone view.
Conclusions
In this article, we discussed real-time data virtualization in Power BI. In fact, this feature is very powerful feature for Power BI because it allows us to connect and track IOT sensors values in web or mobile, especially to visualize sensor data in real-time via mobile devices.. In short, real-time streaming in Power BI is very useful and productive for users and this feature, combined with a cloud-based architecture, allows us unlimited accessibility.
References
- Power BI RESET API limitations
- Push data to Power BI streaming datasets without writing any code using Microsoft Flow
- Push data into a Power BI dataset
- Real – time streaming in Power BI

Most of his career has been focused on SQL Server Database Administration and Development. His current interests are in database administration and Business Intelligence. You can find him on LinkedIn.
View all posts by Esat Erkec
- SQL Performance Tuning tips for newbies - April 15, 2024
- SQL Unit Testing reference guide for beginners - August 11, 2023
- SQL Cheat Sheet for Newbies - February 21, 2023