

Prediction, is it a new thing for you? You won’t believe you are predicting from the bed to the office and to back to the bed. Just imagine, you have a meeting at 9 AM at the office. If you are using public transport, you need to predict at what time you have to leave so that you can reach the office for the meeting on time. Time may vary by considering the time and the day of the week, and the traffic condition etc. Before you leave your home, you might predict whether it will rain today and you might want to take an umbrella or necessary clothes with you. If you are using your vehicle then the prediction time would be different. If so, you don’t need to worry about the rain but you need to consider the fuel level you need to have to reach to the office. By looking at this simple example, you will understand how critical it is to predict and you understand that all these predictions are done with your experience but not by any scientific method.
The next question would be how to implement any data mining solution in a real-world scenario. Well, you might have heard of the famous story of Beer-Nappy at the popular supermarket chain. That is just a simple example of data mining implementation. So let’s see how we define data mining.
What is Data Mining?
There are several definitions for data mining with respect to business as well as for academics. Data mining is a practice that will automatically search a large volume of data to discover behaviors, patterns, and trends that are not possible with the simple analysis. Data Mining should allow businesses to make proactive, knowledge-driven decisions that will make the place better ahead of their competitors.
Data warehouse, from its mandate to store a large volume of data including the last years of data. The data warehouse is used for descriptive analysis (What happened) and diagnostic analysis (Why it happened). However, business needs to do analysis beyond that. Data mining can be utilized for Predictive Analysis (What will happen) and Prescriptive Analysis (How can we make it happen).
Data Mining in SQL Server
SQL Server is mainly used as a storage tool in many organizations. However, with the increase of many businesses’ needs people are looking to different features of SQL Server. People are looking at data warehousing with SQL Server. SQL Server is providing a Data Mining platform which can be utilized for the prediction of data.
There are a few tasks used to solve business problems. Those tasks are Classify, Estimate, Cluster, forecast, Sequence, and Associate. SQL Server Data Mining has nine data mining algorithms that can be used to solve the aforementioned business problems. The following are the list of algorithms that are categorized into different problems.
Classify: Categorized depending on the various attributes. For example, whether a customer is a prospect customer depending on other data such as Age, Gender, Marital Status, Occupation, Education Qualification, etc.
Estimate: Estimation will be done using the parameters. For example, house prices will be predicted depending on the house location, house size, etc.
Cluster: also named as segmentation. Depending on the various attribute natural grouping is done. Customer Segmentation is the classical business example for the clustering.
Forecast: Predict continuous variable for with the time. Predicting sales volume for the next couple of years is a very common scenario in the industry.
Associate: Finding common items or groups in one transaction. The transaction can be a supermarket sales, or medicine or online sales.
Sequence: Predicting the Sequence of events.
Platform
SQL Server 2017 is used in this article but if you have SQL Server 2012 onwards you can still follow this.
In this article series, we will be using a sample data set which you can download and run through with the article. You can download AdventureWorks database and install it to your SQL Server instance.
There are fact and dimension tables in the sample database. However, we will be using the below-listed views predominantly here.
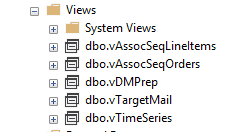
During the article series, we will look at these views in detail.
Data Mining Project
Let us create a data mining project. Open Microsoft Visual Studio and create a Multidimensional project under Analysis Service and select Analysis Services Multidimensional and Data Mining project. Following is the Solution Explorer for the created project.
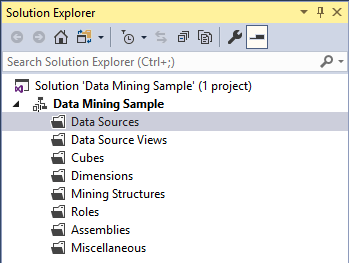
For data mining, we will be using three nodes, Data Sources, Data Source Views, and Data Mining.
Data Sources
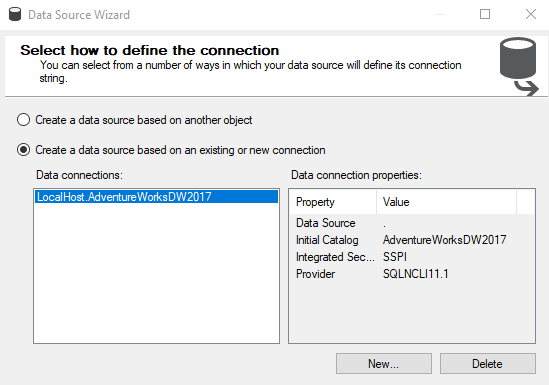
We need to configure the data source to the project as shown below. The data source makes a connection to the sample database, AdventureWorksDW2017.
After providing the credential to the source database, next is to provide the credentials to the Analysis service to connect to the database.
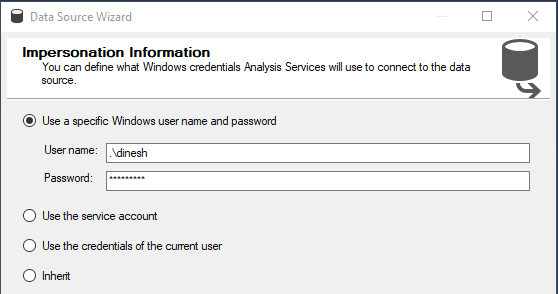
Analysis service will be used to store the data mining models and analysis service only use windows authentication. Any of the four options can be used to provide the necessary connection.
With this, you have configured the data source to the project and of course, you can modify them later. Also, you can create multiple sources for a project.
Data Source View
Next step is to select a data source view. The data source view is a subset of the tables or views. Since you might not require all the tables and views for the project, from the data source view, you can choose the needed objects.
There should be one selected data source for a given data source view. Though you can create multiple data sources, you can attach only data source for one data source view. Also, if you haven’t created a data source before, from the Data Source View wizard, you can create the data source.
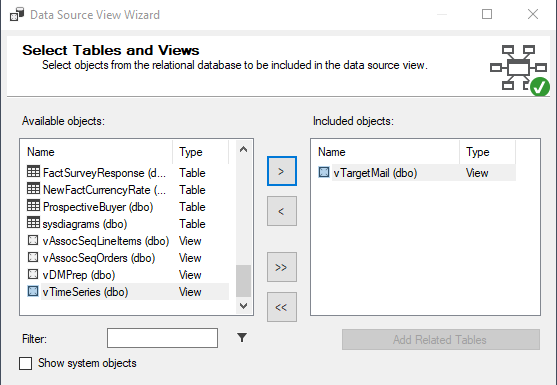
In the data source view, you can select the objects you need from the available objects. You can filter the objects. If you have selected tables that have foreign key constraints, you can automatically select the related tables by selecting Add Related Table.
Similar to the data sources, you can create multiple data source views. However, you can have only one data source for a given data source view.
Data Mining
Now you have done the basic setup to start the data mining project. Next is to create a data mining project. Similar to other configurations, data mining structure creation will be done with the help of a wizard.
The following will be the wizard for the data mining model creation.
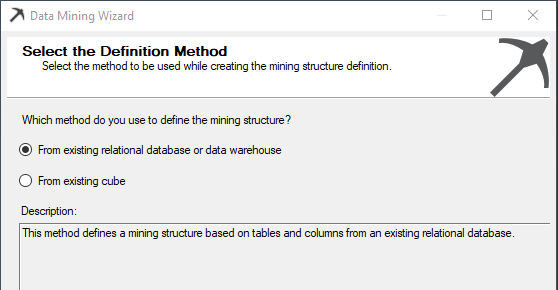
In the above dialog box, there are two types of sources, whether it is from a relational database or an OLAP cube.
Next, the technique or algorithm is selected.
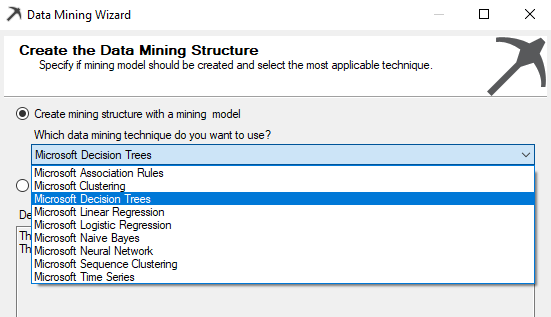
Nine data mining algorithms are supported in the SQL Server which is the most popular algorithm. However, you would have noticed that there is a Microsoft prefix for all the algorithms which means that there can be slight deviations or additions to the well-known algorithms.
The next correct data source view should be selected from which you have created before.
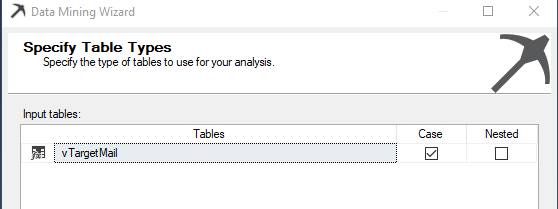
Next is to choose the Case and Nested options. The case table is the table that contains entities to analyze and the nested table is the table that contains additional information about the case.
Sometimes, you do not need all the attributes for the purposes. For example, customer address attributes do not make any sense to appear as an impacted attribute for the final decision. From the following screen, you can select only the attributes that you would think will make an impact.
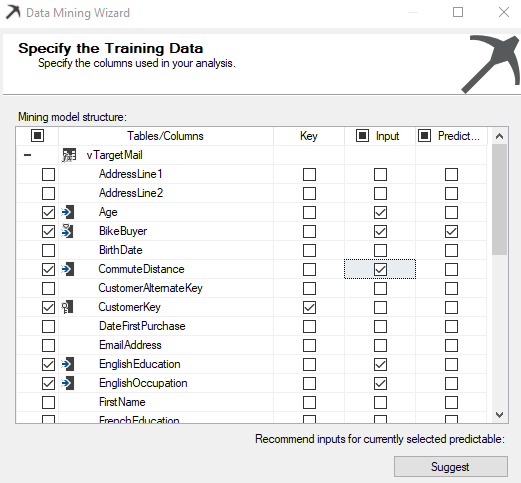
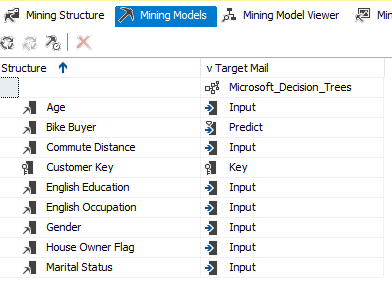
In the above screenshot, Customer Key is the key column while Age, Bike Buyer, Commute Distance, Education, and Occupation are the inputs to predict whether a Bike Buyer or not.
If you don’t have any clue about your data set, you can use the Suggest button and get some idea about the key impacted attributes.
In the next screen, Content-Type and Data types are listed and users can modify them if needed.
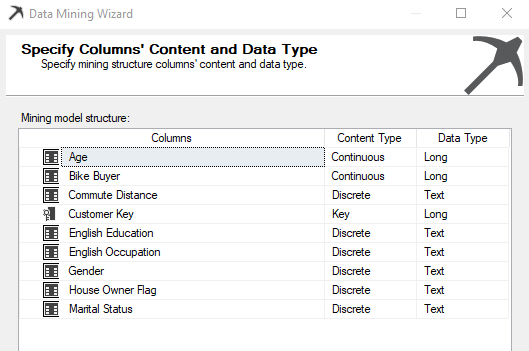
Some algorithms will not be working with some content type. For example, Microsoft Naïve Bayes will not be possible if you have selected a Continuous content type.
There are five types of Content-Type such as Continuous, Cyclical, Discrete, Discretized and Ordered. Discrete data can take only integer values whereas continuous data can take any value. For instance, the number of patients treated by a hospital each year is discrete whereas hospital income is continuous. Discretization means transferring continuous variables into discrete variables.
Whenever the data mining model is created, it is always important to test your model with a valid data set. Train data set will be used to train the model while the test data set is used to test the built model. The following screen will show how to configure test and train data set.
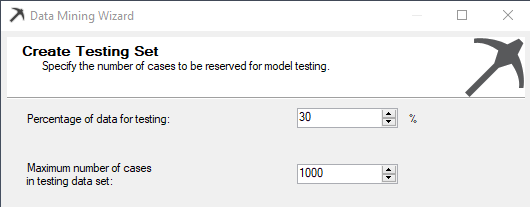
Typically 70/30 is the split for train/test data set. Input data will be randomly split into two sets, a training set and a testing set, based on the percentage of data for testing and a maximum number of cases in testing data set you to provide. The training set is used to create the mining model. The testing set is used to check model accuracy.
The percentage of data for testing specifies percentages of cases reserved for the testing set. The Maximum number of cases in testing data set limits the total number of cases in the testing set. If both values are specified, both limits are enforced.
Model Processing
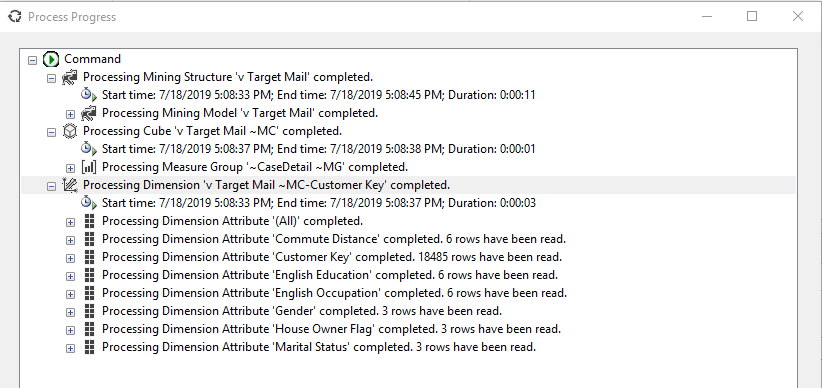
After the data Mining model is created, it has to be processed. We will discuss the processing option in a separate article. However, for the moment let us say, processing the data mining model will deploy the data mining model to the SQL Server Analysis Service so that end users can consume the data mining model.
Once the model is processed, it will be shown as follows.
Once the model is processed it is ready, next is to consume the data mining model.
Mining Model Views
After the model is created, the next is to visualize the model. There are five tabs to views these models. There are Mining Structure, Mining Models, Mining Model Views, Mining Accuracy chart, and Mining Model Prediction.
Most of the tabs are relevant to the Data Mining algorithms that were selected before. Therefore, that discussion will be saved for incoming articles. Mining Model tab is common for all the other mining algorithms.
There can be multiple mining models in this tab.
As we know, prediction can go wrong. However, we need to know what is the accuracy level of the data mining model that we provide. Accuracy chart will provide you multiple options to measure the accuracy of the model that you built, which will be discussed in a separate article.
What’s Next
I hope this article helped you gain some basic understanding of data mining. If you are willing to join the journey to learn data mining with SQL Server, setup the environment and get your hand dirty with this, stay tuned to explore Microsoft Naive Bayes algorithm in my next article on SQLShack.
Table of contents

View all posts by Dinesh Asanka
- Testing Type 2 Slowly Changing Dimensions in a Data Warehouse - May 30, 2022
- Incremental Data Extraction for ETL using Database Snapshots - January 10, 2022
- Use Replication to improve the ETL process in SQL Server - November 4, 2021