
In this article, I am going to introduce Amazon QuickSight and how to visualize data using it. Amazon QuickSight is a data visualization tool offered by Amazon hosted on AWS and is available across multiple locations. As per the statement provided on the official website it says: “Amazon QuickSight is a fast, cloud-powered business intelligence service that makes it easy to deliver insights to everyone in your organization.” Using QuickSight, users can create different analyses and then integrate those in a dashboard and share them with people within the organization.
These dashboards can be consumed by many users and across multiple platforms like web or mobile apps. Users can also integrate these dashboards on web applications, websites, or various other portals as required. The dashboards are scalable and have an ability to interactively enable actions within the dashboards.
Signing up for Amazon QuickSight
In order to use QuickSight, you need to have a valid AWS account. If you do not have an AWS account, please go to http://console.aws.amazon.com/ and create an account first. Creating the AWS account is beyond the scope of this article, so I am not going to explain that in detail. Once you are logged into the AWS console, search for QuickSight and click the link as follows.
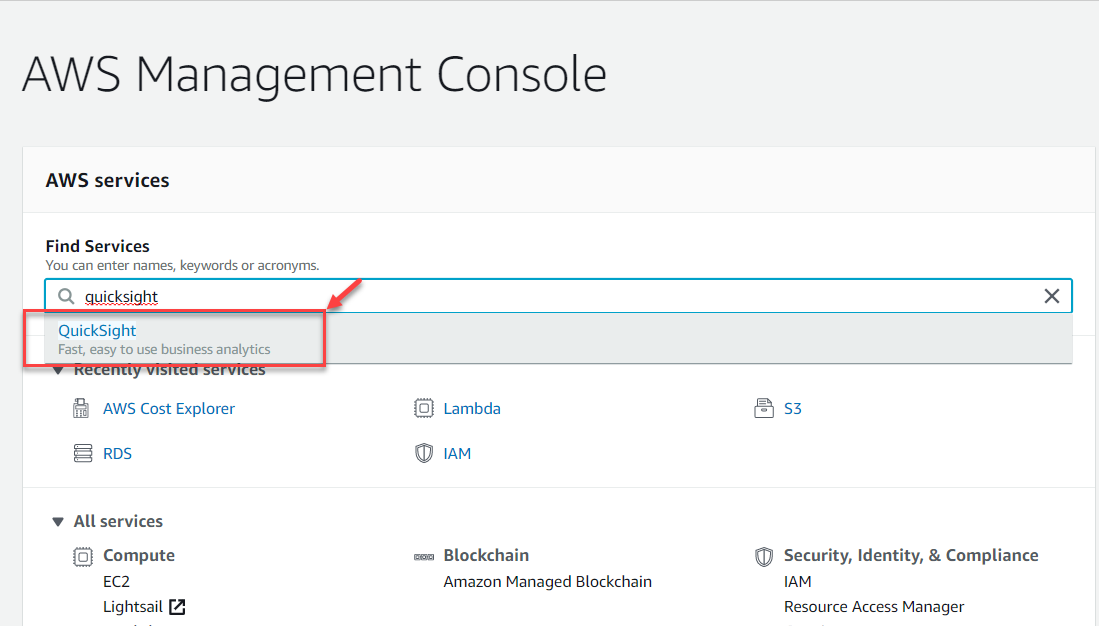
Figure 1 – Search for QuickSight
You will be navigated to the portal for Amazon QuickSight, where you will be asked to sign up for the service, specifically. Click on Sign up for QuickSight and proceed forward. On the next page, you will have an option to select the edition. For the sake of this tutorial, I am going to select the Standard Edition and click on Continue.
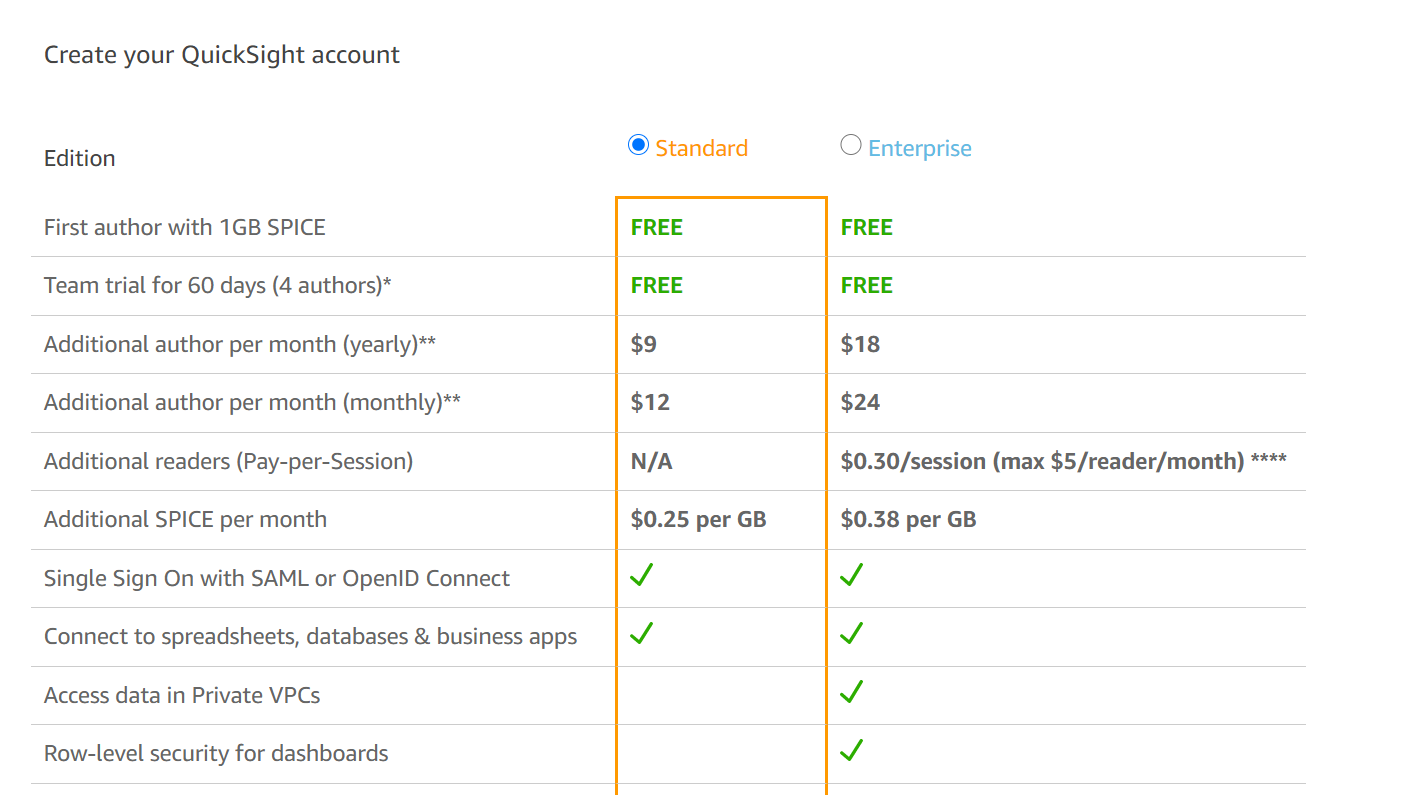
Figure 2 – Select QuickSight Edition
On the next page, you will need to provide an account name for your QuickSight service and an email address on which you can receive notifications. Click on Finish once you are done.
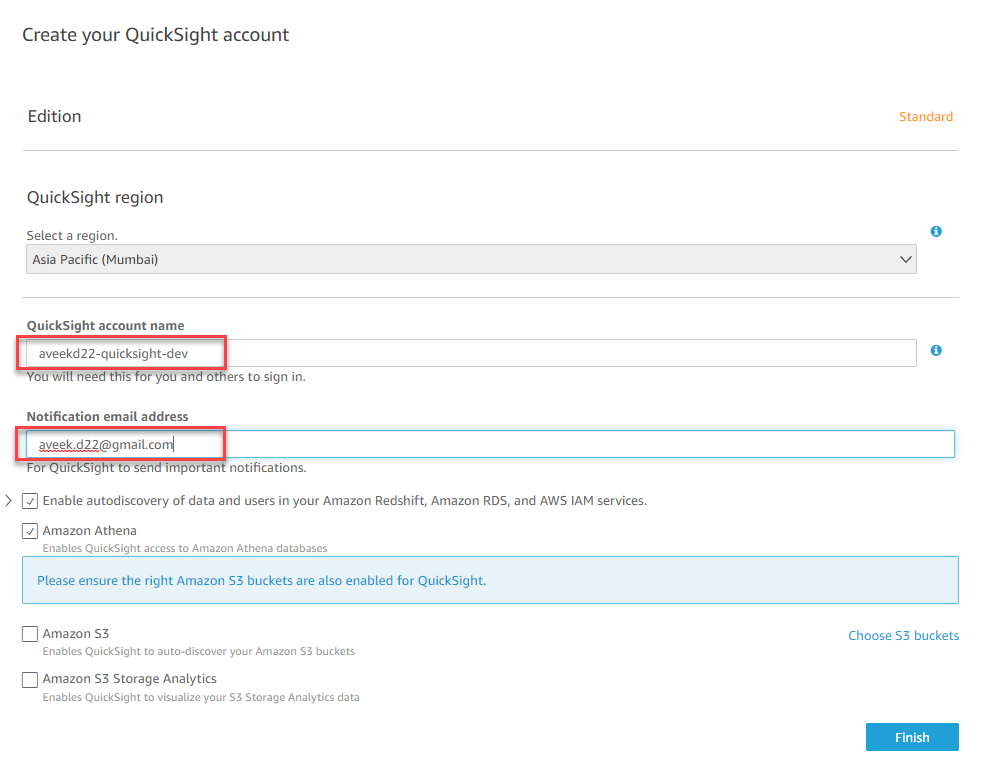
Figure 3 – Setting Up QuickSight Account
The process may take up to a few minutes and once it is completed, you will receive a message which says signup for Amazon QuickSight is successful.
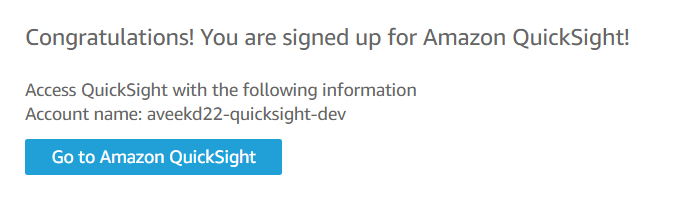
Figure 4 – QuickSight Account signup successful
Click on Go to Amazon QuickSight to start the service. You will be navigated to a different service in which you can see QuickSight being loaded with a few sample analyses already prepared.
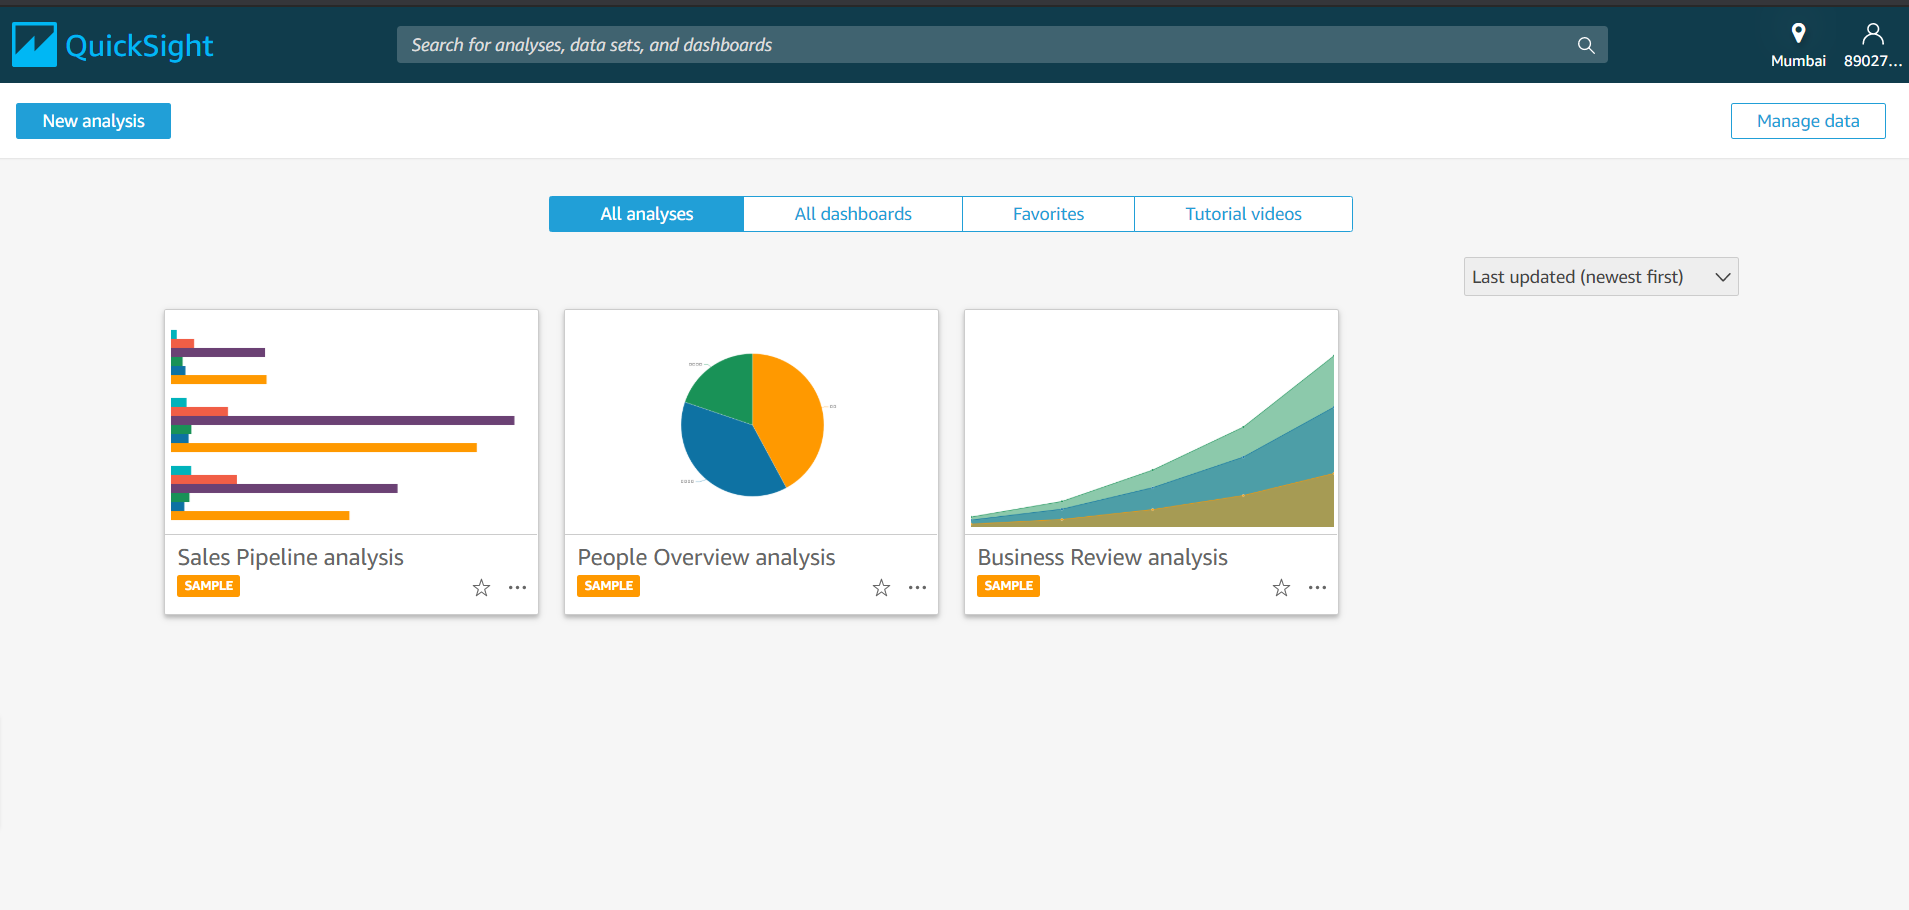
Figure 5 – QuickSight Sample Analyses
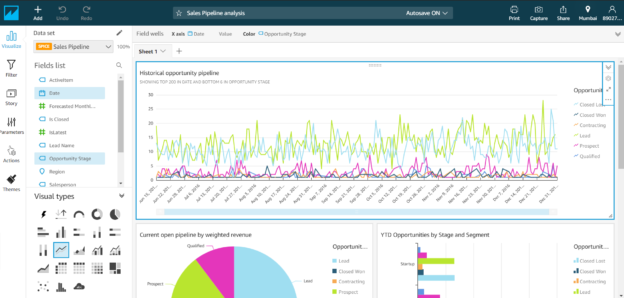
Just to get an idea about the sample analyses, let’s go ahead and open the Sales Pipeline analysis that is available on the list. As you can see, a new analysis that will start up and you will be able to view the report as follows.
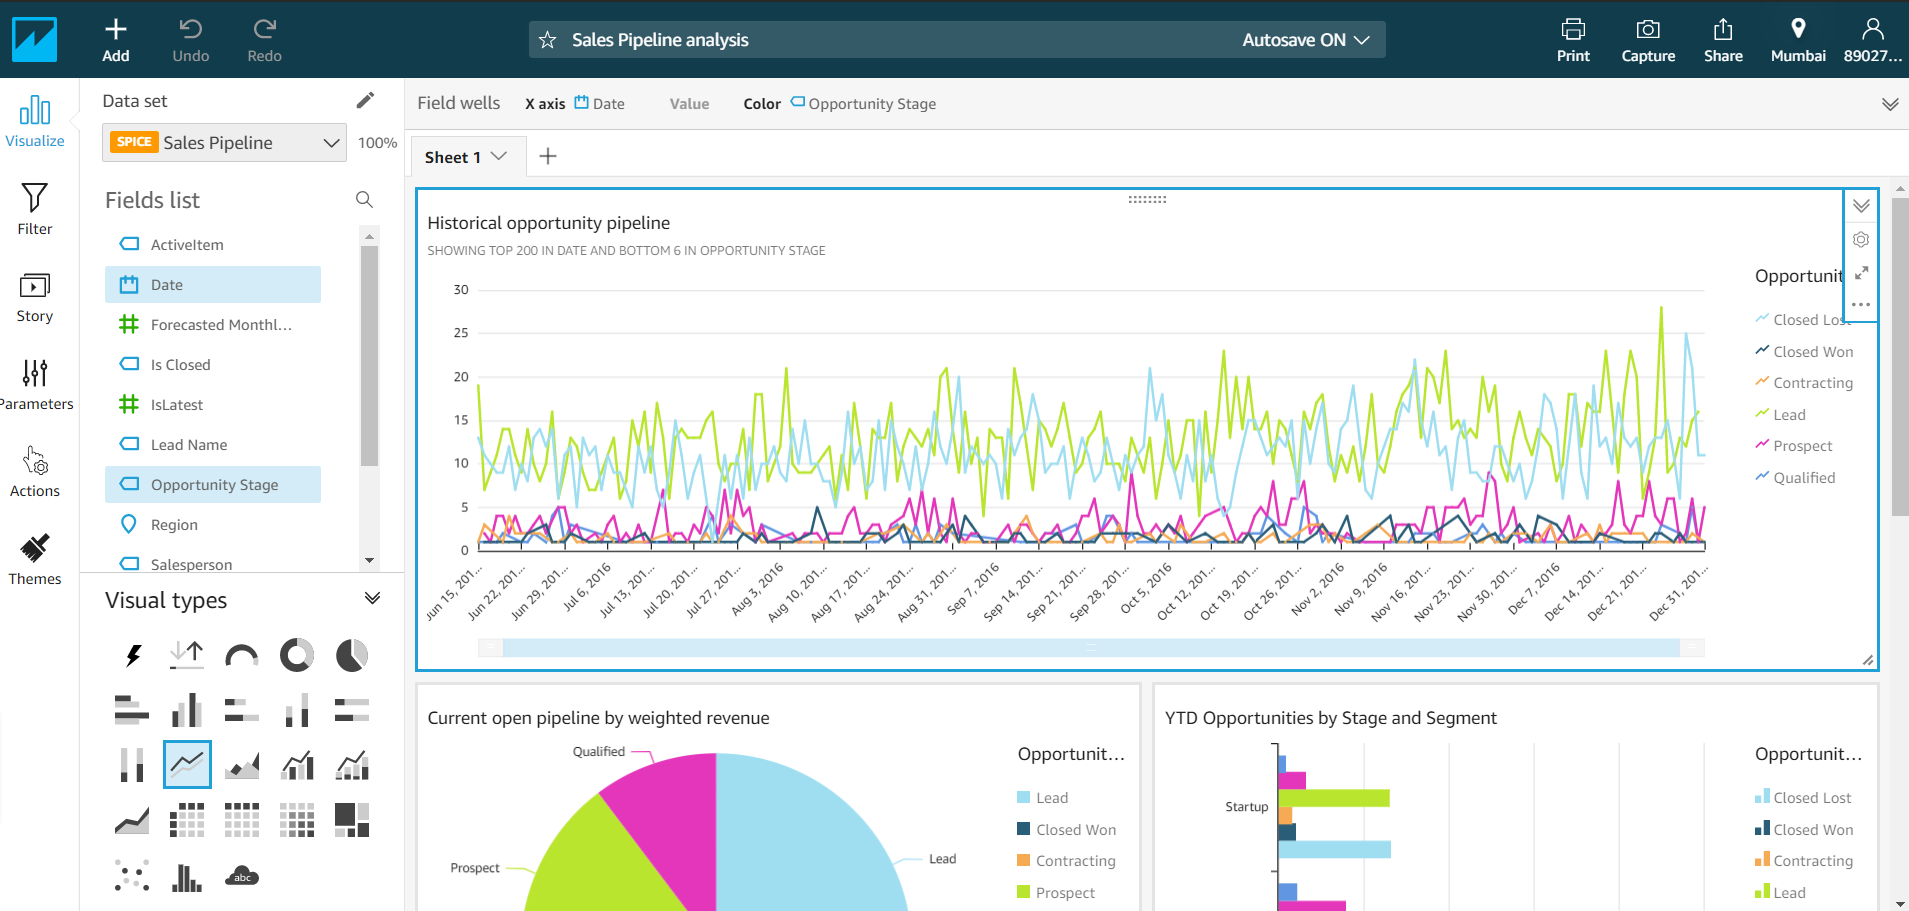
Figure 6 – Sample Analysis – Sales Pipeline
As you can see in the above figure, this is the layout of an Amazon QuickSight analysis. On the left-hand pane, there are many icons that we can use to visualize the report which is active by default, apply filters to the existing report, create a story from an analysis, define parameters and use them as external filters, set actions to control how other visuals changed based on a fixed visual. You also have the option to define custom themes and color schemes so that the reports can be blended into the same theme as your web application or to give as a branded look of your organization.
In the second pane on the left, we have the Dataset pane, which displays a list of all the available fields that the selected data source has. The fields are categorized according to the data types, for example; string, numerical, etc. You can use these fields to create the various analyses as and when required. On the bottom, there is the Visual Types pane which enables us to select what type of visual we want to display on the reports. There are several visual types from which we can select a suitable one to use, the most common being the bar and the pies.
All the visuals will be created on the right-hand pane where you can adjust the size of the visuals by just dragging the right handles of those visuals. You can also make two or three visuals appear side by side by just adjusting the width of each of those visuals.
Creating an analysis from scratch
Now that we have some idea how an Amazon QuickSight report looks, let us go ahead and create an analysis of our own. To begin with, lets us start by fetching a dataset into the QuickSight environment. For the sake of this tutorial, I am going to use the Superstore dataset sample which can be downloaded for free.
On the QuickSight homepage, click on New analysis to create one.

Figure 7 – New Analysis in QuickSight
On the next page, you will see an option to choose from a list of available datasets for this analysis. Since we are going to use our own dataset for this analysis, let us go ahead and upload it. Click on New data set button to proceed.
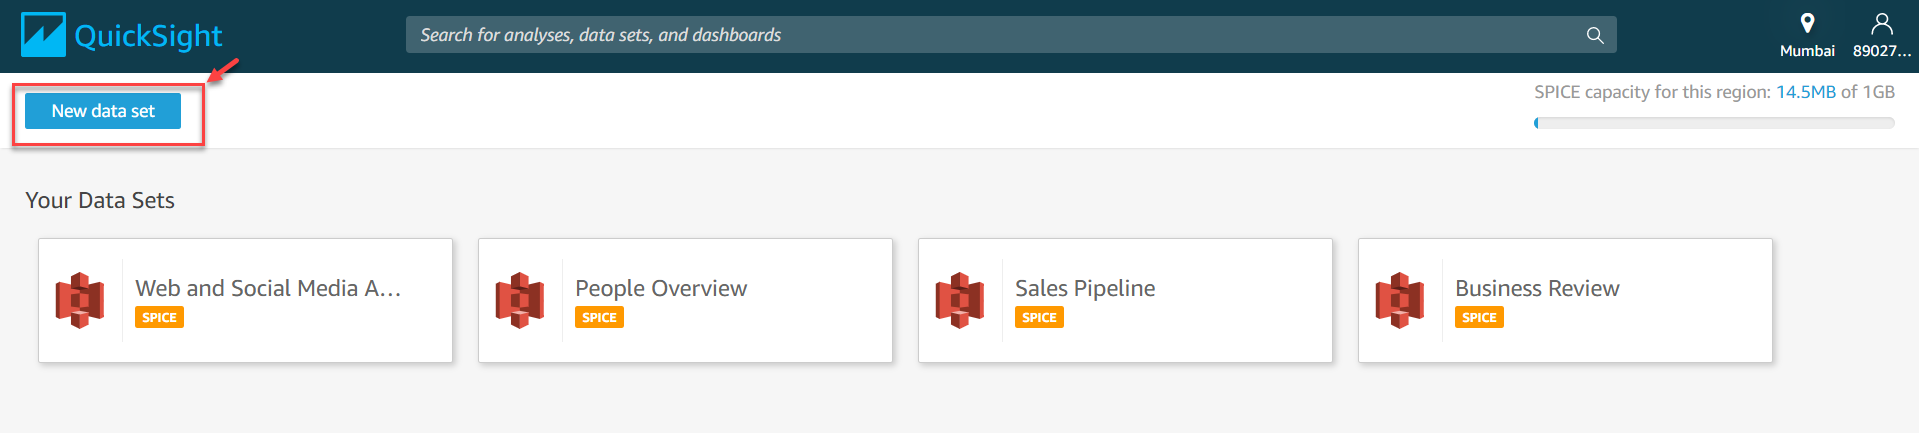
Figure 8 – Choosing a new data set
On the next page, choose Upload a file to upload the CSV file from the local machine.
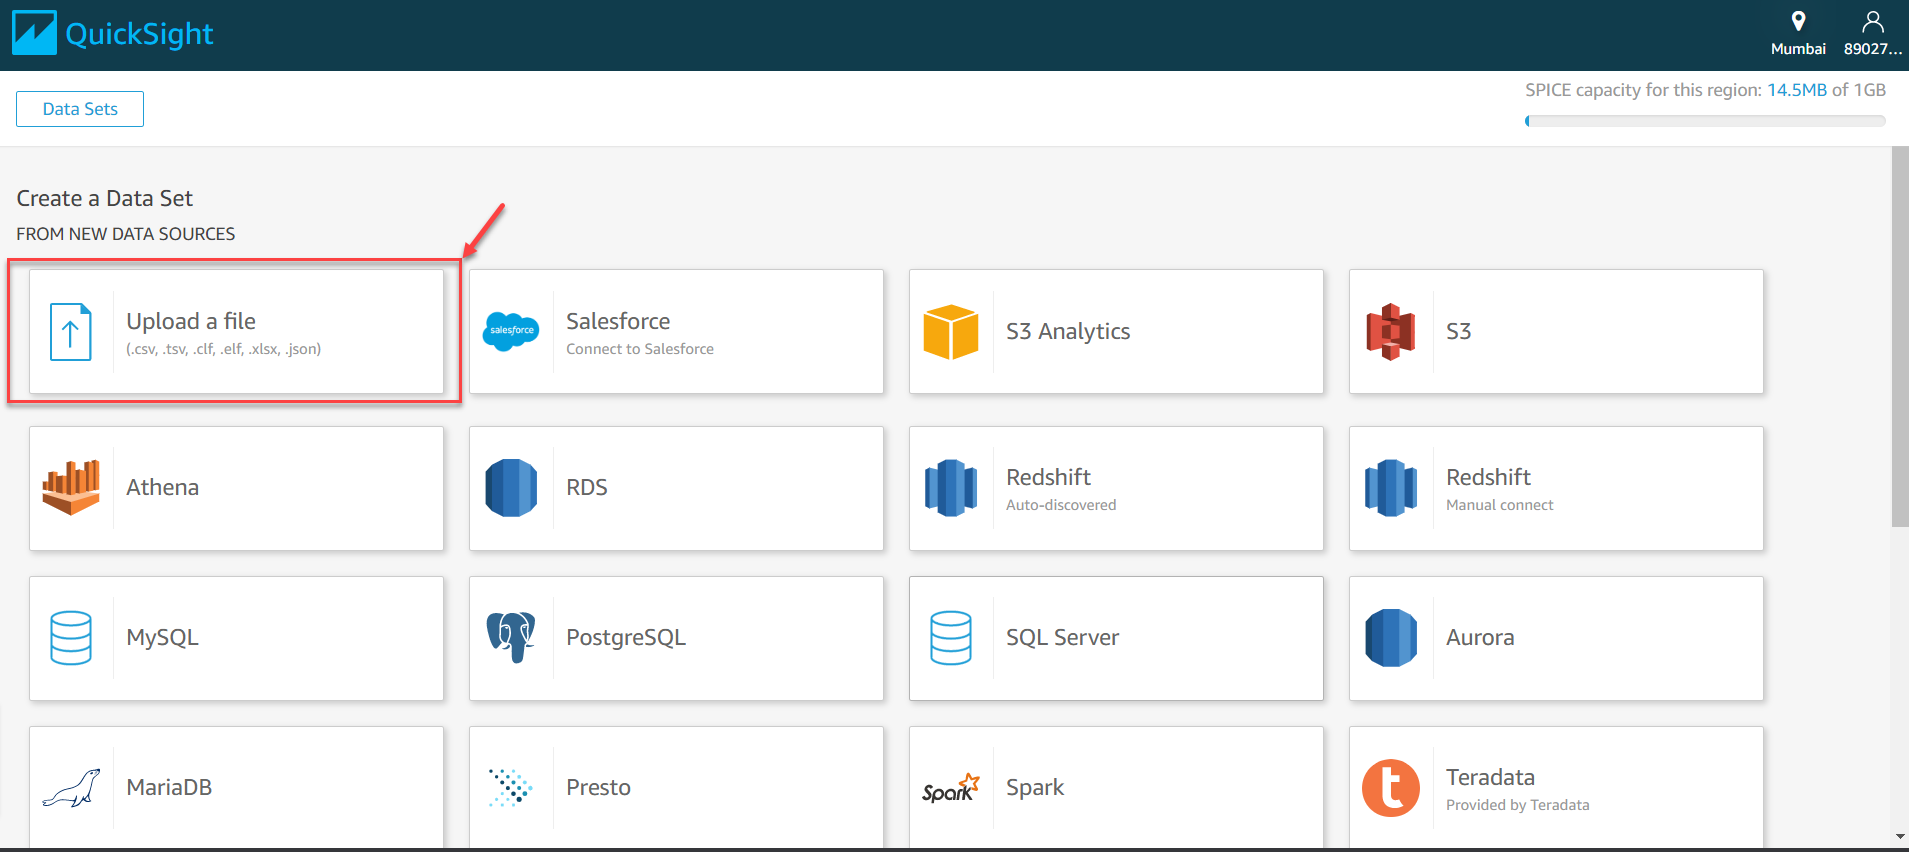
Figure 9 – Upload a file
Choose the path on which the CSV is downloaded and select the file for upload. Once the file is uploaded, you can verify it by the following message on the screen.
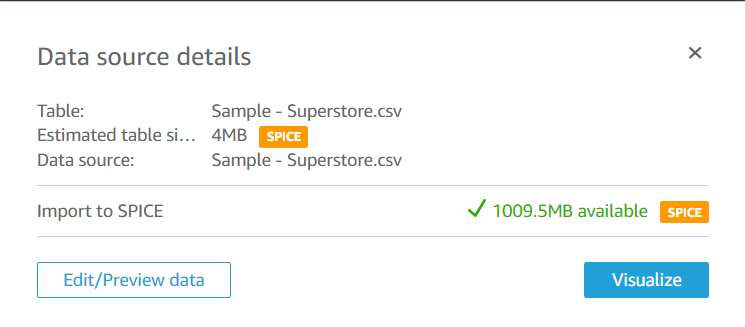
Figure 10 – Data source uploaded successfully
Click on Visualize to create an analysis from this dataset. You will see that a new analysis opens up without any visuals on it. Rename the analysis as required and proceed forward to create the visuals.
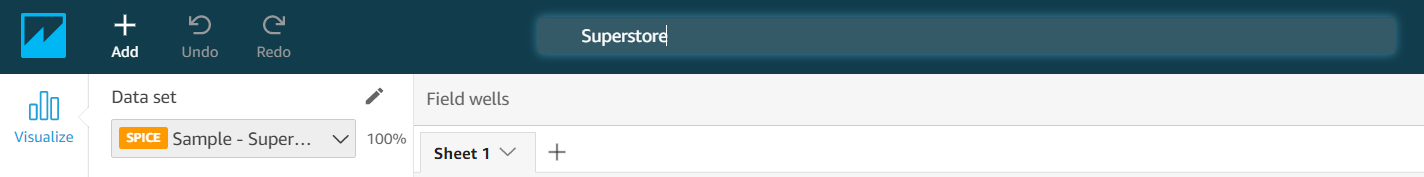
Figure 11 – Rename the Analysis
Let us now go ahead and create our first visual. Let us try to see the sales made by each state in the United States on a bar chart. Select the visual type as bar from the pane and drag and drop the State and Sales from the Field List pane to the Y-axis and the Value boxes, respectively.
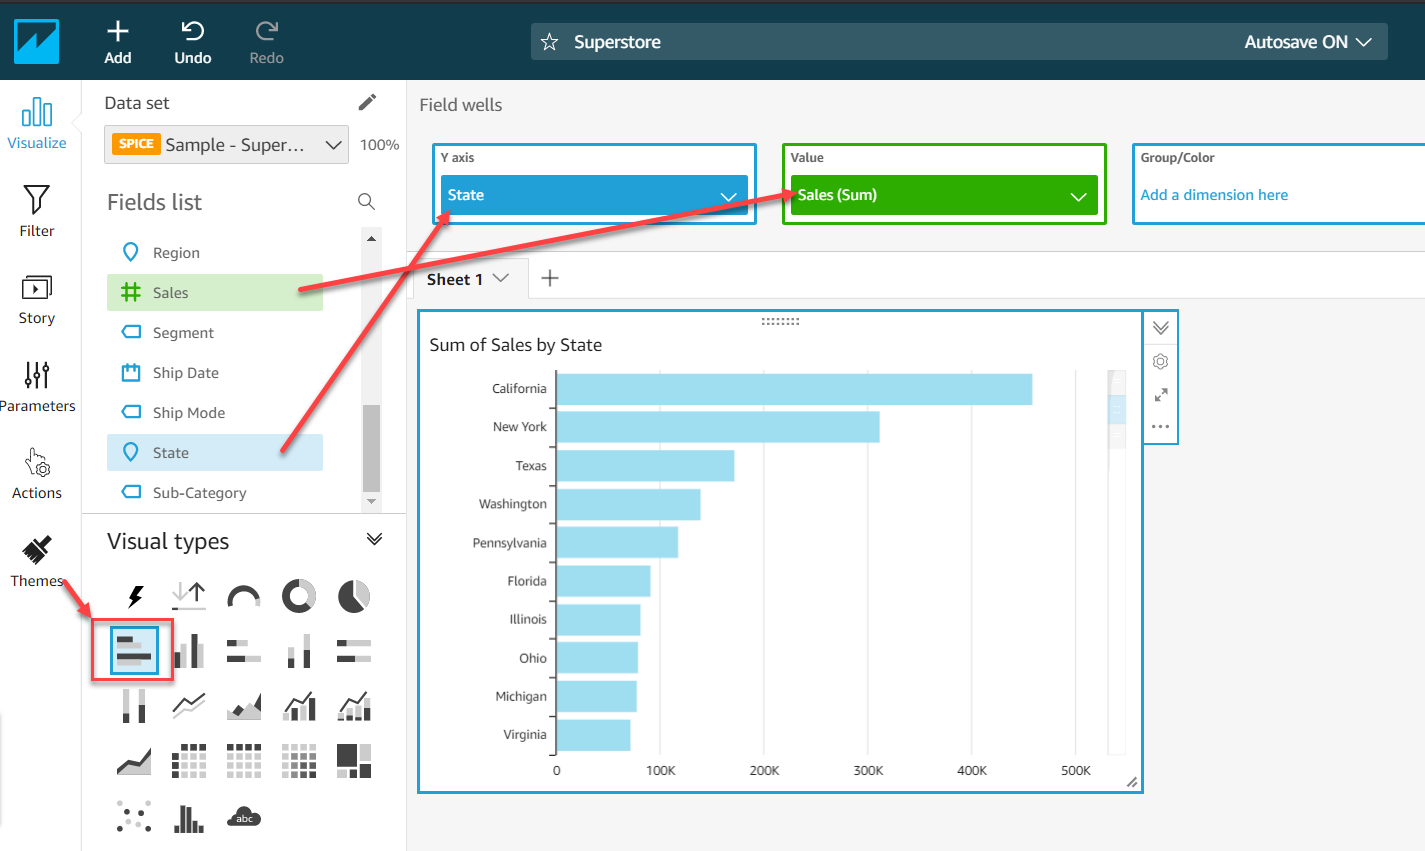
Figure 12 – Sales by State visual
Likewise, let us try to make another visual, a line chart that displays the sales over a period of time. Click on the Add icon on the top and select Add visual. Select the visual type as Line and drag and drop the Order Date and Sales to the X-axis and the Value boxes, respectively.
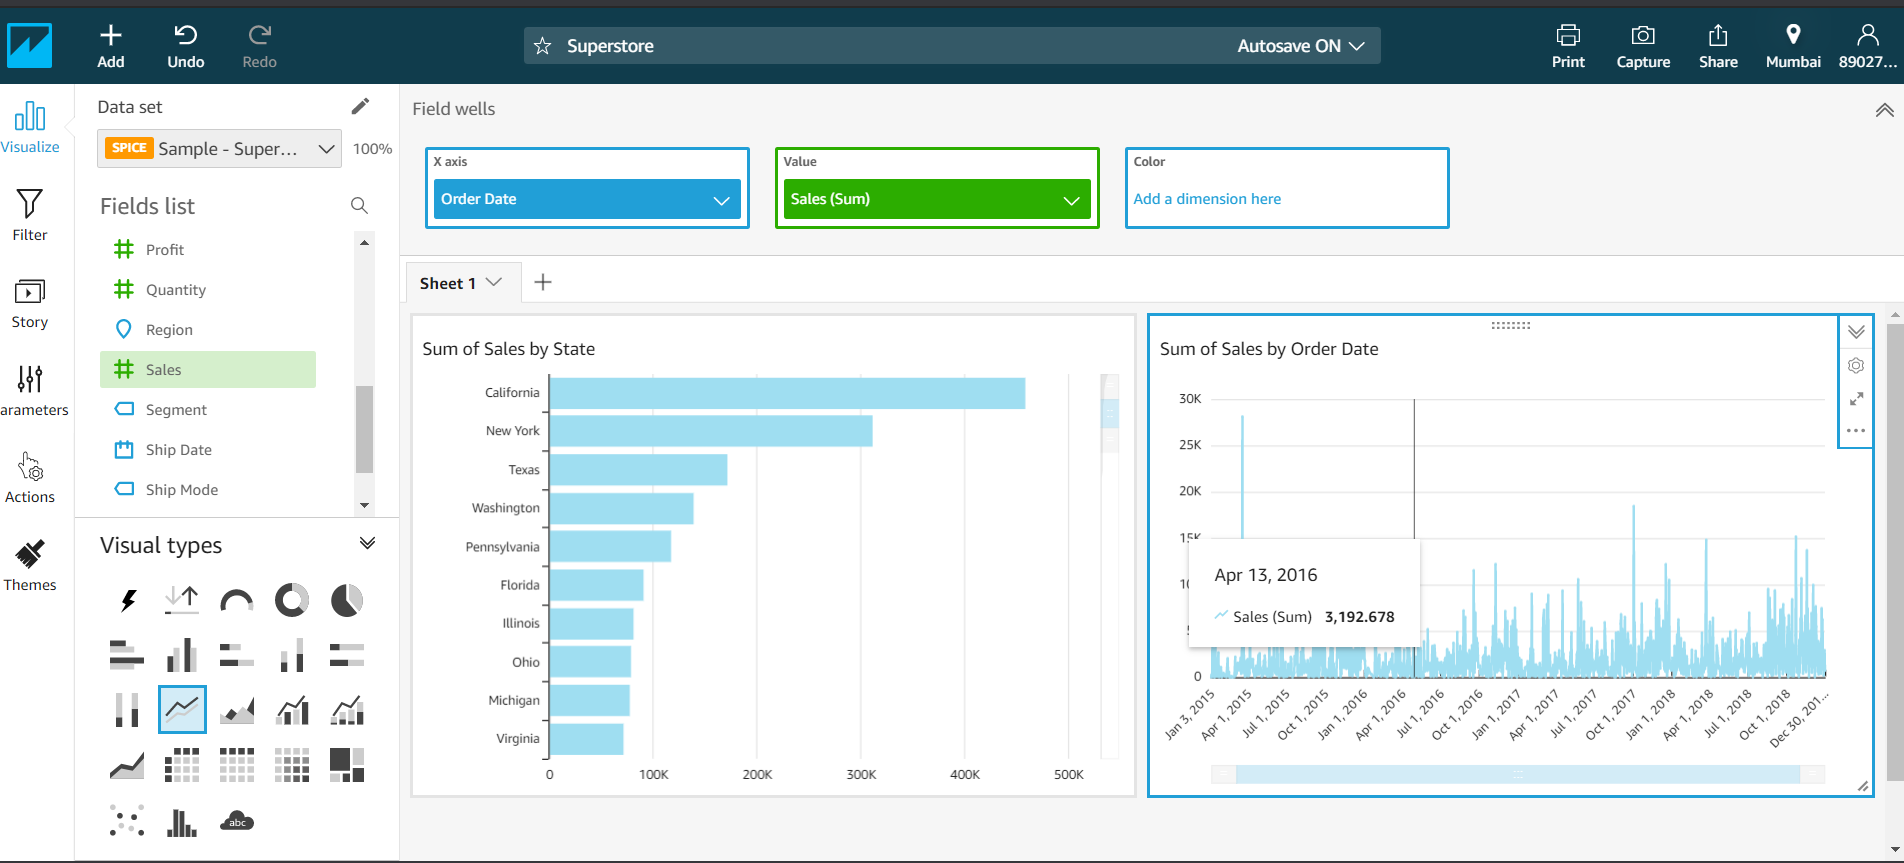
Figure 13 – Sales over Period
By default, these analyses are automatically saved, which means you do not need to save them explicitly. You can toggle this feature by selecting Autosave on or off as required.
Sharing the analyses
Now that the analysis is done, we are ready to publish it and share it with other users. There are two ways to share analysis. The first way is to share the analysis by creating a read-only version, also known as a dashboard and the second option is to share the same analysis with someone.
Let us go ahead and publish the analysis as a dashboard first. Click on the Share icon on the menu bar and select Publish dashboard.
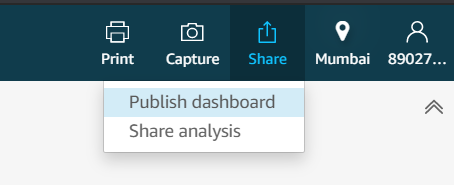
Figure 14 – Publish Dashboard
Give the dashboard a relevant name and click on Publish dashboard.
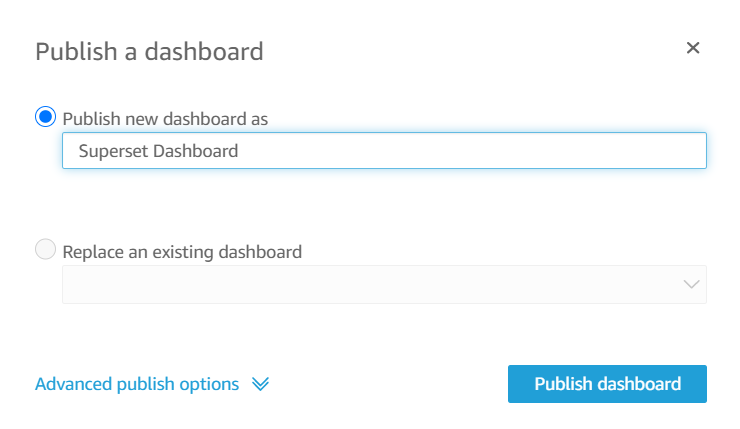
Figure 15 – Dashboard Name
You can choose which uses should have access to the dashboard by providing individual email addresses or selecting all users under the account. Once the dashboard is ready it will be visible to all the users under the account used.
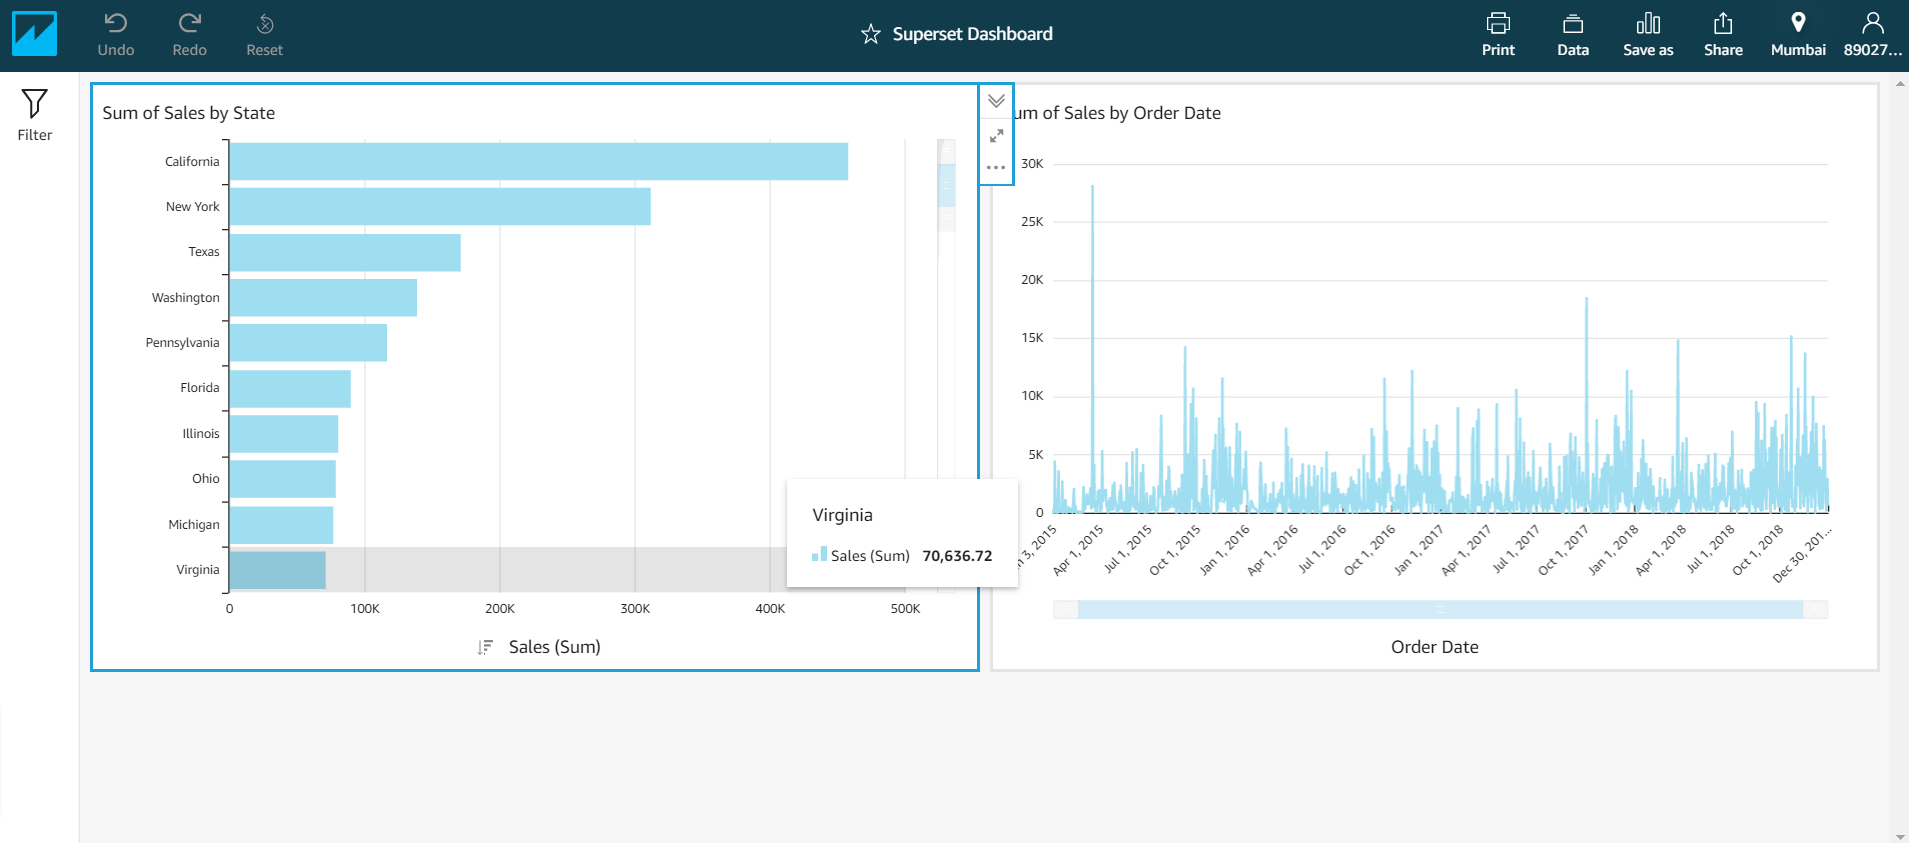
Figure 16 – Superstore Dashboard
Conclusion
In this article, we have seen an introduction to Amazon QuickSight service and how it can be used to visualize data. As explained previously, Amazon QuickSight is a fully managed cloud data visualization tool that can be compared to Power BI service. This tool is available to be used in multiple regions across the globe.

He is a prolific author, with over 100 articles published on various technical blogs, including his own blog, and a frequent contributor to different technical forums.
In his leisure time, he enjoys amateur photography mostly street imagery and still life. Some glimpses of his work can be found on Instagram. You can also find him on LinkedIn
View all posts by Aveek Das
- Getting started with PostgreSQL on Docker - August 12, 2022
- Getting started with Spatial Data in PostgreSQL - January 13, 2022
- An overview of Power BI Incremental Refresh - December 6, 2021