
In this article, we will be discussing Microsoft Linear Regression in SQL Server. This is the next data mining topic in our SQL Server Data mining techniques series. Naïve Bayes, Decision Trees, Time Series, Association Rules, and Clustering are the other techniques that we discussed until today.
Microsoft Linear Regression is a forecasting technique. In this type of technique, there are multiple independent variables from which the dependent variable is predicted. For example, if you want to predict the house prices, you need to know the number of rooms, the area of the house, and other features of the house.
This means that the linear regression model can be represented as follows:
Y = a X1 + b X2 + . . . + z Xn + C
Let us see how we can use linear regression in the Microsoft SQL Server platform. As in the previous examples, today also, we will be using the vTargetMail view in the AdventureWorksDW sample database.
As we did for other data mining techniques, first, we need to create a data source and the Data Source View. The Data source is chosen as AdventureWorksDW and vTargetMail view is selected as the data source views.
We choose the Microsoft Linear Regression as the data mining technique, as shown in the below screenshot.
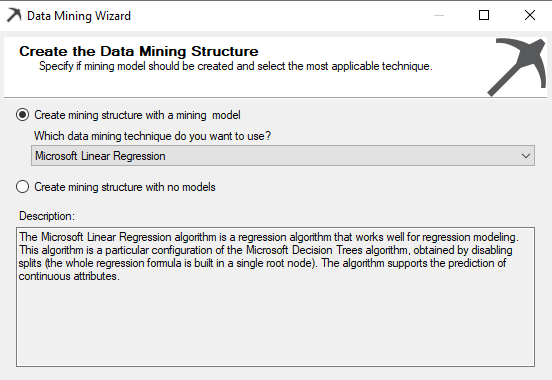
In this technique, the Microsoft decision trees algorithm is used. Unlike in the decision trees, linear regression will have only one node, and we will verify the results for linear regression with the decision trees at the end of the article.
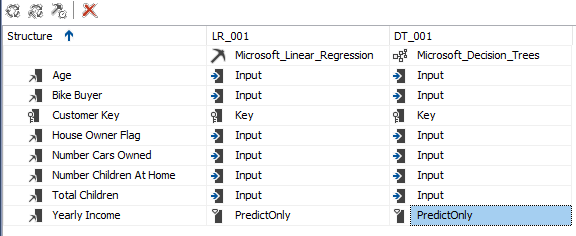
The vTargetMail will be the Case table and let us choose relevant attributes, as shown in the below screenshot.
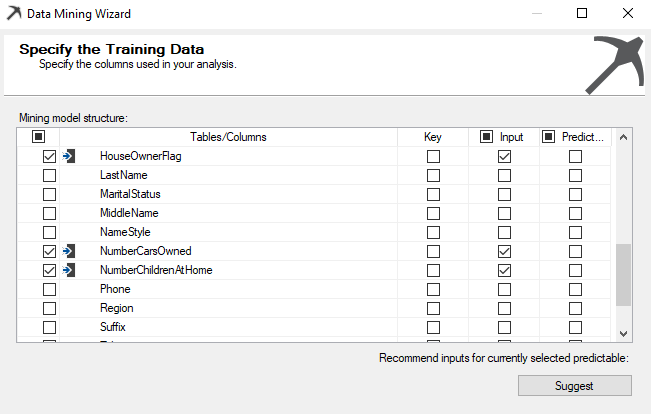
The Customer Key is chosen as the Key from the algorithm from the above screen. In Microsoft Linear regression, all the inputs should be numerical; the text column should not be selected. Therefore, in the above selection, Age, BikeBuyer, HouseOwnerFlag, NumberCarsOwned, NumberChildrenatHome, TotalChildren are selected as input attributes. This is a major limitation in the Microsoft Linear Regression, which is not in the standard Linear Regression techniques.
In the previous examples, we have selected Bike Buyer as the predicted column. However, in the Microsoft Linear Regression, we are to predict YearlyIncome.
Though there are default Content types, there are instances where you need to change the content types. Content types can be modified from the following screenshot.
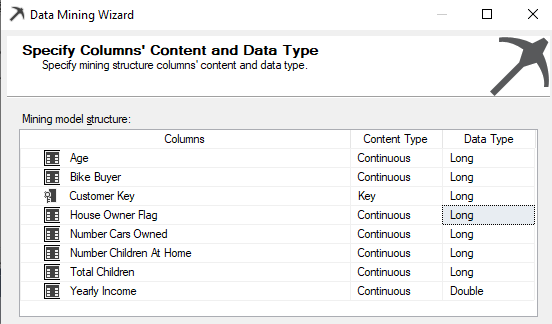
By default, House Owner Flag is selected Text data type, which has to be changed to the Long data type.
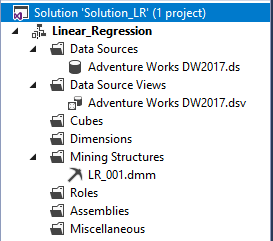
In the other screens in the data mining wizard, default settings are used. This is the Solution Explorer for the Microsoft Linear Regression data mining technique.
The next is to process the data mining structure. There will be a warning message saying that there is no split in decision trees. You can ignore this warning as for linear regression; there won’t be any split for the decision trees.
After processing the data mining structure, we are now ready to view the results.
Viewing the Results
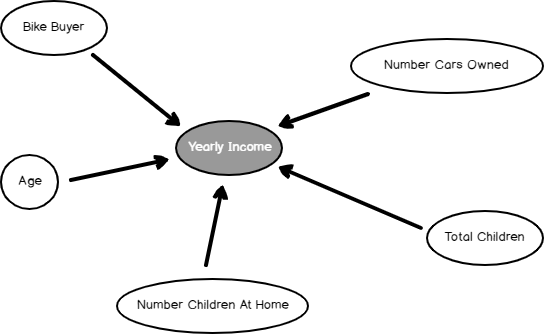
As we observed in many SQL Server algorithms, in linear regression, we can find the dependency network, as shown in the below screenshot.

The Dependency network shows what the most dependent attributes to predict Yearly Income is. By sliding the slider down on the left-hand side, you can find out the significance of these attributes, as we observed in the Naïve base and Decision Trees.
In Microsoft Linear Regression, only another available view is Tree View. However, as indicated before, it is a one-node tree view.

From this view, you can get the linear regression equation, which is the final goal of this technique.
The following screenshot shows the linear regression equation.
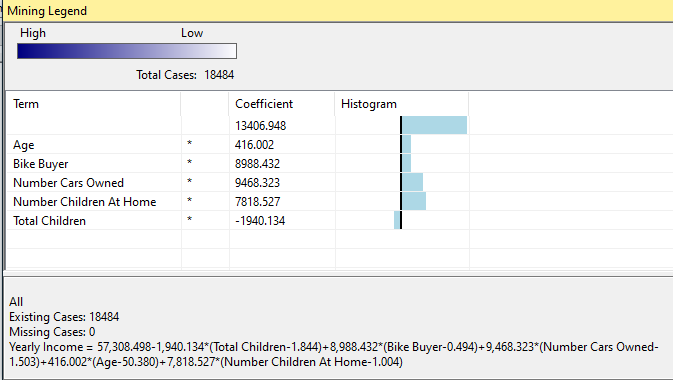
This is the equation and you simply have to replace relevant values to predict the yearly income.
Yearly Income = 57,308.498
– 1,940.134*(Total Children-1.844)
+ 8,988.432*(Bike Buyer-0.494)
+9,468.323*(Number Cars Owned-1.503)
+416.002*(Age-50.380)
+7,818.527*(Number Children At Home-1.004)
Let us see how we can predict from the built model using prediction feature.
Prediction
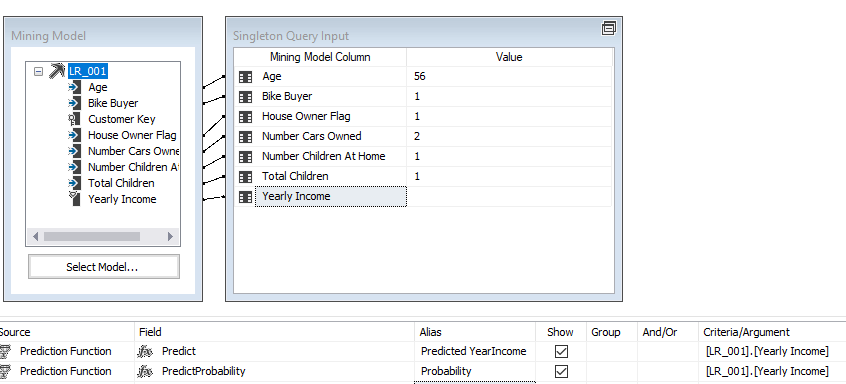
An important aspect of any data mining technique is to predict using the built model. Let us see how we can predict using the built Microsoft Linear Regression model. This can be done from the Mining Model Prediction tab, as shown in the below screenshot. In the following example, some values are provided for a given instance to predict the annual income.
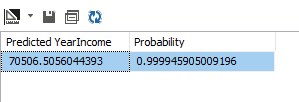
From the result tab, results can be views as shown in the below screenshot.
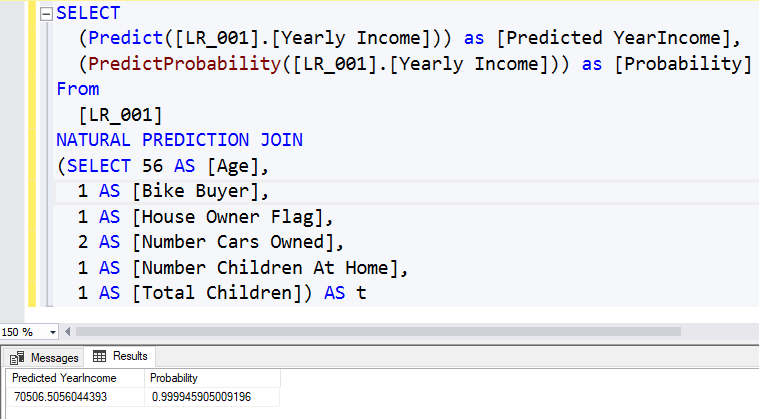
The same results can be obtained from SQL Server Management Studio by executing the DMX query. The following screenshot shows the query and its result.
It is important to note that if you do not have some attributes, you can still obtain the results. The following screenshot shows the prediction value from the Linear Regression model when the number of cars is unknown.
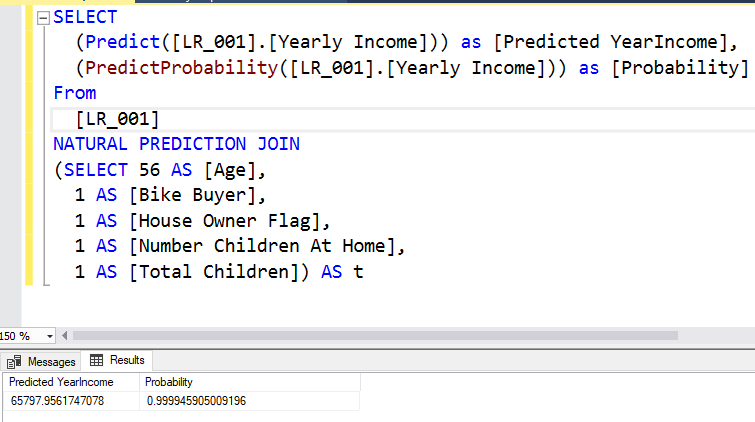
When an attribute is missing, that attribute’s part will be ignored from the entire equation.
Let us validate the equation with the Decision Tree technique.
Validation with Decision Tree
Adding another data mining technique in SQL Server is much simpler. You can add another mining model to the existing attributes in the Mining Model tab.
After processing the mining structure, you will observe the decision, as shown below.
Let us look at the equation at the main node.
Yearly Income = 57,308.215 + 9,468.574*(Number Cars Owned-1.503) + 415.816*(Age-50.384) + 8,988.666*(Bike Buyer-0.494) + 7,817.585*(Number Children At Home-1.004) – 1,939.209*(Total Children-1.844)
You will find that it is the same equation that you got from the linear regression.
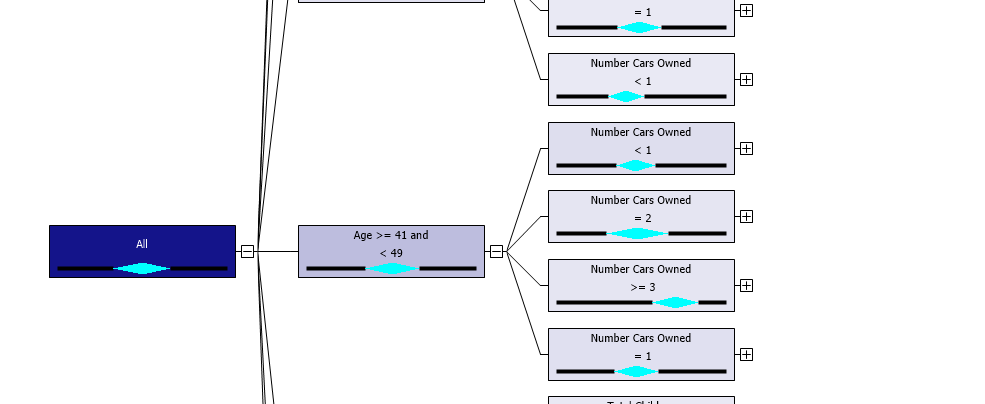
More than that equation, the decision tree has the additional advantage of having node wise equation. In the decision trees, if you click every node, you find an equation, as shown in the below screenshot.
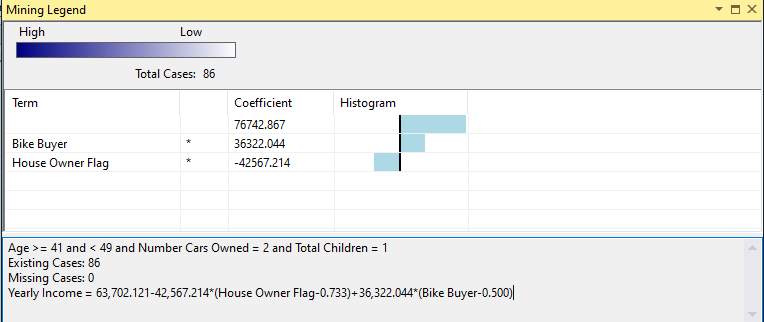
This means that equation Yearly Income will be as 63,702.121-42,567.214*(House Owner Flag-0.733)+36,322.044*(Bike Buyer-0.500) is valid for Age >= 41 and < 49 and Number of cars owned = 2 and Total children = 1.
The following table shows the different equations at different nodes in the tree.
Data Set | Equation |
Age >= 73 and < 81 and Total Children = 3 | Yearly Income = 56,936.254-4,193.080*(Bike Buyer-0.121)-20,137.503*(Number Cars Owned-1.994)-1,936.065*(Age-75.146) |
Total Children = 3 and Age = 76 | Yearly Income = 58,000.000-8,884.447*(Bike Buyer-0.100) |
Age = 73 and Total Children = 3 | Yearly Income = 56,998.501+4,498.500*(Bike Buyer-0.333) |
Age >= 73 and < 81 and Total Children = 2 and Number Children At Home = 3 | Yearly Income = 121,037.417+2,108.061*(Age-75.667)+14,848.268*(Bike Buyer-0.333) |
Age >= 49 and < 51 and Total Children >= 4 and Number Cars Owned = 2 and Number Children At Home < 3 | Yearly Income = 62,583.618-18,114.343*(Number Children At Home-1.897)+5,525.516*(Bike Buyer-0.793)+6,861.981*(Age-49.759)-14,461.923*(Total Children-4.017) |
This means that decision trees are more accurate than Microsoft linear regression.
Model Parameters
As we discussed, every data mining technique has its parameters to suit your data and environments.
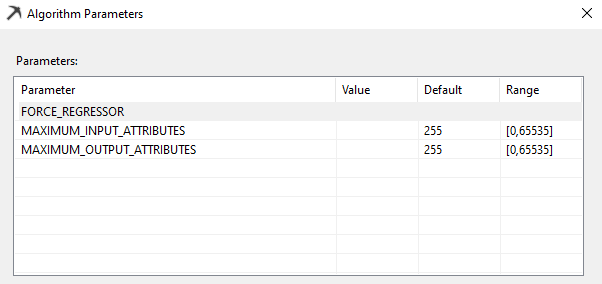
FORCE_REGRESSOR
Microsoft Linear Regression algorithm detects best-fitted attributes automatically and generates the linear equation. In this attempt, it might drop some attributes. However, you can force any attribute that you wish to include in the equation by including in the FORCE_REGRESSOR parameters. If there are multiple attributes, you can include all attributes, such as {Attribute 1}, {Attribute 2}.
Summary
In this article, we discussed Linear regression as a forecasting technique. Microsoft Linear Regression technique was built on the Decision trees and we identified that the decision trees could be used as a regression technique as well.
Table of contents

View all posts by Dinesh Asanka
- Testing Type 2 Slowly Changing Dimensions in a Data Warehouse - May 30, 2022
- Incremental Data Extraction for ETL using Database Snapshots - January 10, 2022
- Use Replication to improve the ETL process in SQL Server - November 4, 2021