
In this article, we will walk through Microsoft Naive Bayes algorithm in SQL Server.
In my previous article, SQL data mining, we discussed what data mining is and how to set up the data mining environment in SQL Server. We briefly said that there are several algorithms which you can select during the setting up of the data mining environment. As mentioned before, we are going to discuss the first algorithm which is Microsoft Naive Bayes in this article.
What is Naive Bayes
Bayes theory was discovered by Rev. Thomas Bayes in 1763 with the example of a newborn child who is witnessing a sunrise for the first time. Let us look at a more modern example. Let us look at an example from the medical arena. The hospital that sees patients for dengue has started to collect data. So they have found that there are several symptoms of dengue patients. High fever, body ache, vomiting, and headaches are few those symptoms and we will limit the symptoms for only those for the purpose of discussion. Now, if you are statistician, you would say, out of the dengue patients, 75% had a high fever and 80% had vomiting. Though these numbers give you some idea, what we need to know as a policy decision-maker, what is the percentage that the patient will have dengue given that he has a fever? Naive Bayes theory can convert to unknown from what you know.
Following is the equation for the famous Bayes theory.
P ( A / B) = P ( B / A) * P (A) / P(B)
P ( A / B) = The likelihood of event A occurring, given that B is true.
P ( B / A ) = The likelihood of event B occurring given that A is true.
P ( A) and P(B) are the probabilities of events A and B independently of each other.
Let us look at this from the dengue and fever example.
The likelihood of having dengue given that the patient is having fever = the likelihood of the patient is having fever given that the patient is suffering from dengue * Probability of patient having dengue / Probability of patient having a fever.
In the above example, to decide whether the patient is suffering from dengue, there are more than one parameter such as vomiting, body ache, headache etc. So you need all these parameters to be analyzed in order to predict whether the patient has dengue.
Microsoft Naive Bayes
Microsoft Naive Bayes is a classification supervised learning. This data set can be bi-class which means it has only two classes. Whether the patient is suffering from dengue or not or whether your customers are bike buyers or not, are an example of the bi-class data set. There can be multi-class data set as well.
Let us take the example which we discussed in the previous article, AdventureWorks bike buyer example. In this example, we will use vTargetMail database view in the AdventureWorksDW database.
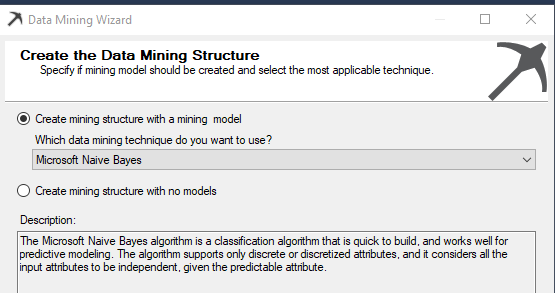
During the data mining algorithm wizard, the Microsoft Naive Bayes algorithm should be selected as shown in the below image.

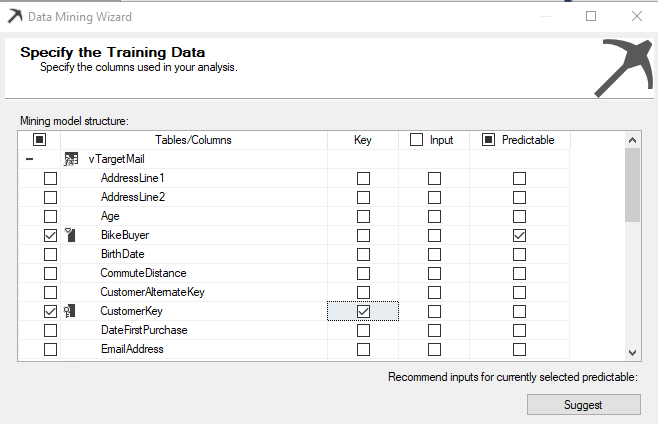
Next is to select relevant attributes which we will think will be impacted on bike buying. As we said last time, there are three types of attributes, Key, Predictable and Input.
So, we are going to predict, whether the customer will buy a bike or not. Therefore the predictable column is Bike Buyer. Each row should be uniquely identified using a Key and Customer Key is the key in this example.
Next is to select inputs which will impact customer buying.
In most cases, you can choose the necessary columns with your experience and sense. However, if you are unable to choose, there is a Suggest button which will give you suggestions as shown in the below image.
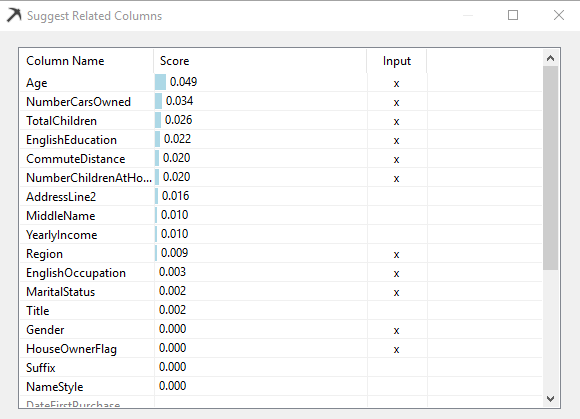
By analyzing data, a suggestion will provide you attributes which the system thinks will have a higher impact. You can choose the impact columns directly from this screen itself.
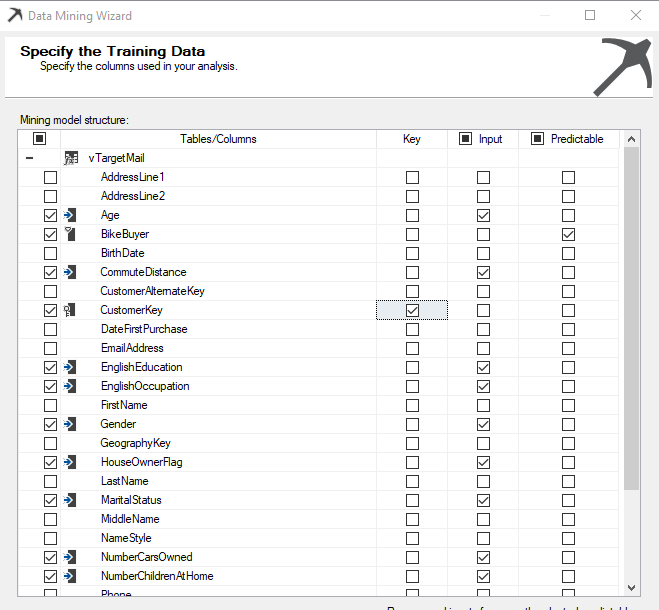
After completing the selection of input columns, the following screen will be displayed as shown in the below image.
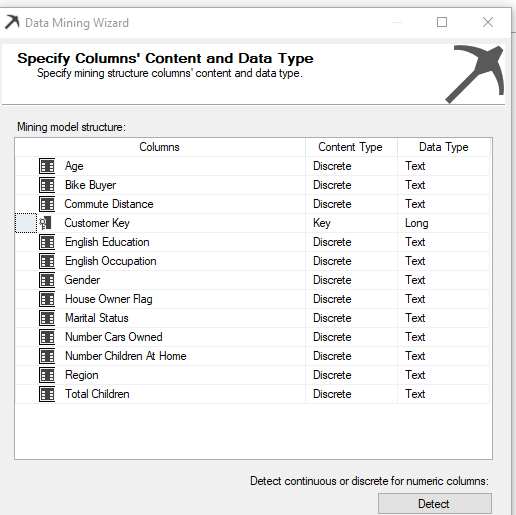
After the selection of attribute is completed, the next screen is to choose Content-Type and Data Type. You would notice that Age, Bike Buyer, Number Cars Owned, Number Children At Home and Total Children will have Discretized Content-Type and Data Type is Long. Discretized Content-Type is not compatible with Microsoft Naive Bayes. Therefore, those attributes have to be changed to Discrete, and Data type should be selected as text. The screen will appear like the following after you correctly configure the content type.
After this, next is to provide the test and train data set parameters and default values are used here. Next is to process the mining model so that it can be consumed by the end-users.
Mining Model Viewer
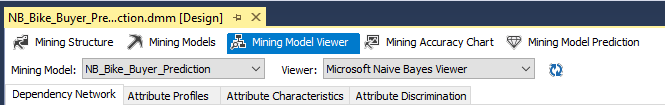
After the mining model is built, next step is to analyze the model. The mining model Viewer is next to the model viewer. In the model viewer, there are four options namely, Dependency Network, Attribute Profiles, Attribute Characteristic and Attribute Discrimination as shown in the below image.
Dependency Network
The dependency network is a clear indicator of which attributes make a high or low impact towards the predictable attribute. In the following image, it elaborates what are the attributes which have a higher impact to decide Bike Buyer.
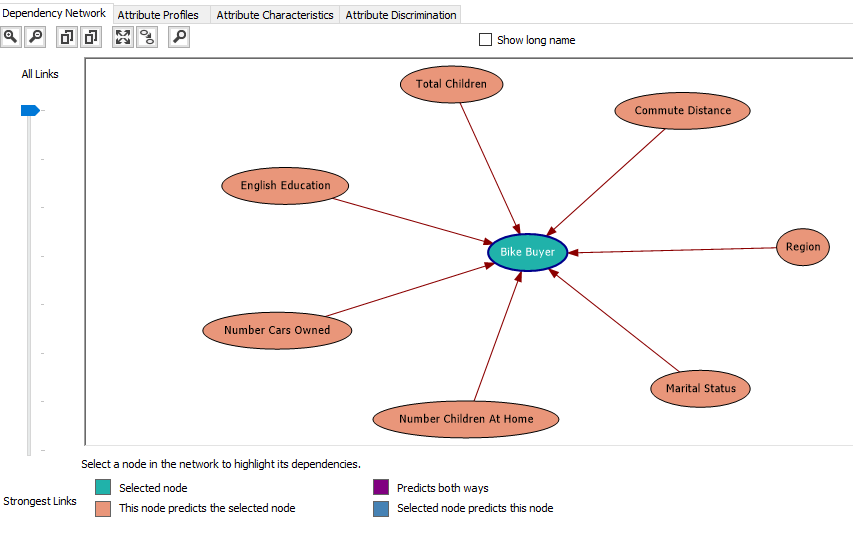
The above image indicates that Total Children, Commute Distance, Region, Marital Status, Number Children at Home, Number Cars Owned and English Education out of the other selected attributes. Out of these attributes, different attributes have different weightages of impacts. This can be identified by moving down the All Links to Strongest Links Slide bar which is at the left-hand side of the screen.
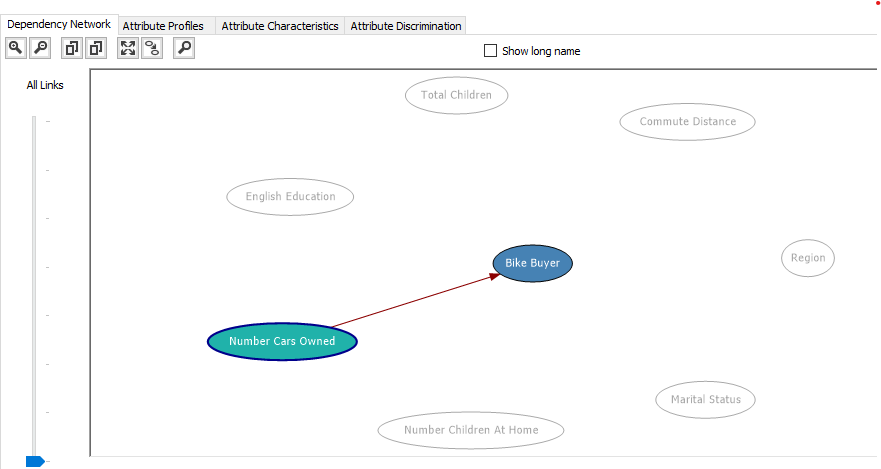
If the slide is at the very lowest place in the slide bar, you will see the strongest link as shown in the below image.
Attribute Profile
In this classification problem, we will have two classes. Buying Bike (1) or Not Buying Bikes (0). Attribute Profile shows how each category has different combinations.
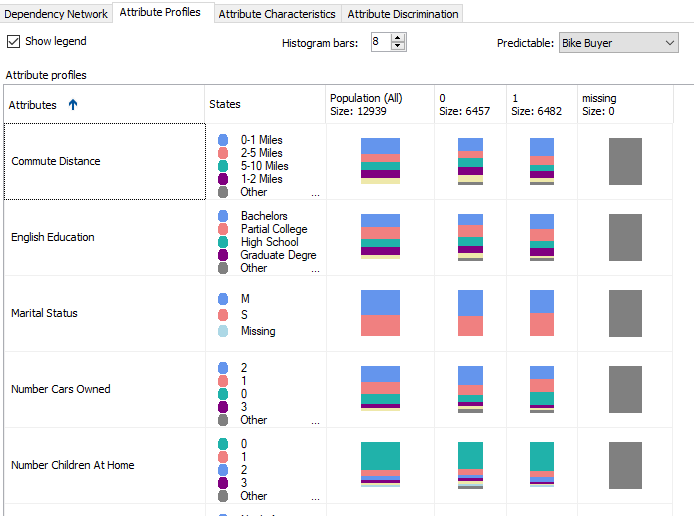
This view can provide you a better view of understanding your data.
Attribute Characteristics
As a user, it would be nice to know what feature will make people buy a car so that they can target the customers who have those attributes.
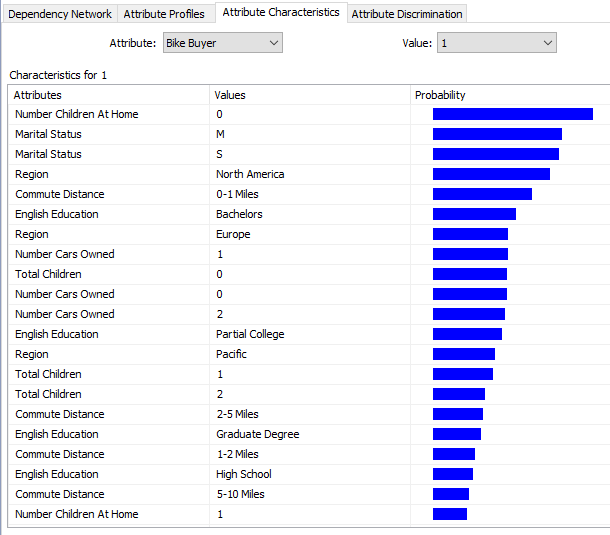
The above image indicates that customers who do not have children at home tend to buy bikes. Also, North America Region and Customers who commute 0-1 Miles will tend to buy bikes. This information is handy for the marketing department so that they can specifically target customers with these parameters.
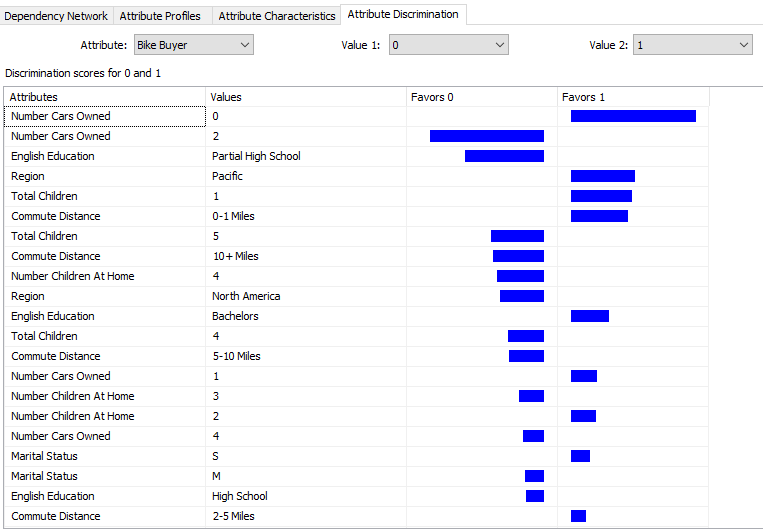
Attribute Discrimination
This tab gives you an answer to the question,” What is the difference between a bike buyer and not bike buyer”.
We will leave the prediction and accuracy calculation in a separate article as it is a discussion for all the algorithms.
Model Parameters
Depending on the environment, there are model parameters for each algorithm. By using these parameters, you can fine-tune the model. In the case of Microsoft Naive Bayes, there are four parameters which can be modified from the Mining Models and by selecting Set Algorithm Parameters from the Mining Model option in the main menu.
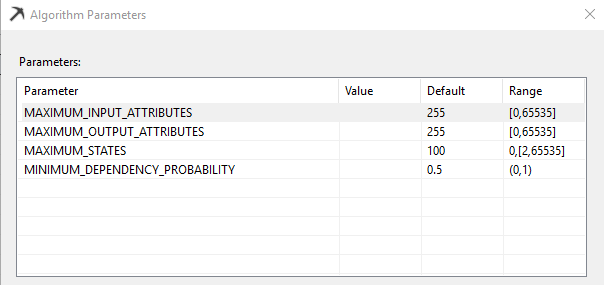
Maximum_Input_Attributes
Specifies the maximum number of input attributes that the algorithm can handle before invoking feature selection. Setting this value to 0 disables feature selection for input attributes. This is an Enterprise edition feature. The default value is 255.
Maximum_Output_Attributes
Specifies the maximum number of output attributes that the algorithm can handle before invoking feature selection. Setting this value to 0 disables feature selection for output attributes. This is an Enterprise edition feature. The default value is 255.
Maximum_States
Specifies the maximum number of attribute states that the algorithm supports. If the number of states that an attribute has is greater than the maximum number of states, the algorithm uses the attribute’s most popular states and treats the remaining states as missing. This is an Enterprise edition feature. The default value is 100.
Minimum_Dependency_Probability
Specifies the minimum dependency probability between input and output attributes. This value is used to limit the size of the content generated by the algorithm. This property can be set from 0 to 1. Increasing this value reduces the number of attributes in the model. If this has a higher values, you might not see some attributes in the Dependency Network. The default value is 0.5.
Limitations of the Microsoft Naive Bayes Algorithm
The major issue is Microsoft Naive Bayes cannot handle continuous data. In the above example, we had to drop the yearly income though it is a very important attribute, simply because that attribute is a continuous variable.
Naive Bayes Algorithm has a basic assumption that input attributes are independent of each other. If you look at the example, we know that Occupation and Qualification have a link between them. However, this algorithm will not be able to understand the relation between inputs.
Summary
Microsoft Naive Bayes algorithm is a basic algorithm when you start into a data mining project. It will provide you a basic understanding about your data.
In the next article, we will discuss Microsoft Decision Trees algorithms.
Table of contents

View all posts by Dinesh Asanka
- Testing Type 2 Slowly Changing Dimensions in a Data Warehouse - May 30, 2022
- Incremental Data Extraction for ETL using Database Snapshots - January 10, 2022
- Use Replication to improve the ETL process in SQL Server - November 4, 2021