
In this article, I am going to demonstrate how to set up Grafana Dashboard for real-time analytics or data monitoring purposes. Grafana is an open-source, cross-platform analytics service tool that can be used to fetch data from several data sources, and then the data can be visualized in a much intuitive way in the form of bars and graphs. This is quite a useful feature for the DevOps or the IT team as it can make their job easier to find abnormalities or spikes in the production environment by observing the logs generated.
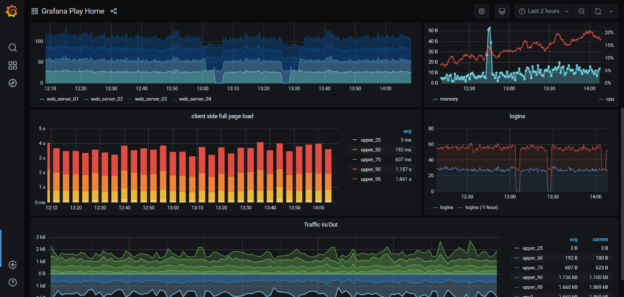
Grafana was first released in 2014 and now has the ability to connect to multiple data sources, including MySQL, SQL Server, Graphite, Prometheus, etc. The most common usage of this tool is to create a time-series data visualization, which depicts the health or usage of a resource over a period of time. These dashboards can be deployed on-premises or on the cloud as required. For the sake of this tutorial, I’m going to use the on-premise version of the tool.

Figure 1 – Grafana Dashboard Demo
We will divide this article into two parts. In the first part, we will create a dummy table in SQL Server, which will simulate live data over time. And in the second part, we will see how to install Grafana on-premises and how to create live dashboards using the dummy data from SQL Server.
Simulating the Real-Time Data in SQL
We will try to simulate live data from a physical sensor that sends temperature and humidity data points every ten seconds. Let us first create a table in which we will write the data generated. You can use the script below to create the table.
|
1 2 3 4 5 6 7 |
CREATE TABLE GrafanaDemo( [DataID] INT IDENTITY, [Metric] VARCHAR(20), [Value] INT, [TimeStamp] DATETIME ) GO |
Let us go ahead and create a stored procedure that will generate random data like temperature and humidity values when executed.
|
1 2 3 4 5 6 7 8 9 10 11 12 13 14 15 16 17 18 19 20 21 |
CREATE PROCEDURE usp_GenerateGrafanaData AS WITH cte_Demo AS( SELECT 'Temperature' AS [Metric] ,FLOOR(RAND()*(80-20+1))+20 AS [Value] ,GETDATE() AS [TimeStamp] UNION SELECT 'Humidity' AS [Metric] ,FLOOR(RAND()*(80-20+1))+20 AS [Value] ,GETDATE() AS [TimeStamp] ) INSERT INTO GrafanaDemo ([Metric],[Value],[TimeStamp]) SELECT * FROM cte_Demo; GO |
Finally, we will create an SQL Agent job that will execute the stored procedure and schedule it to run every ten seconds. This will populate the table with random values for temperature and humidity and will have sufficient values to develop the dashboard. You can use the following script to create the SQL Agent Job or create the same using the UI.
|
1 2 3 4 5 6 7 8 9 10 11 12 13 14 15 16 17 18 19 20 21 22 23 24 25 26 27 28 29 30 31 32 33 34 35 36 37 38 39 40 41 42 43 44 45 46 47 48 49 50 51 52 53 54 55 56 57 58 59 60 61 |
USE [msdb] GO DECLARE @jobId BINARY(16) EXEC msdb.dbo.sp_add_job @job_name=N'SQLShackDemo', @enabled=1, @notify_level_eventlog=0, @notify_level_email=2, @notify_level_page=2, @delete_level=0, @category_name=N'[Uncategorized (Local)]', @owner_login_name=N'sa', @job_id = @jobId OUTPUT select @jobId GO EXEC msdb.dbo.sp_add_jobserver @job_name=N'SQLShackDemo', @server_name = N'.' GO USE [msdb] GO EXEC msdb.dbo.sp_add_jobstep @job_name=N'SQLShackDemo', @step_name=N'Populate Dummy Data', @step_id=1, @cmdexec_success_code=0, @on_success_action=1, @on_fail_action=2, @retry_attempts=0, @retry_interval=0, @os_run_priority=0, @subsystem=N'TSQL', @command=N'EXEC usp_GenerateGrafanaData', @database_name=N'WorkDB', @flags=0 GO USE [msdb] GO EXEC msdb.dbo.sp_update_job @job_name=N'SQLShackDemo', @enabled=1, @start_step_id=1, @notify_level_eventlog=0, @notify_level_email=2, @notify_level_page=2, @delete_level=0, @description=N'', @category_name=N'[Uncategorized (Local)]', @owner_login_name=N'sa', @notify_email_operator_name=N'', @notify_page_operator_name=N'' GO USE [msdb] GO DECLARE @schedule_id int EXEC msdb.dbo.sp_add_jobschedule @job_name=N'SQLShackDemo', @name=N'Run Every Ten Second', @enabled=1, @freq_type=4, @freq_interval=1, @freq_subday_type=2, @freq_subday_interval=10, @freq_relative_interval=0, @freq_recurrence_factor=1, @active_start_date=20200519, @active_end_date=99991231, @active_start_time=0, @active_end_time=235959, @schedule_id = @schedule_id OUTPUT select @schedule_id GO |
When the scheduled job is up and running, you can query the table to see the data that is being generated. You will see new data being written into the table for every ten seconds. This simulated a kind of live data functionality, which can be visualized using the Grafana Dashboard.
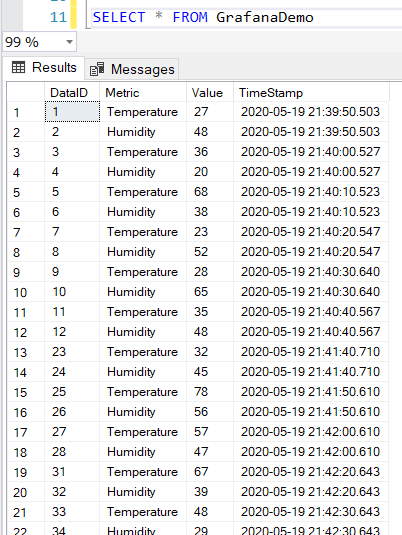
Figure 2 – Live Data Simulated
Download and Install the Grafana Dashboard
Navigate to the official website of Grafana – https://grafana.com/. Move to Downloads and then select Download. This is free and open-source, so you don’t need to pay for any kind of license.
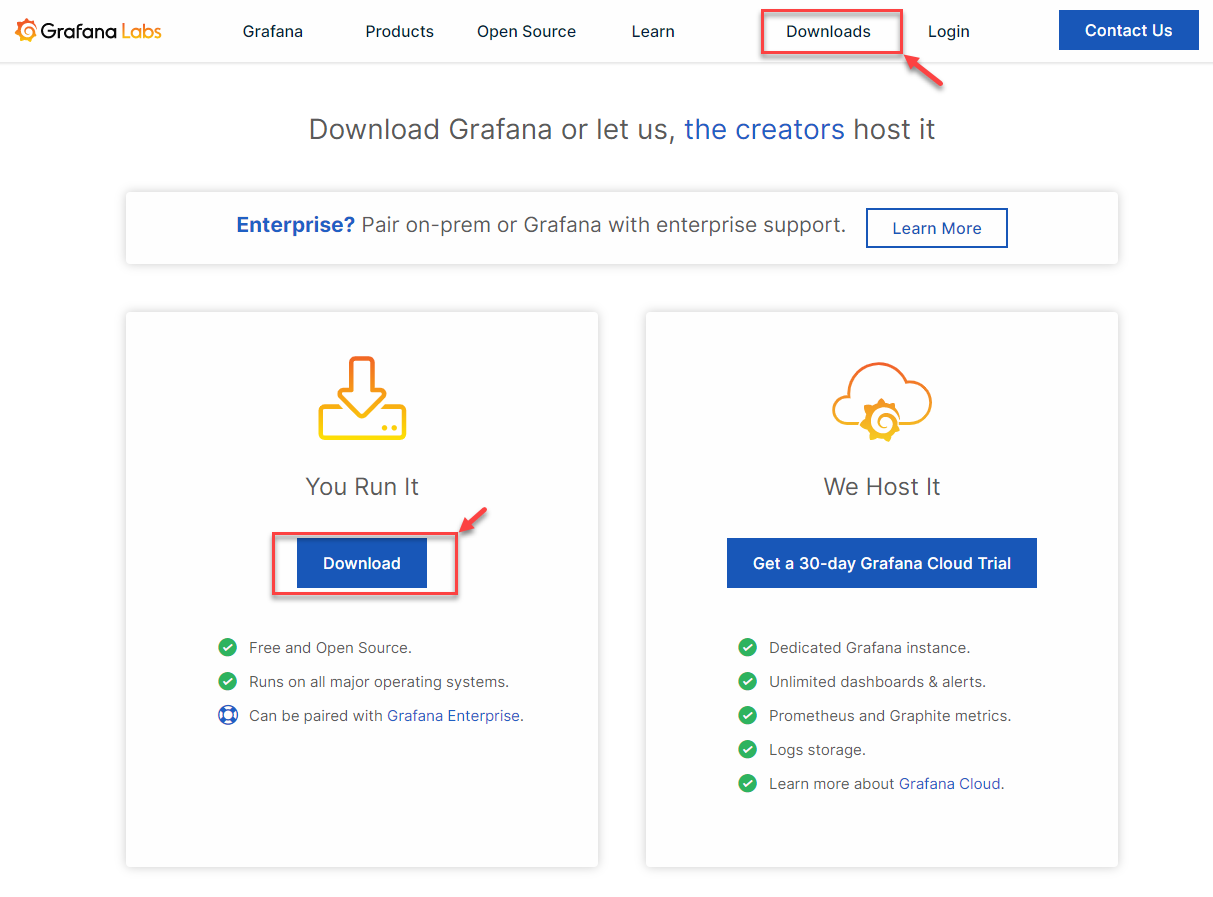
Figure 3 – Download Grafana
In the following page that appears, select the latest version that is available. At the time of writing this article, the latest version is 7.0.0, which might be different at some later point. Select the Edition as Open Source and Platform as Windows. If you want to install the Grafana Dashboard for some other operating systems, you can choose it from this step. Since I am going to install it for Windows, let us go ahead and click the link below, which says – “Download the installer”.
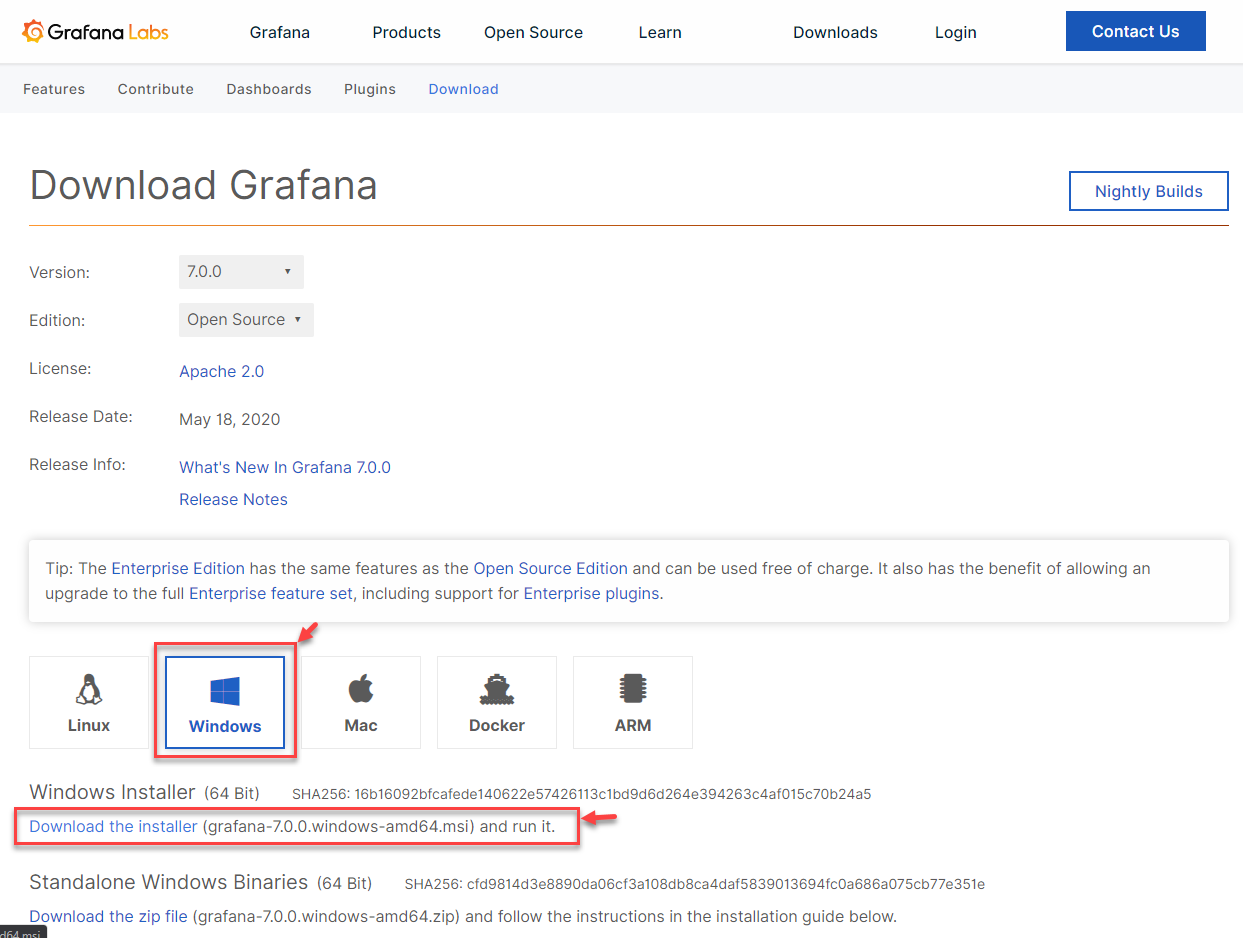
Figure 4 – Download the installer
Once the installer is downloaded, start the installation. Proceed through the steps as required and complete the installation.
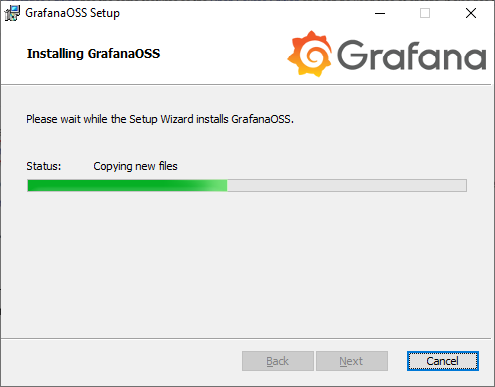
Figure 5 – Installing Grafana
Grafana will be installed in the default location. In my computer, the location is “C:\Program Files\GrafanaLabs\grafana\bin”. There are few files in this directory, out of which I am going to start the “grafana-server.exe”.
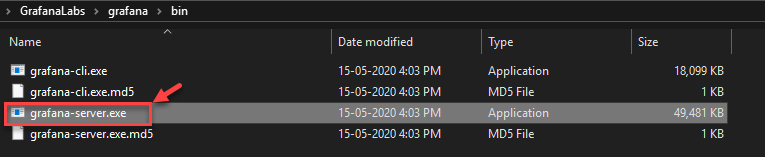
Figure 6 – Starting Grafana Server
Once the server is up and running, you can navigate to http://localhost:3000/ from your browser. This is the default port on which Grafana is installed. You can also configure some other ports in the configuration file. Once you hit the URL, you will be prompted to provide a username and password to log in. By default, the username and password for logging is “admin” and “admin” respectively. Once you log in, you will be asked to change the password for the next logins.
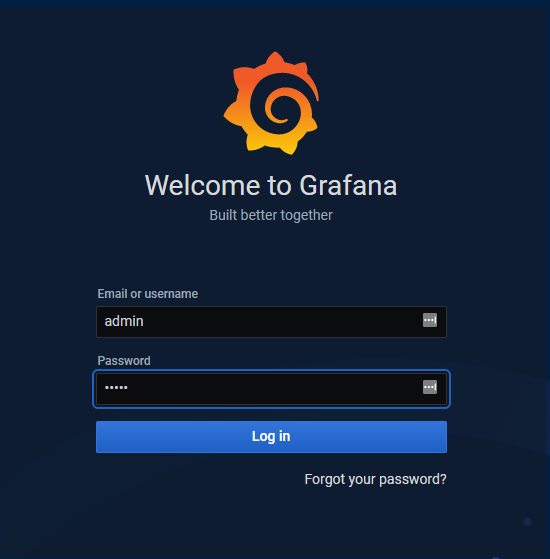
Figure 7 – Login to Grafana
The homepage of the Grafana Dashboard looks something like this.
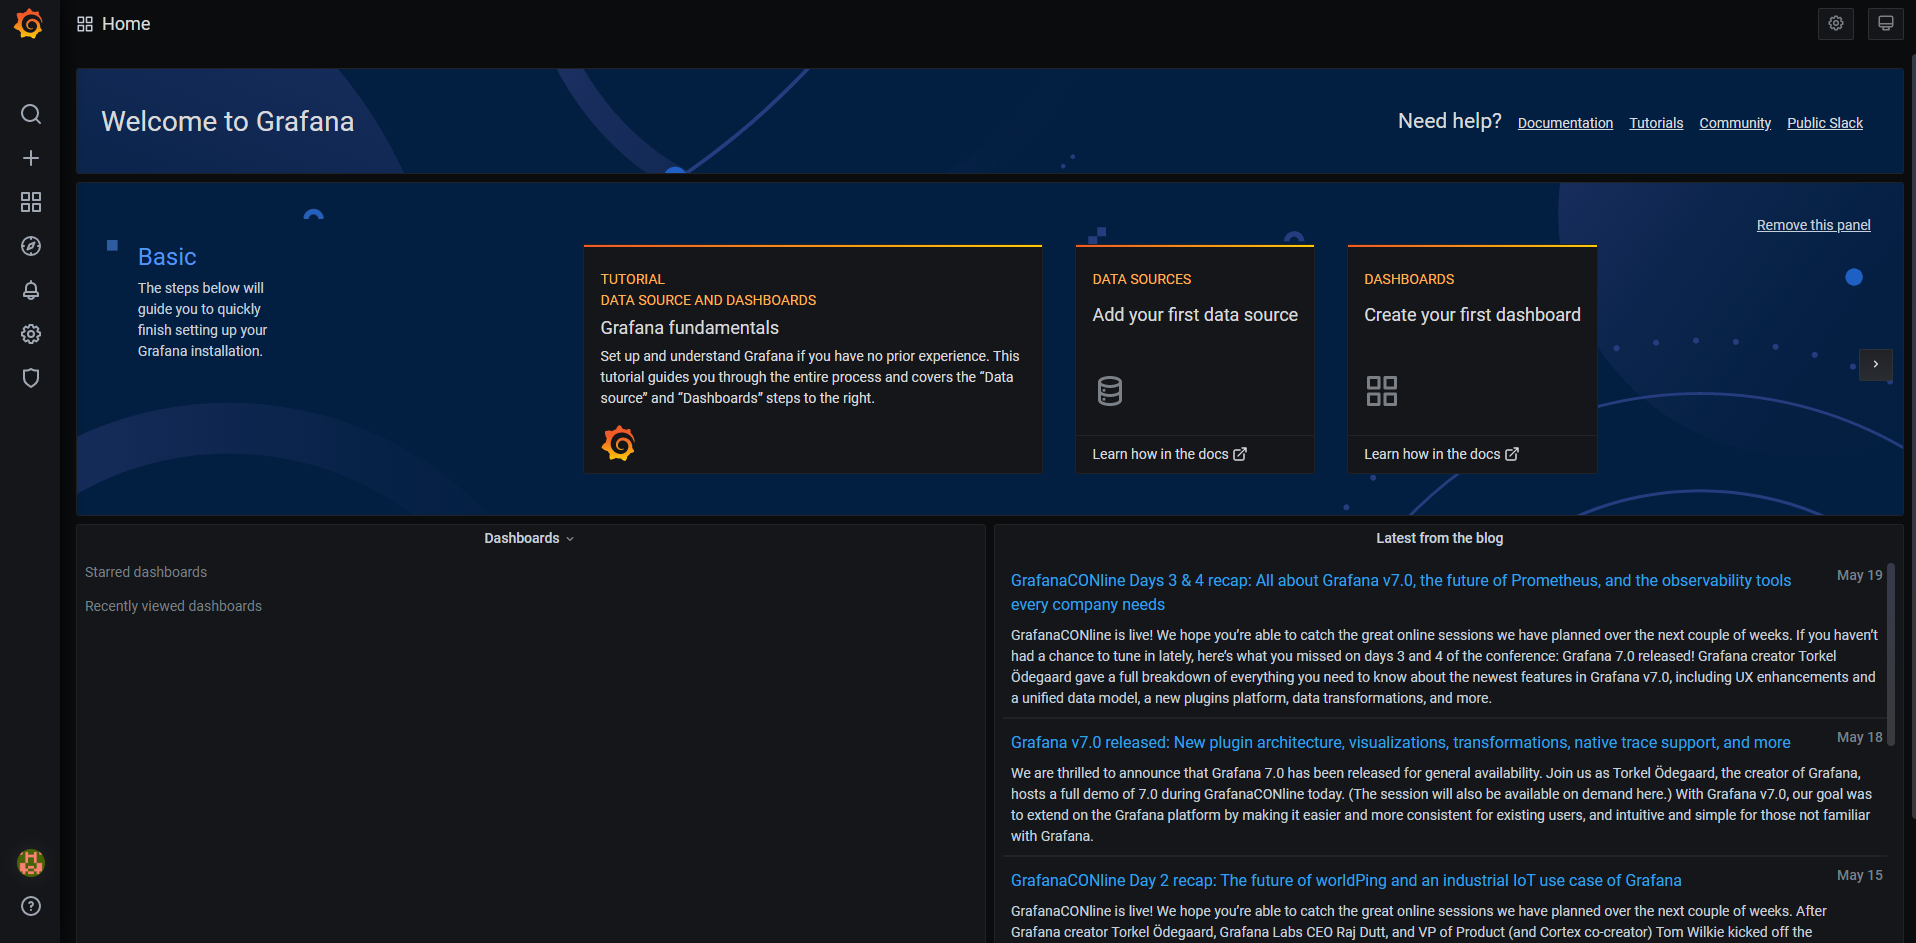
Figure 8 – Grafana Dashboard Overview
Now that we have successfully logged into Grafana, the next step is to add the data source from which we want to fetch the data for visualization. Since we already have prepared our data in SQL Server, let us go ahead and add the data source here. Click on the tile that says – “Add your first data source”.

Figure 9 – Adding Data Source
You will be redirected to the Add Data Sources page, where there are options to add a data source from many available options. If you scroll below, you can see the option to add Microsoft SQL Server under the SQL category. Click on Select to proceed.
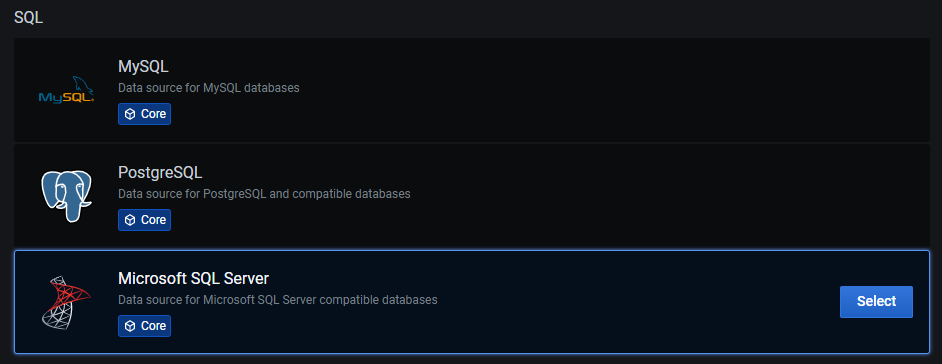
Figure 10 – Select Microsoft SQL Server
In the next step, you can add the connection details to the SQL Server Database. You need to provide the hostname, the database name, and an SQL username and password. Grafana does not support Windows Authentication now, so using the SQL username and password is the only option. If you do not have any SQL User, please go ahead and create one before continuing further. Click on Save and Test once completed.
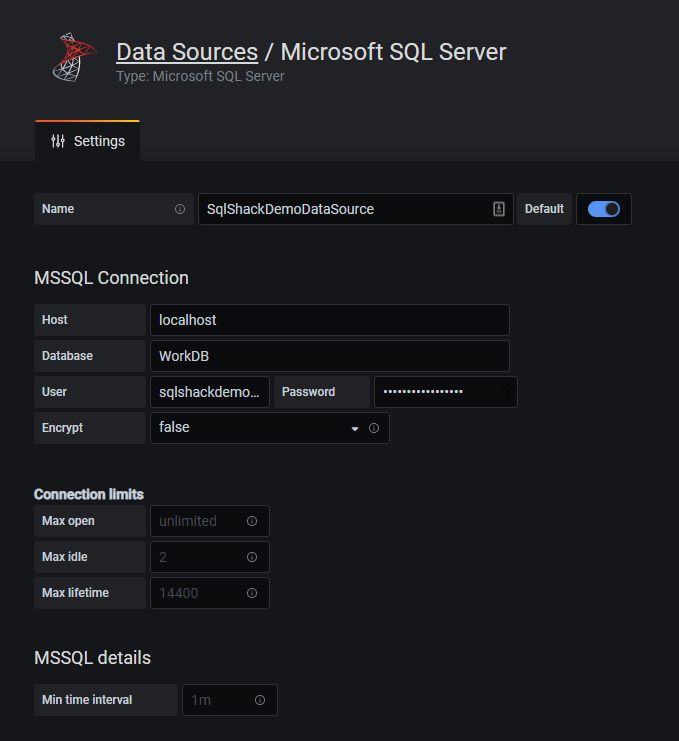
Figure 11 – Adding Data Source Details for SQL Server
If the connection is successful, you will receive a notification as follows.

Figure 12 – Database Connection OK
Creating the Dashboard
Once the data source has been added successfully, we can now go ahead and create the dashboard. On the left panel, click on Add and select Dashboard.
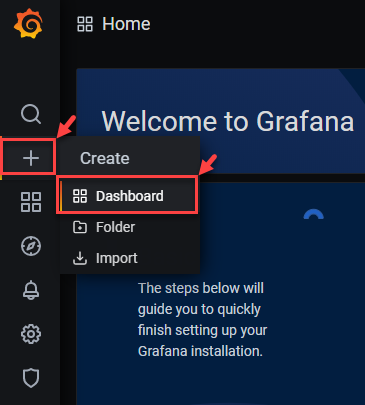
Figure 13 – Create Dashboard
In the new dashboard, click on Add New Panel.
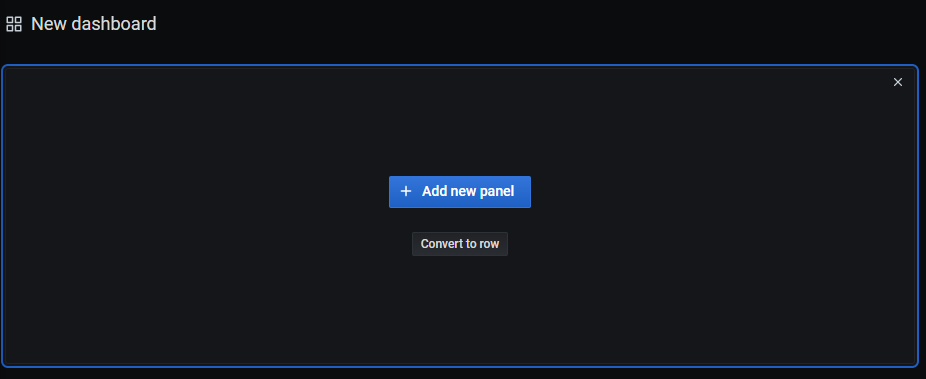
Figure 14 – Add New Panel
A new default panel will appear with a dummy dataset. We need to change the data source and select the SQL Server data source.
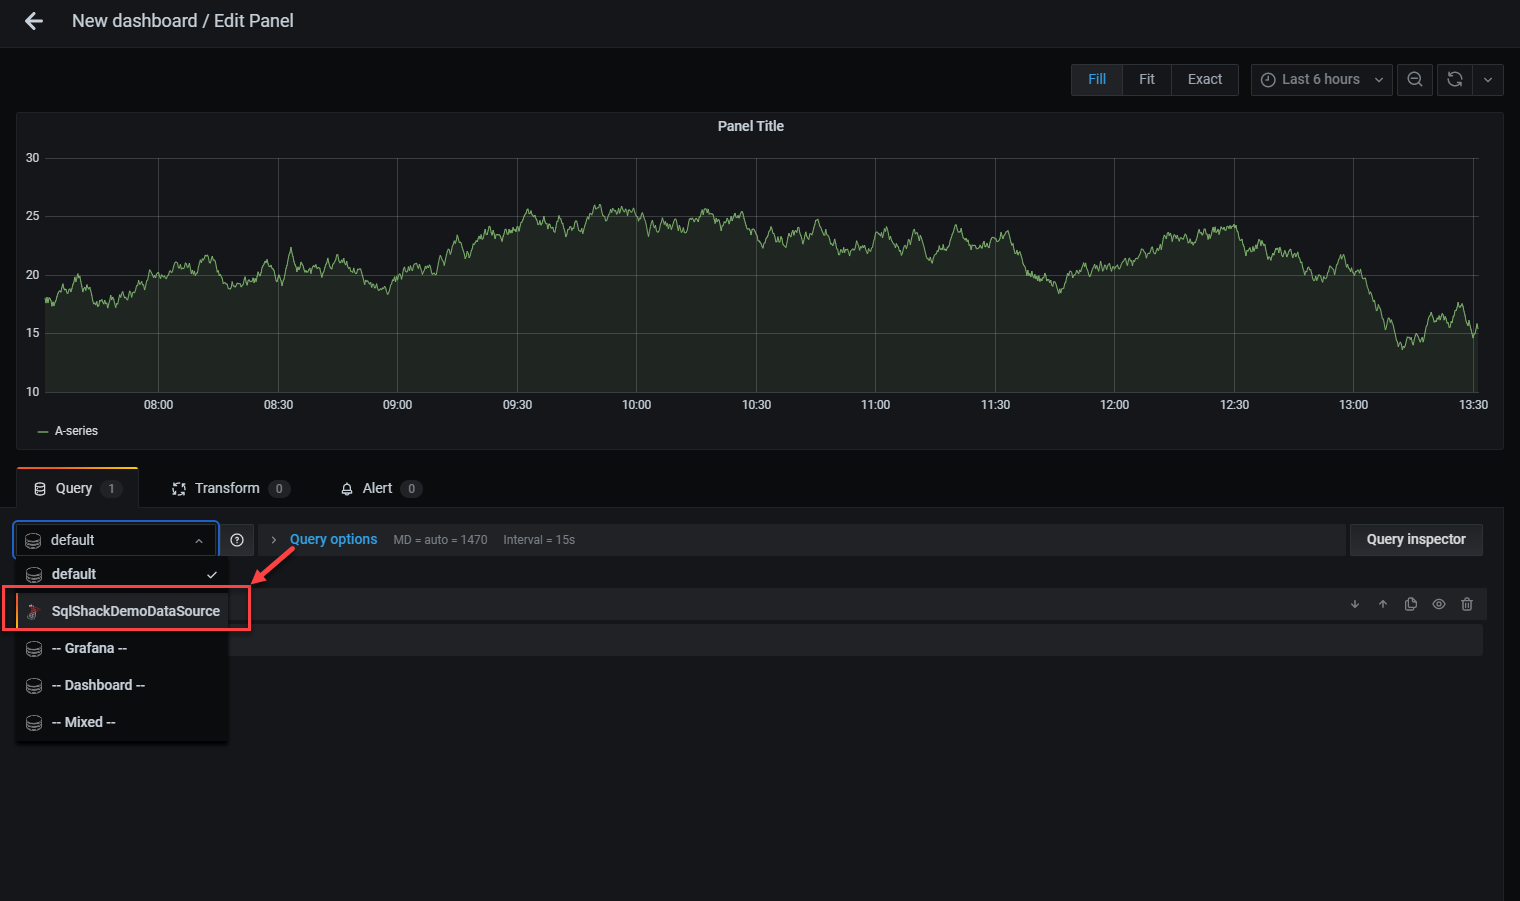
Figure 15 – Changing the Data Source
As soon as you change the data source, the chart will start displaying empty results because there is no query specified to fetch the data yet. You would need to write the query to fetch the real-time data from the table that we created. Using this data, the graph will be generated. I have provided the query below. Additionally, we would also like to refresh the dashboard every ten seconds, for which we need to configure the value for Min Interval to “10s”.
|
1 2 3 4 5 6 7 8 9 10 |
SELECT $__timeEpoch([TimeStamp]), [Value] as value, [Metric] as metric FROM [GrafanaDemo] WHERE $__timeFilter([TimeStamp]) ORDER BY [TimeStamp] ASC |
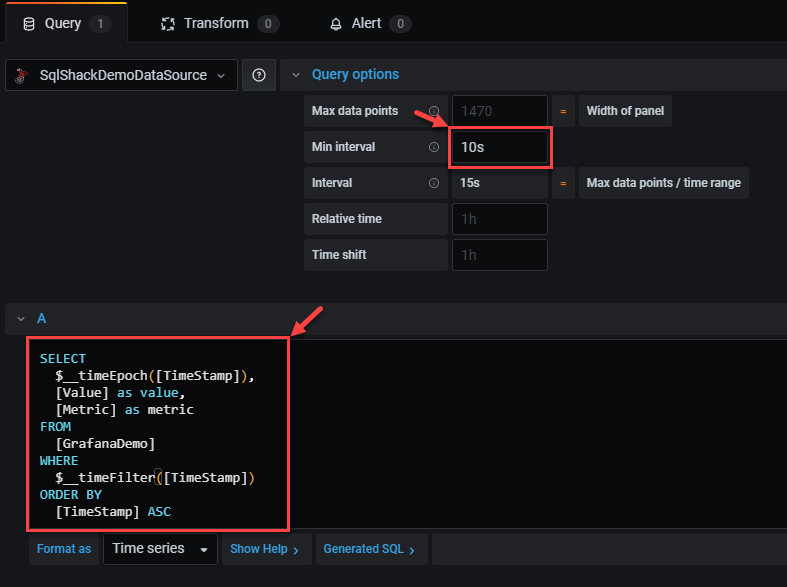
Figure 16 – Grafana Query
This is how the time-series panel looks once the query is executed. For a better visibility, I have selected the time range to “Last 5 minutes”, you can change it to whatever you desire. Click on Apply once you are done.
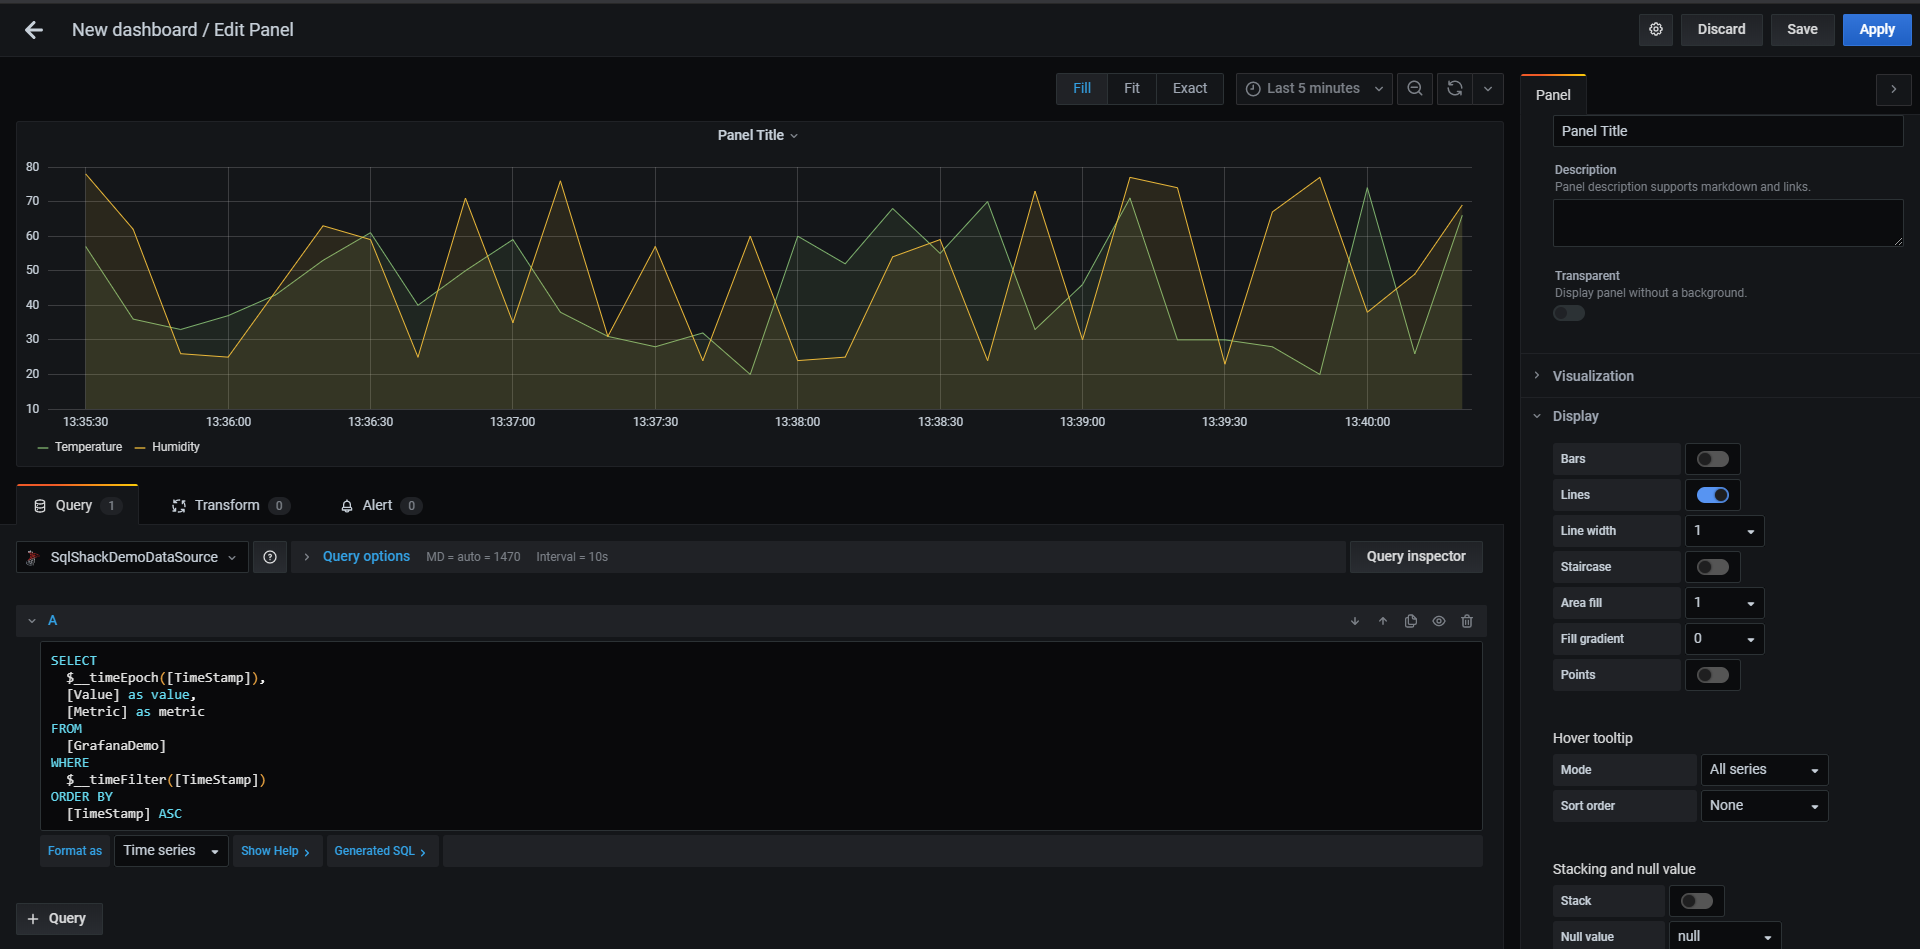
Figure 17 – Time Series Panel Created
As you can see, a dashboard is made up of multiple panels, so we can add as many panels as required to a dashboard. Each of these panels can be configured separately, which increases the flexibility of the application to a further extent. You can pick from several different panel types to create from.
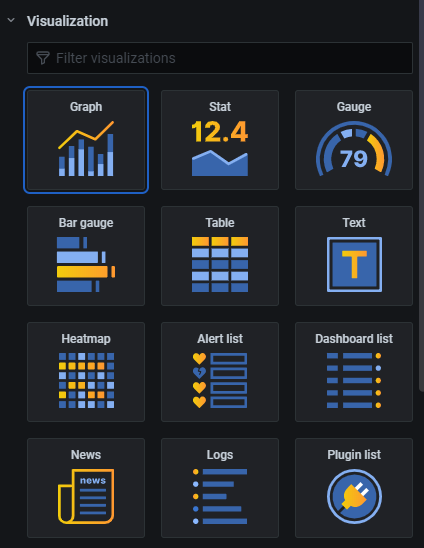
Figure 18 – Visualization Types
Conclusion
In this article, we have seen what Grafana Dashboard is and how to configure it. We have created some dummy data in SQL Server which can simulate live changing data, and that can be fetched using Grafana and visualized. In my opinion, it is a great tool to get started with monitoring live resources from the production environment as it is free of cost and easy to install and use. The dashboards can be easily created with some basic knowledge of SQL and can be set to refresh on a schedule.

He is a prolific author, with over 100 articles published on various technical blogs, including his own blog, and a frequent contributor to different technical forums.
In his leisure time, he enjoys amateur photography mostly street imagery and still life. Some glimpses of his work can be found on Instagram. You can also find him on LinkedIn
View all posts by Aveek Das
- Getting started with PostgreSQL on Docker - August 12, 2022
- Getting started with Spatial Data in PostgreSQL - January 13, 2022
- An overview of Power BI Incremental Refresh - December 6, 2021