Business Intelligence

Ben Richardson
A bar chart which is the output of applying the advanced filter

Power BI Visuals: Working with Filters

August 18, 2020 by

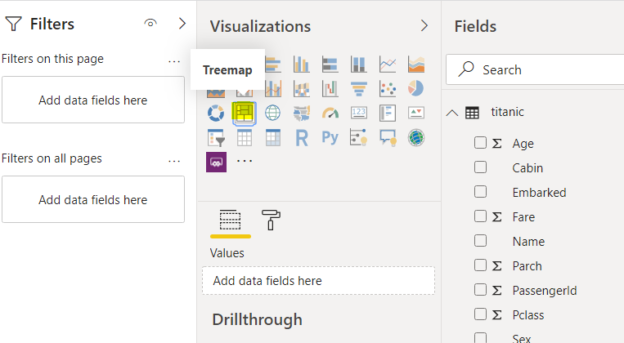
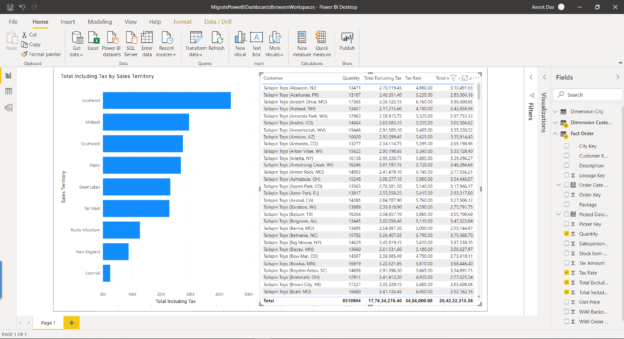
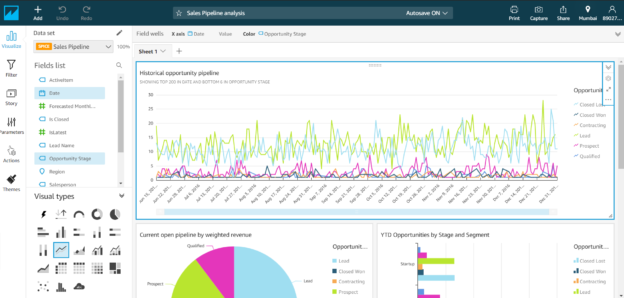
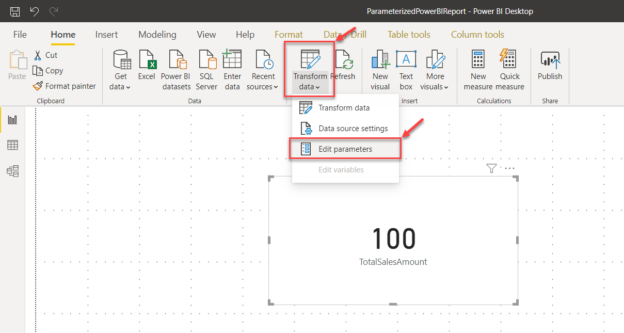
Power BI is a data analytics tool that can be used to analyze data with the help of Power BI visuals.

Power BI is a Microsoft application and is available as a desktop application as well as a cloud service. It comes with a variety of visual and filtering options that can be used to create Power BI visuals.

Read more »
Ben Richardson
Selecting the treemap visualisation to add on to our report.

Power BI Visuals: Working with Treemaps and Tables

August 6, 2020 by

In this article, you will learn how to work with Treemaps and Tables, which are two of the most commonly used Power BI visuals. You will also see how slicers can be used in Power BI to dynamically update the data in Treemaps and Tables. Power BI Visuals are extremely easy to create and don’t require you to write any code.

Read more »
Aveek Das
Power BI Report

Working with Power BI Data Models in Visual Studio Code

July 30, 2020 by

In this article, I am going to introduce the Tabular Object Model (TOM) in the Power BI Data Model and provide an understanding of how this model can be accessed outside of the Power BI environment. For more info about the Tabular Object Model in the Power BI Data Model, please read this article. In this tutorial, we are going to use the Visual Studio Code to simply write a dotnet console application and try to access the Tabular Object Model from the Power BI file. With the help of this knowledge, programmers and BI developers can not only view the underlying model in the Power BI Data Model but also can enhance the data model programmatically by writing a few lines of code. It can also be further improved by automating the creation of the Power BI models with the help of the Tabular Object Model library in dotnet.

Read more »
Dinesh Asanka
Example of SSAS Dimension Hierachies from Sale sterritory Dimension.

Enhancing Data Analytics with SSAS Dimension Hierarchies

July 22, 2020 by

Introduction

This article will discuss how SSAS Dimension Hierarchies can be used to analyze data much efficiently. If you are a data analyst, you want to start the analysis with a higher hierarchy. Then navigate the narrow attributes when required. For example, it will be better to start with analyzing revenue by year. If you need to analyze further into the data, you can choose the needed year and expand the Quarter -> Month, respectively. Let us see how we can create SSAS Dimension Hierarchies in OLAP Cubes to suit different requirements.

Read more »
Aveek Das
Creating the report from the Data Model

Migrate Power BI reports between multiple workspaces

July 14, 2020 by

In this article, I am going to explain how we can create a Power BI Report using the Power BI Desktop and then publish it to the Power BI service workspace. Once the report is published to a workspace, we can also consider migrating the same report across several workspaces and all this can be done programmatically by using the Power BI REST APIs. This article is specially targeted towards Power BI admins or DevOps team whose task is to migrate dashboards between various environments like Development, QA, Production, etc. without any manual intervention of the reports.

Read more »
Aveek Das
SSIS Project executed

Getting started with SSISDB

July 13, 2020 by

In this article, I am going to explain how to start using the SSISDB database, also known as the SSIS Catalog database. In my previous article, I have provided an overview of this SSIS catalog database in detail. I would recommend you read that article, before moving on further with this if you want to understand how the SSIS catalog database works. The SSIS catalog database is one single database in which you can deploy all your SSIS packages and then organize and manage those packages centrally.

Read more »
Dinesh Asanka
Creating OLAP Perspectives

Improve readability with SSAS Perspectives

July 9, 2020 by

Introduction

In this article, we will be looking at a feature of SQL Server Analysis Service (SSAS) OLAP Cube that is SSAS Perspectives. We discussed creating SSAS OLAP Cubes in a previous article: OLAP Cubes in SQL Server. In an SSAS OLAP cube, there can be a large number of measures, dimensions and dimension attributes. The following screenshot is the star schema for the selected example that was created from the AdventureWorksDW sample database that can be visible at Data Source View.

Read more »
Aveek Das

Introduction to the SSIS Catalog database (SSISDB)

July 7, 2020 by

In this article, I am going to explain in detail the SSIS catalog that can be used to deploy SQL Server Integration Services (SSIS) projects. Using this catalog, developers and database administrators can easily deploy and manage their integration services projects after deployment. The SSIS Catalog database was introduced in SQL Server 2012 and prior to that users had the following three options to deploy their SSIS packages:

Read more »
Aveek Das
Add users to Power BI

Add users to a Power BI workspace using PowerShell

July 6, 2020 by

In this article, I am going to explain how to add users to a Power BI workspace using Power BI PowerShell. As you already know, Power BI is a business intelligence tool from Microsoft, using which we can build graphical reports and dashboards which bring some sense to our data that resides on the database. Power BI also has a web interface known as the Power BI service, which can be used to share and collaborate these reports and dashboards with multiple users within or out of the organization.

Read more »
Aveek Das

Understanding SSIS memory usage

July 3, 2020 by

In this article, I am going to explain in detail SSIS memory usage and how can we optimize our tasks and the data flow to leverage maximum benefits from the in-memory operating tool. As you might be aware, SSIS also known as SQL Server Integration Services is a data integration tool, provided by Microsoft which comes shipped with the SQL Server editions. SSIS is an enterprise-scale, in-memory data integration tool which can be used to move data between different databases or different servers in a comfortable yet manageable way.

Read more »
Dinesh Asanka
Final package after inclusion of Conditional Split.

Using the SSIS Script Component as a Data Source

June 25, 2020 by

Introduction

SSIS Script component is one data transformation tasks in SQL Server Integration Services (SSIS). SSIS is an integration tool in the Microsoft BI family to extract data from heterogeneous data sources and transform it to your need. Apart from the standard data sources such as databases, text files, excel files, and web services, there can be instances where you need to retrieve non-traditional data sources. For example, let us say you want to extract the details of text files such as file sizes, created date, etc. In these types of scenarios, traditional data sources cannot be used.

Read more »
Aveek Das
Sample Analysis - Sales Pipeline

Getting started with Amazon QuickSight

June 18, 2020 by

In this article, I am going to introduce Amazon QuickSight and how to visualize data using it. Amazon QuickSight is a data visualization tool offered by Amazon hosted on AWS and is available across multiple locations. As per the statement provided on the official website it says: “Amazon QuickSight is a fast, cloud-powered business intelligence service that makes it easy to deliver insights to everyone in your organization.” Using QuickSight, users can create different analyses and then integrate those in a dashboard and share them with people within the organization.

Read more »
Aveek Das
Edit Parameters

Getting started with parameterized Power BI reports

June 16, 2020 by

In this article, I am going to explain how we can develop parameterized Power BI reports locally and then migrate the same report across multiple environments, like development, QA, and production. Parameterized Power BI reports are essential because we can use the same report to develop the charts and the KPIs and then provide the same report to the QA who will test it on a separate environment and finally when the testing is completed, it can then maybe provided to an administrator who can publish it to the production workspace.

Read more »
Aveek Das
Creating the Date Dimension in Power BI

Using a Date Dimension Table in Power BI

June 5, 2020 by

In this article, I am going to describe how to use a date dimension table in Power BI. Using a date dimension table becomes extremely important while visualizing facts and figures over some time in the calendar. Sometimes it is possible that we do not have the continuous date values in our dataset that we are trying to work upon.

Read more »
Aveek Das
Microsoft Power Platform - Virtual Agents

A quick overview of the Microsoft Power Platform

June 2, 2020 by

In this article, I am going to explain the various products offered by the Microsoft Power Platform. Microsoft Power Platform is a group of products offered by Microsoft to develop and build complex business solutions, analyze, and draw data visualizations, automate a business process, or build virtual agents for communication. All these products offer a platform in which no code is required to build the applications. These products are in the form of simple GUI which can be used by any business users or developers, thus helping to reduce the need for IT in the organization.

Read more »
Aveek Das
Grafana Dashboard Demo

Overview of the Grafana Dashboard with SQL

June 2, 2020 by

In this article, I am going to demonstrate how to set up Grafana Dashboard for real-time analytics or data monitoring purposes. Grafana is an open-source, cross-platform analytics service tool that can be used to fetch data from several data sources, and then the data can be visualized in a much intuitive way in the form of bars and graphs. This is quite a useful feature for the DevOps or the IT team as it can make their job easier to find abnormalities or spikes in the production environment by observing the logs generated.

Read more »
Aveek Das
Power BI File Generated

Programmatic access to Power BI PowerShell commandlets

May 25, 2020 by

In this article, I am going to demonstrate how to access the Power BI PowerShell commandlets. In the previous article in this series, we discussed how to programmatically access the Power BI Service using the REST APIs available. PowerShell is one of the most frequently used and preferred ways of automating monotonous manual jobs and scripting those. PowerShell comes integrated with Windows, so it can be easily used from any Windows machine.

Read more »