
In this article, I am going to explain how we can develop parameterized Power BI reports locally and then migrate the same report across multiple environments, like development, QA, and production. Parameterized Power BI reports are essential because we can use the same report to develop the charts and the KPIs and then provide the same report to the QA who will test it on a separate environment and finally when the testing is completed, it can then maybe provided to an administrator who can publish it to the production workspace.
To develop parameterized Power BI reports, we would need to parameterize our data source connection in the Power BI reports while establishing the connection to the source databases. Another important thing to keep in mind for this is to have the source database schema the same across all the environments. This means that the structure of the tables and relationships in the databases must be the same in all the environments. If there are any discrepancies within the schema then the Power BI reports will fail and no longer work as intended.
Preparing the Database Environment
To develop parameterized Power BI reports, we would need to have three different data sources from which we can fetch data into the Power BI environment. Let us now go ahead and prepare our database environment first. In the database server, we are going to create three different databases, one for each development, QA, and production environments. Although in a real scenario, the servers and the databases will be in complete isolation, however, for the sake of this tutorial, we will keep the databases in the same server itself. Head over to SQL Server Management Studio and create the databases. I am going to call the databases as “SQLShackDemo_DEV”, “SQLShackDemo_QA” and “SQLShackDemo_PROD”. You can run the following script to create the databases on your machine:
|
1 2 3 4 5 6 7 |
-- Creating the databases CREATE DATABASE SQLShackDemo_DEV GO CREATE DATABASE SQLShackDemo_QA GO CREATE DATABASE SQLShackDemo_PROD GO |
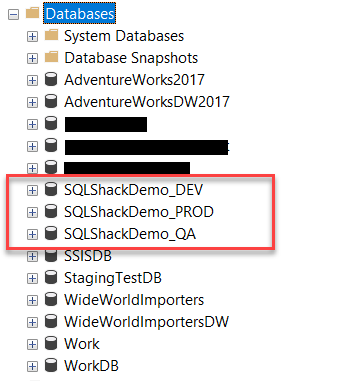
Figure 1 – Creating the databases
Once the databases are created, let us go ahead and create the tables in it for development, QA, and production. To keep things simple, I am going to add a table called “FactSales” and add only one column “TotalSalesAmount” to all the three tables in the databases. You can add as many tables and columns as you want. Please note that it is extremely mandatory to have the schema exactly the same for the three databases or data sources in order to parameterize the data sources. If the schema is not the same, then the parameterized Power BI report would not be able to fetch the data and hence fail while refreshing the reports. You can use the script below to create the three tables under the databases and insert some test data into it:
|
1 2 3 4 5 6 7 8 9 10 11 12 13 14 15 16 17 18 19 20 21 22 23 24 25 26 |
-- Create the tables under each database USE SQLShackDemo_DEV GO CREATE TABLE FactSales( TotalSalesAmount INT ) GO USE SQLShackDemo_QA GO CREATE TABLE FactSales( TotalSalesAmount INT ) GO USE SQLShackDemo_PROD GO CREATE TABLE FactSales( TotalSalesAmount INT ) GO -- Insert sample data into the tables INSERT INTO SQLShackDemo_DEV.dbo.FactSales VALUES (100) INSERT INTO SQLShackDemo_QA.dbo.FactSales VALUES (800) INSERT INTO SQLShackDemo_PROD.dbo.FactSales VALUES (5000) |
With this, we have completed our database development. Now let us move to the Power BI Report development.
Developing the Power BI Report
Now that our database environment has been set up, we are ready to start working on the Power BI report. Open Power BI Desktop and click on File. On the menu that appears, select Options and settings, and then select Options. The Options dialog box opens up. Under the Global pane on the left, click on Power Query Editor, and under the Parameters heading, select the checkbox which says, “Always allow parameterization in data source and transformation dialogs”. Click on OK once done:
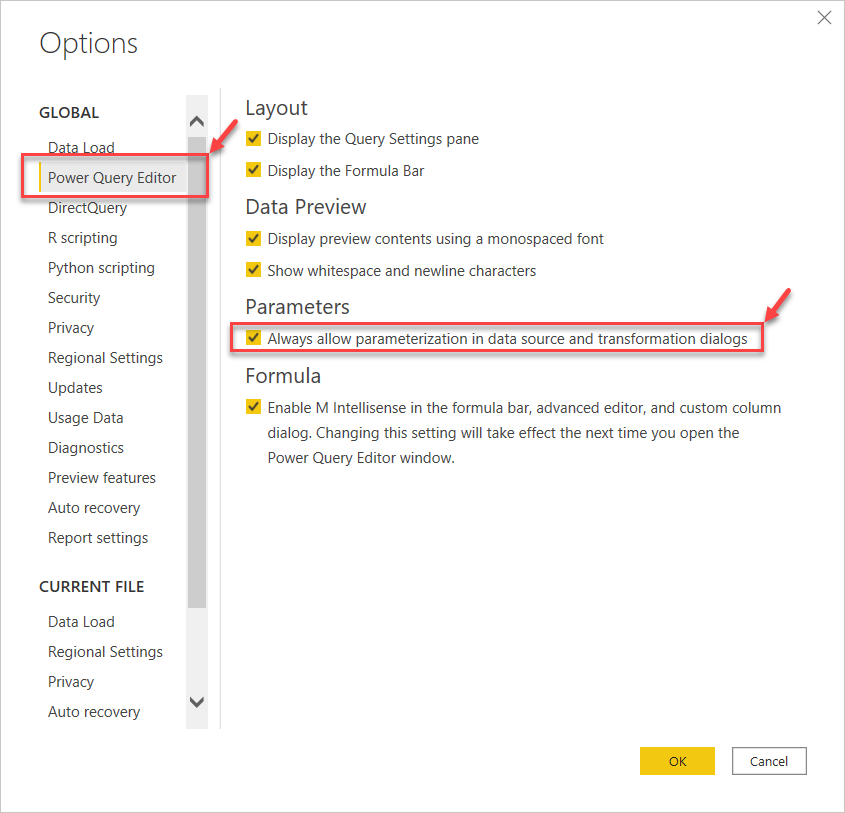
Figure 2 – Enabling the parametrization in Power BI Desktop
Once the parametrization of data sources is enabled, let start to bring in the data from the SQL Server. Click on Get Data and select SQL Server from the drop-down menu:
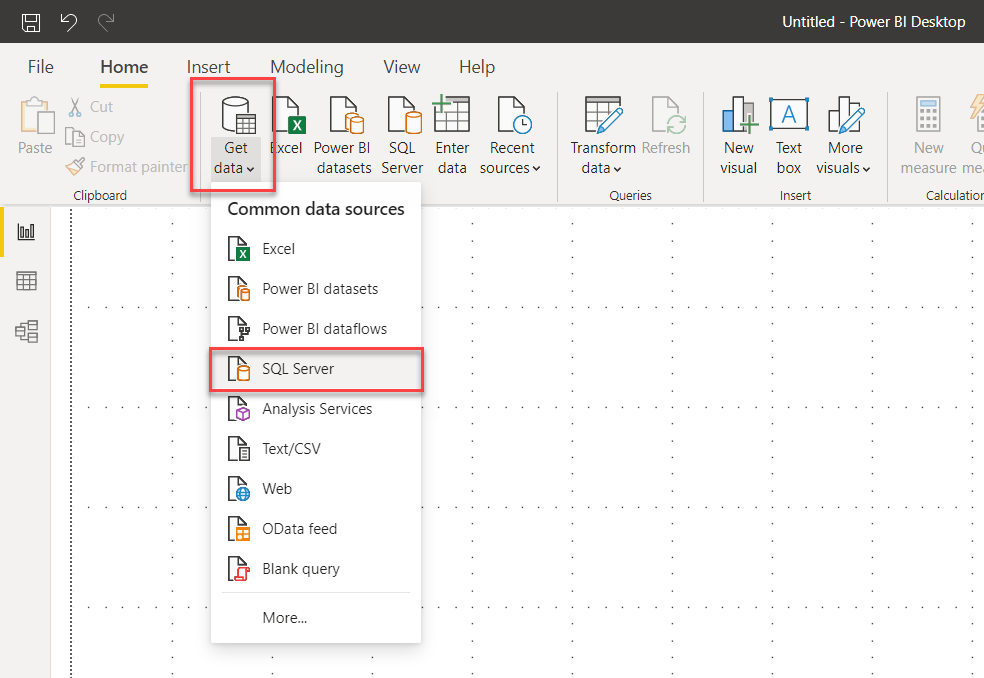
Figure 3 – Fetching data from SQL Server into Power BI
Now as you can see, we have a drop-down box available to specify if the data source is a simple text value or it is a parameter. Since we want to parameterize our data source, we will go ahead and select the New Parameter from the drop-down menu and click OK:
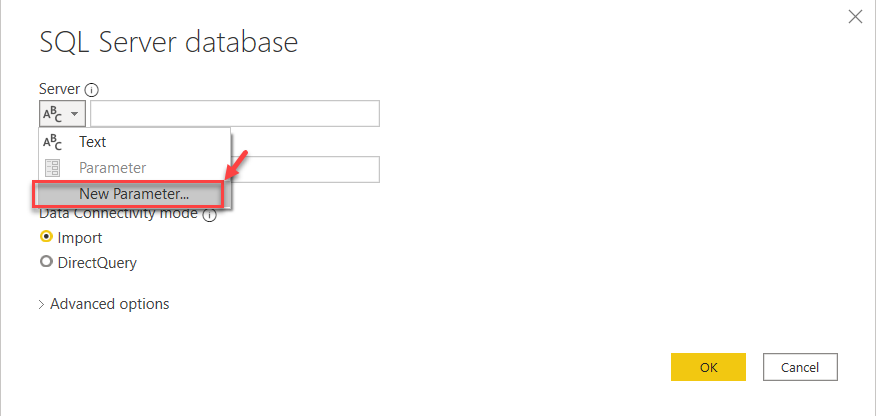
Figure 4 – Selecting New Parameter for data source
The Manage Parameters dialog box opens up. In this, you can name your parameters and provide values for the connection string as well. Since we are going to parameterize our data source, let us name this as “DataSource” and enter the Current Value as “localhost”. You need to provide the name of your server on which the database is created. Click OK once done:
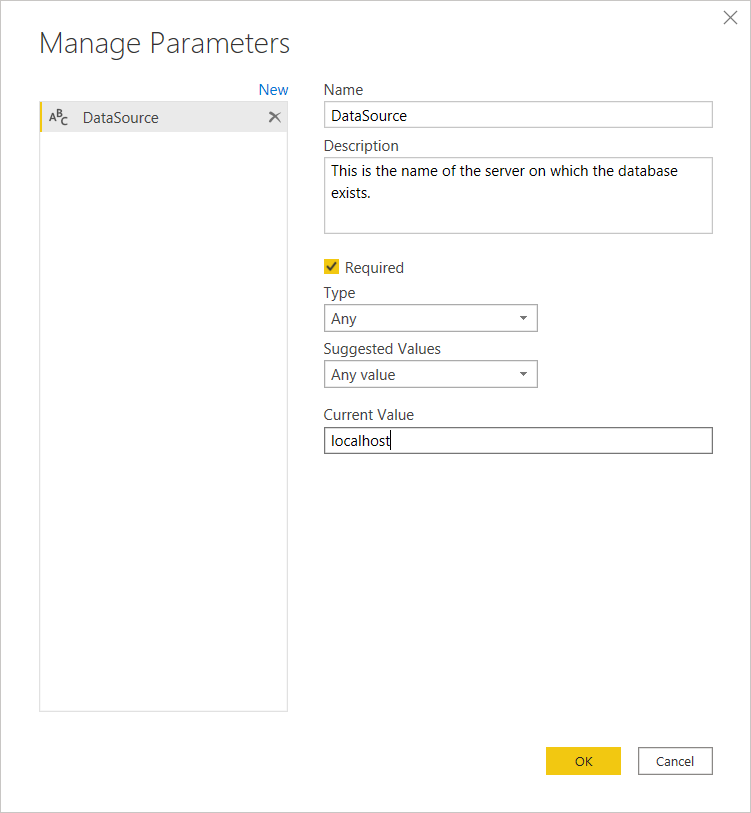
Figure 5 – Specifying the Data Source Parameter
Repeat the same for specifying the catalog name as a parameter. Provide the name of the development database as the Current Value. Click OK once done:
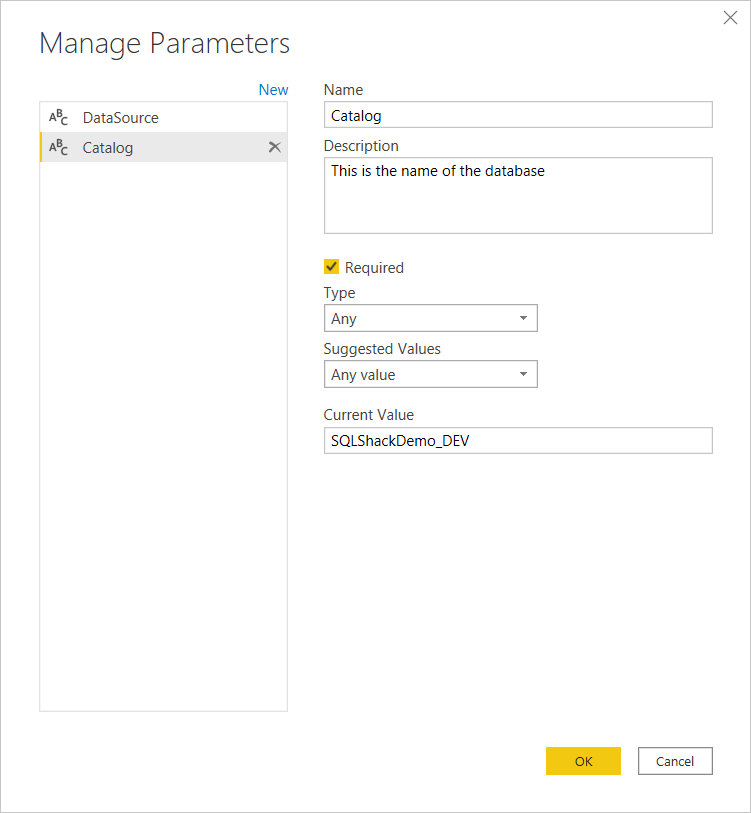
Figure 6 – Specifying Catalog Name as the parameter
Finally, select Data Connectivity mode as Import and click on OK. This will bring in the data from the SQL Server into the parameterized Power BI report:
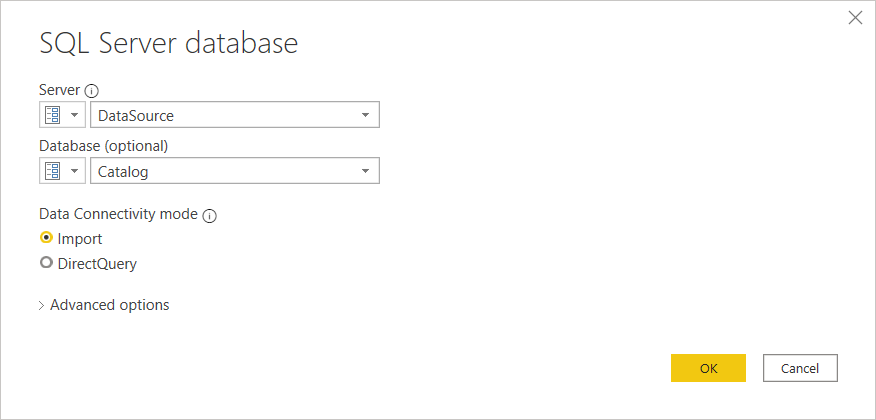
Figure 7 – Import Data
Once the connection is established with the SQL Server database, you will see and option to import the tables that you need to import. Since we have only one table, we will go ahead and fetch it into Power BI. Click Load once done:
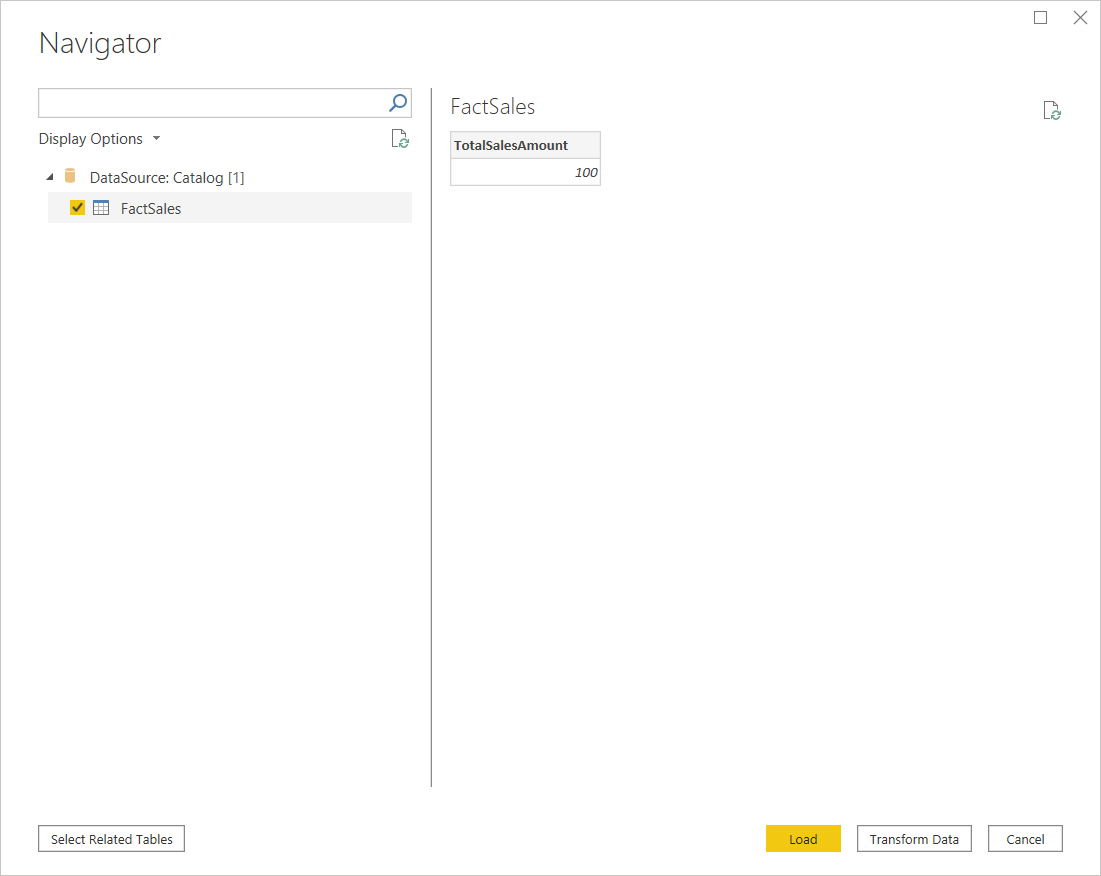
Figure 8 – Fetch data from FactSales
Since we have only one field in the table (TotalSalesAmount), let us create a card visual to display the value. In the development environment, we have inserted the value as “100” which is visible in the report as follows.
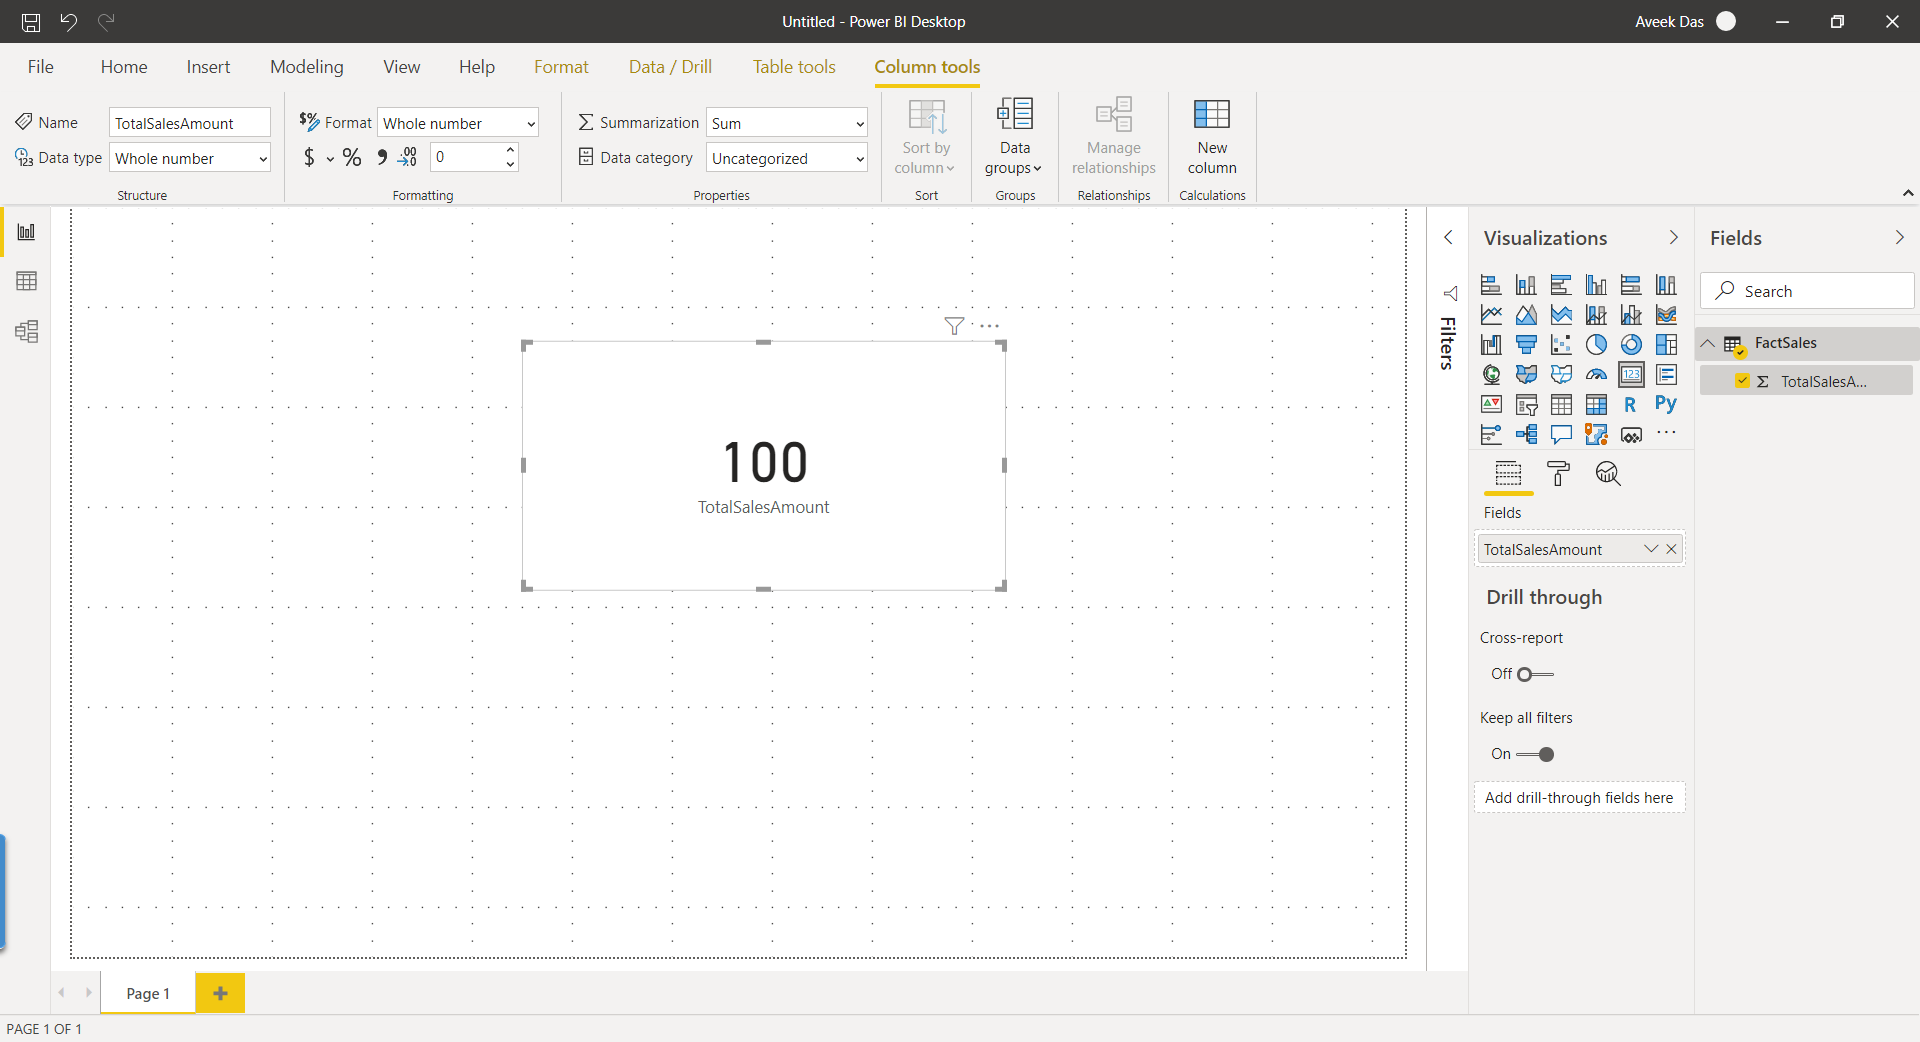
Figure 9 – Capturing data from Development Environment
Changing the parameters
Now that our initial report from the development database is built and we can visualize the data, let us move ahead and try to change the connection parameters and point the data source to the QA database.
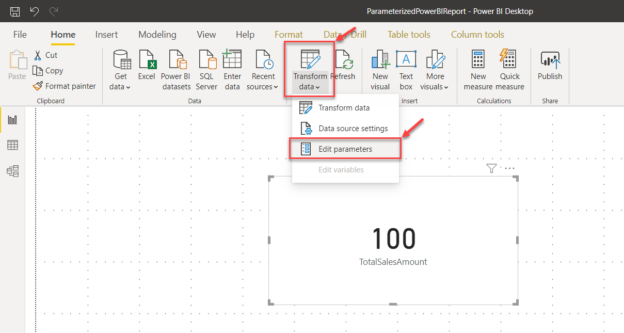
Head over to the Transform data tab on the menu bar and select Edit Parameters from the drop-down menu:

Figure 10 – Edit Parameters
In the Edit Parameters dialog box, alter the name of the catalog to point it to the QA environment. In this case, we will rename it to “SQLShackDemo_QA” and click OK. Finally, click on the Apply Changes button to go ahead and refresh the Power BI dataset:
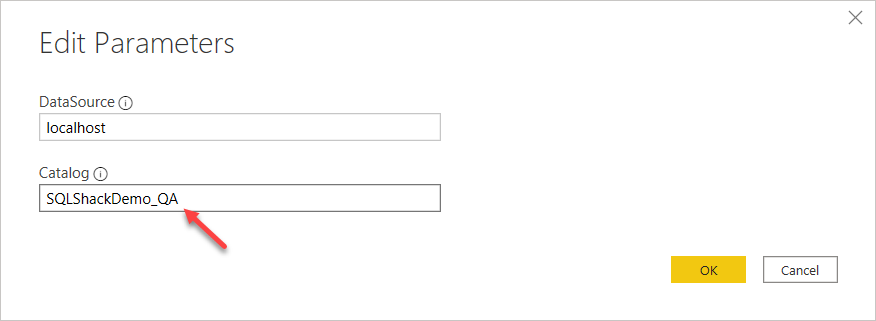
Figure 11 – Edit Parameters Dialog Box
Once the dataset is refreshed, you can now see that the card visual has been updated, and now it reflects the value from the QA environment which is “800”. This is how you can use any data source to fetch data into Power BI without manually changing the reports:

Figure 12 – Power BI Report from QA Environment
Repeat the same for the production environment. Let us go ahead and modify the catalog name to “SQLShackDemo_PROD” and load the data into the Power BI report:
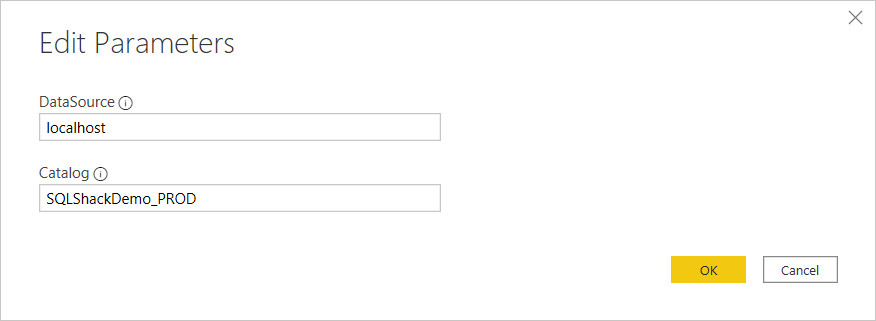
Figure 13 – Edit Parameters for Production
Once the dataset is refreshed, you can now see the values from the production database “5000” being displayed in the parameterized Power BI report:
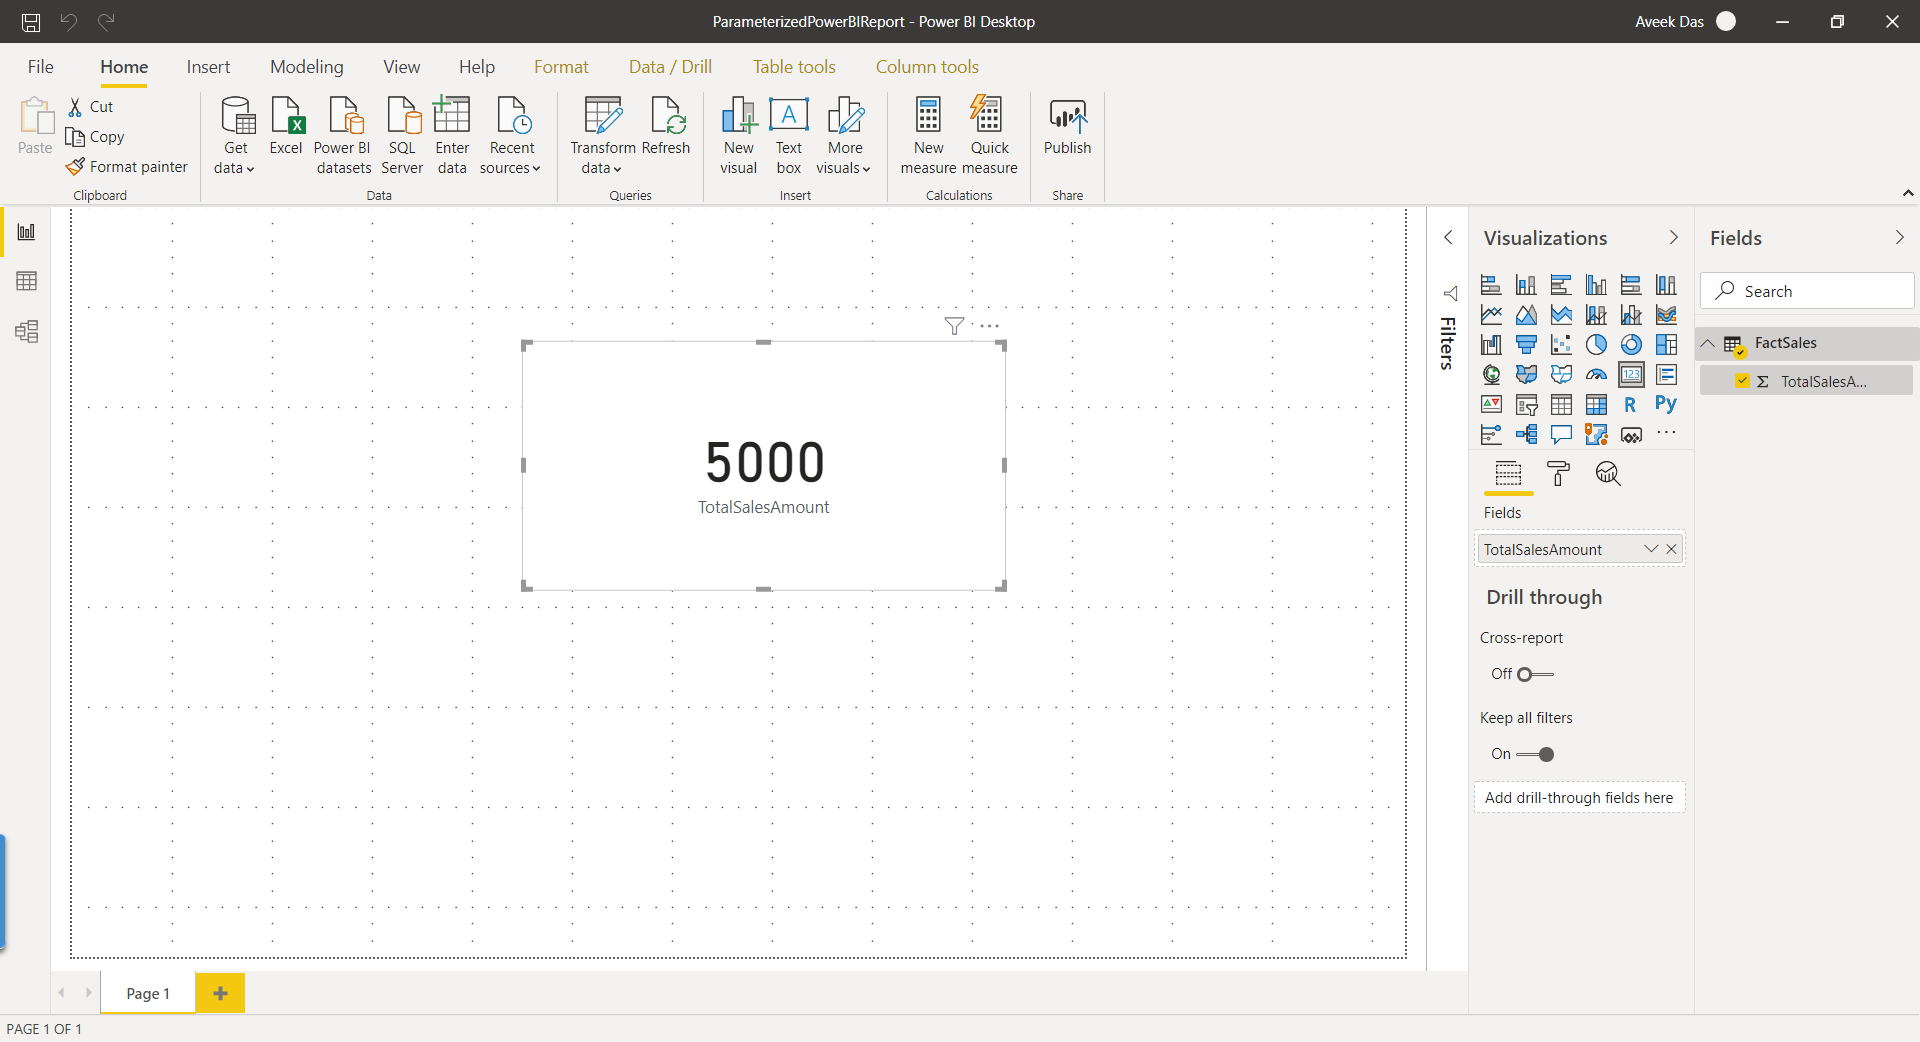
Figure 14 – Power BI Report from Production Environment
Conclusion
In this article, I have described how to create parameterized Power BI reports across different environments. This is done by parameterizing the data source connections while fetching data into the Power BI Reports. By default, this feature is turned off in the Power BI Desktop application, but it can be enabled later on if required. Using this feature can greatly help in using the same Power BI report over different environments without having to manually build the report separately for each environment. Also, using the parameterized data source connections enable the users to use the report and connect to any other data source as long as the schema of the database is the same.

He is a prolific author, with over 100 articles published on various technical blogs, including his own blog, and a frequent contributor to different technical forums.
In his leisure time, he enjoys amateur photography mostly street imagery and still life. Some glimpses of his work can be found on Instagram. You can also find him on LinkedIn
View all posts by Aveek Das
- Getting started with PostgreSQL on Docker - August 12, 2022
- Getting started with Spatial Data in PostgreSQL - January 13, 2022
- An overview of Power BI Incremental Refresh - December 6, 2021