
In the previous article, Learn SQL: SQL Server Pivot Tables, we’ve discussed how to create a report using a PIVOT table query. We’ve created such a report directly in the SQL Server. In this article, we’ll do the same, but this time we’ll use SQL Server export to Excel. So, let’s start.
Data model and the general idea
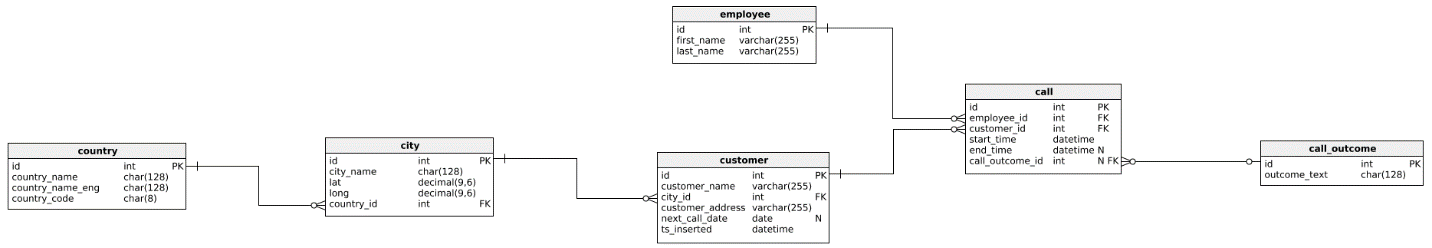
The data model we’ll use is the same that we’ve been using throughout this series. Even the queries used are the ones we’ve analyzed in the previous article and therefore I won’t explain them in-depth here. In case, you’ve missed the previous article, I strongly recommend taking a look at how these queries work.
The goal of this article is to show how we could combine data returned using SQL query and SQL Server export to Excel. This combination could prove to be very powerful. One of the main reasons is that MS Excel provides many additional options like graphs, calculations, formatting results. Also, you could use one “master” Excel workbook where you would join data from multiple sources, much easier than you could do it in case you read these data from original sources. And, worth to mention, that Excel is widespread and people are usually much more familiar with it than with databases.
SQL Server export to Excel – Using PIVOT Query
We want to create a report that contains a list of all cities from our database. For each city, we need to know a number of calls grouped by their outcome.
To achieve that, we’ll use the final query from the previous article. This query shall always return all combinations of cities and call outcomes (we’ve used CROSS JOIN to create reporting categories). Also, we’ll be able to pivot by outcome (name), because our query is dynamic (we’re adding outcomes to the pivot part of the query based on the current contents of the dictionary). Therefore, our query shall work in all cases – even if we add new outcomes to the dictionary.
|
1 2 3 4 5 6 7 8 9 10 11 12 13 14 15 16 17 18 19 20 21 22 23 24 25 26 27 28 29 30 31 32 33 34 35 36 37 38 39 40 41 42 43 44 45 46 47 48 49 50 51 52 53 54 55 56 57 |
-- 1 -- report (including dynamic PIVOT) DECLARE @columns NVARCHAR(MAX) = '', @query NVARCHAR(MAX) = ''; -- get all column names for the table we need for pivot SELECT @columns += QUOTENAME(TRIM(co.outcome_text)) + ',' FROM call_outcome co ORDER BY co.outcome_text; -- remove "," from the end of the string SET @columns = LEFT(@columns, LEN(@columns) - 1); -- dynamic SQL query SET @query =' SELECT * FROM ( SELECT -- rc.city_id, rc.city_name, -- rc.call_outcome_id, rc.outcome_text, rd.call_duration FROM ( SELECT c.id AS city_id, c.city_name, co.id AS call_outcome_id, co.outcome_text FROM call_outcome co CROSS JOIN city c ) rc LEFT JOIN ( SELECT ci.id AS city_id, co.id AS call_outcome_id, DATEDIFF(SECOND, c.start_time, c.end_time) AS call_duration FROM call c INNER JOIN call_outcome co ON c.call_outcome_id = co.id INNER JOIN customer cu ON c.customer_id = cu.id INNER JOIN city ci ON cu.city_id = ci.id ) rd ON rc.city_id = rd.city_id AND rc.call_outcome_id = rd.call_outcome_id ) report_data PIVOT( COUNT(call_duration) FOR outcome_text IN ('+ @columns +') ) AS pivot_table;'; -- execute dynamic query EXECUTE sp_executesql @query; |
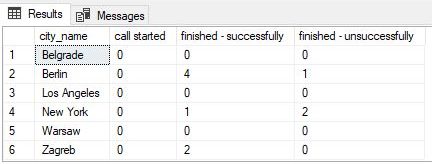
Let’s take a look at the query result now. As expected, the result is the pivot table with all the data we need. Now is the time to use SQL Server export to Excel.
SQL Server is a great tool and it has many addons you could use for specific purposes. Still, one of the frequently used options are to simply copy the SQL Server query result to MS Excel and make desired additional transformations there. The reason for that is that MS Excel provides a variety of options to present data. Some of the most commonly used are tables, pivot tables, many different graph types, etc. Also, you could use MS Excel workbook as a central place where you will gather data from different sources (based on different formats or technologies) and combine them to get an overall insight at your business. One more thing worth mentioning here is that MS Excel is widespread and people are used to working with it. I don’t have an actual statistic related to SQL Server and MS Excel usage, and I guess it would be hard to have actual numbers, so I’ll go with estimations available online. Around 750 million people worldwide use Excel, while in 2019 we had around 26.5 million developers (database developers are a small part of that number).
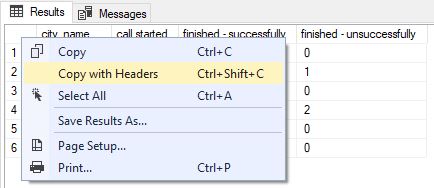
After you run the query, you can simply select the whole query result by clicking in the upper left corner (above row numbers and left of the column names). The next thing to do is to select the “Copy with headers” option from the drop-down list.
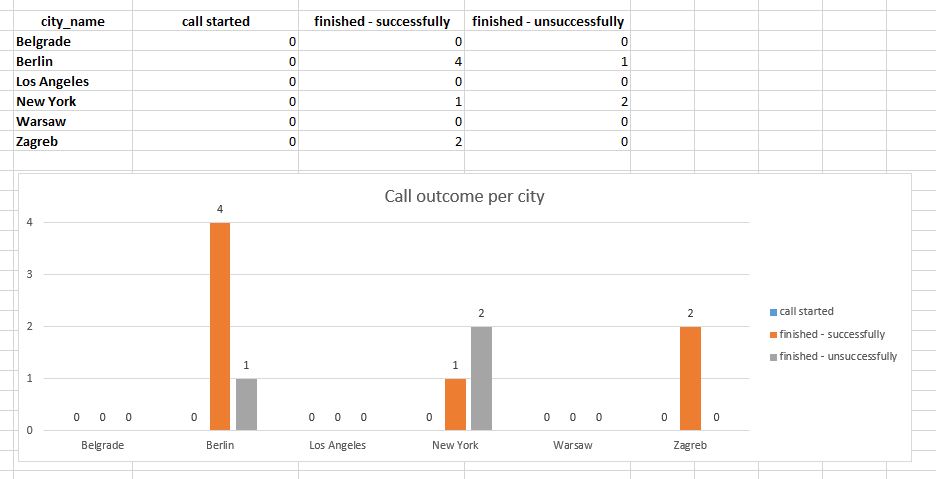
We’ve pasted the query result in the MS Excel worksheet. In real-life examples, we could have more formatting than just applying bold to the categories. The graph below the table with data is prepared and formatted so it will change accordingly changes in the data.
There are a few more things we could have done differently here:
- We could paste data (pivot table) in a separate worksheet and have the “presentation” worksheet formatted additionally
- In case we have more details, we could prepare several different graphs, as well as calculate parameters relevant to our business
I’ve used this approach on real-world data as it enables you to create very complex dashboards after running a few queries. Of course, you’ll spend a lot of time to prepare dashboards (and adjust them accordingly changes in reporting requirements), but once you do that, you’ll profit a lot each time you need to create a new report.
And even better, this is not only limited to SQL Server export to Excel combination, but you could extract data from different sources (other DBMSs, files, text…) and use your dashboard as a central place to get an overall insight.
SQL Server export to Excel – Without PIVOT Query
The final goal of our task is to create a pivot table as well as a graph to visually represent the result. The approach in the previous section was to create a PIVOT table query directly in SQL and paste this query to Excel. There are (at least) 4 good reasons when you won’t always be able to use this approach:
- You have the SQL query ready and you don’t want to waste additional time turning this query into the PIVOT table query, but rather spend that time manipulating the result in the Excel
- Maybe you don’t use SQL Server (and MS Excel) and your DBMS simply doesn’t support PIVOT table queries (and dynamic queries which is what we need)
- You want to have data in the raw format because you’ll need it for other purposes as well. Maybe you’ll create more than 1 pivot table from the data returned. Maybe you’ll combine these data with other data directly in Excel
- You simply don’t know how to create a PIVOT table query in SQL Server but you know how to do it in MS Excel. OK, this is not an excuse, but still, this is a common case in real life
Let’s now see what can be done if we go with the option that we don’t use the SQL Server pivot query. Once more we’ll use the query described in the previous article. It’s almost the same as the previous query, with the main difference that we lack the PIVOT part of the query.
|
1 2 3 4 5 6 7 8 9 10 11 12 13 14 15 16 17 18 19 20 21 22 23 24 25 26 27 28 29 30 31 32 33 34 |
-- 2 -- report categories & data (without pivot) SELECT rc.city_id, rc.city_name, rc.call_outcome_id, rc.outcome_text, rd.call_duration FROM ( SELECT c.id AS city_id, c.city_name, co.id AS call_outcome_id, co.outcome_text FROM call_outcome co CROSS JOIN city c ) rc LEFT JOIN ( SELECT ci.id AS city_id, co.id AS call_outcome_id, DATEDIFF(SECOND, c.start_time, c.end_time) AS call_duration FROM call c INNER JOIN call_outcome co ON c.call_outcome_id = co.id INNER JOIN customer cu ON c.customer_id = cu.id INNER JOIN city ci ON cu.city_id = ci.id ) rd ON rc.city_id = rd.city_id AND rc.call_outcome_id = rd.call_outcome_id ORDER BY rc.city_id, rc.call_outcome_id; |
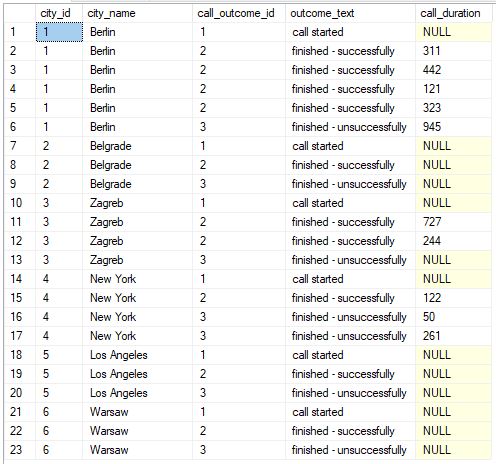
The first step is done. We’ve successfully returned all the data we need. Our result contains all combinations of cities and possible outcomes (we’ve used CROSS JOIN) and one row per each call (NULL where we had no call).
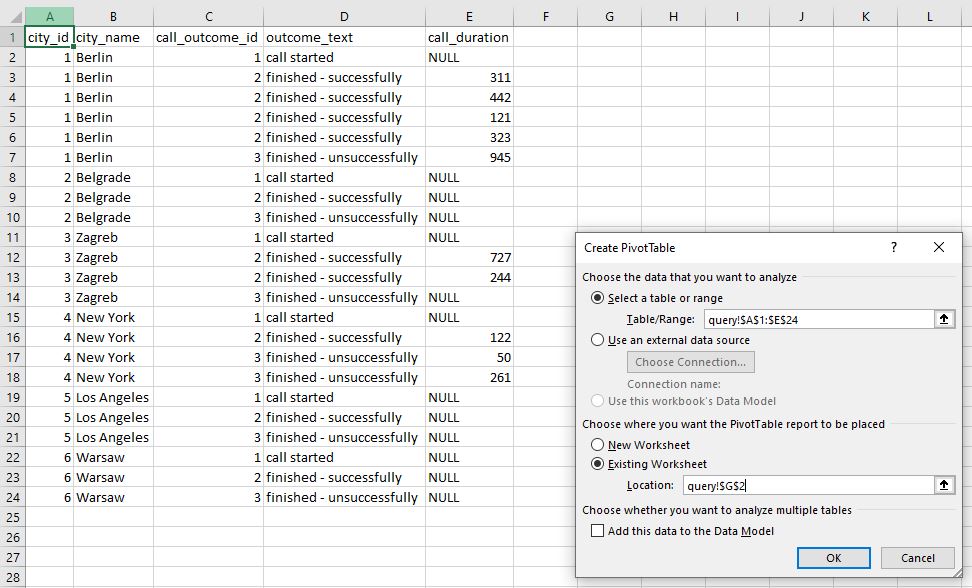
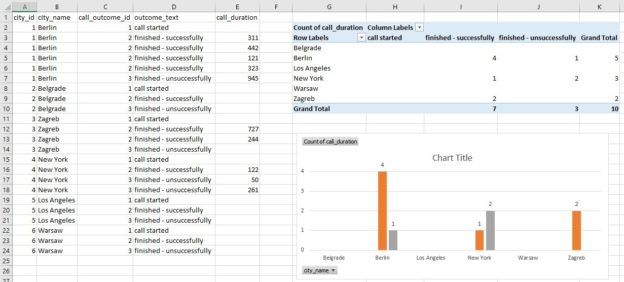
Now we’re ready to create a PIVOT table directly in Excel. After clicking on the “Insert” -> “Pivot Table” (in Tab List and Ribbon) the window like the one on the picture above shall appear. We’ll “Select a table or range” containing the data and the location where we want to place our pivot table (in our case that is “Existing Worksheet”, starting from cell G2).
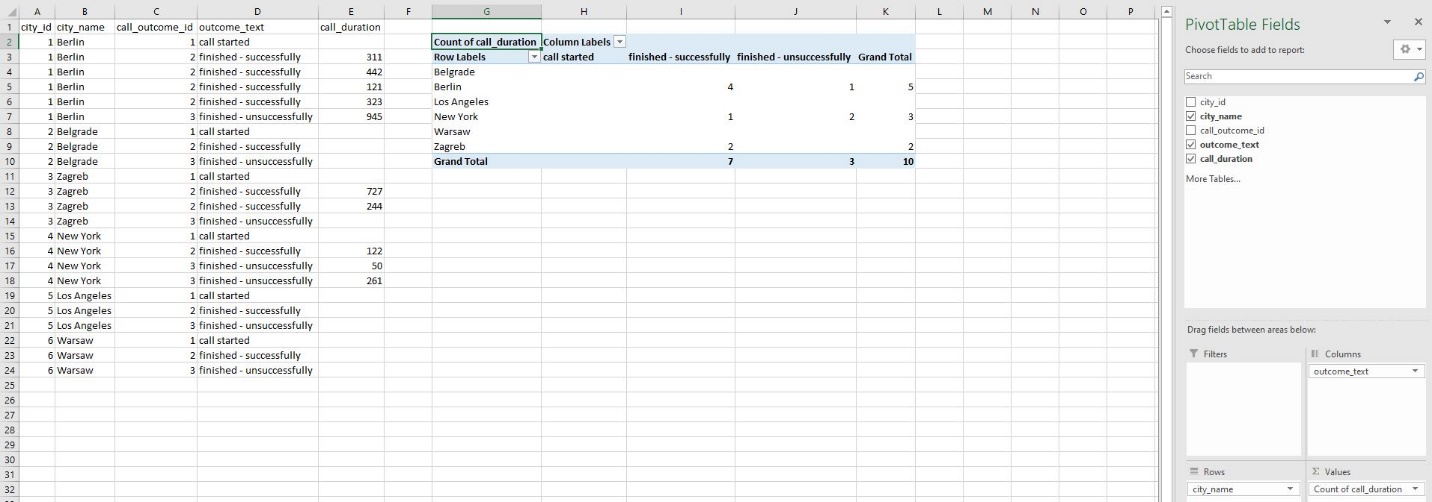
The next thing we did was to define what goes where. City names shall be “Rows” of our table, outcome texts shall go into “Columns” and we’ll count call duration (“Values”). Please notice that in the original table (output), I’ve replaced NULL values in column E, with blank spaces. This is important because the count function shall count 1 if the row contains any non-empty value.
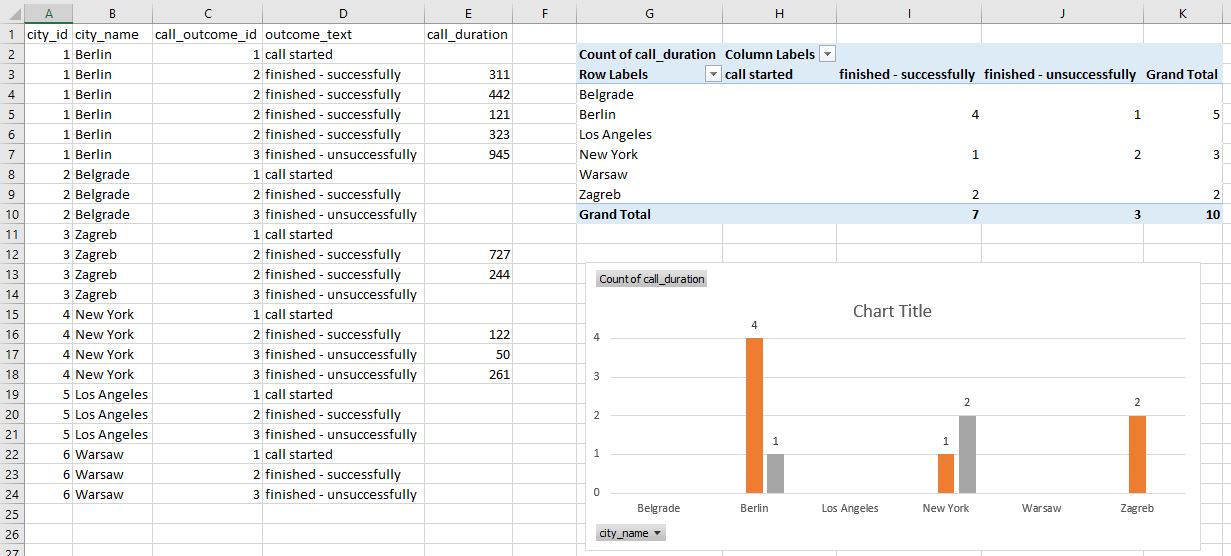
The last thing we’ll do is to create a graph. The data source for our graph is the pivot table created in the previous step. We’ll apply formatting to our graph (graph style, labels, axis, etc.), and we’re done.
This approach could be applied more generally compared to the approach when the pivot table is created directly in SQL Server. And that’s it – we’ve used SQL Server export to Excel to pull data from the database and create a simple dashboard.
Conclusion
Today we’ve seen how we could combine the powers of SQL Server export to Excel – using the SQL query to grab data, importing it to MS Excel, and making additional changes there. This is something you could easily do for various purposes and the limit is only your imagination (and, of course, business needs). The next step could be automating exports of tables or graphs created in MS Excel, directly to Word or PowerPoint.
Table of contents

His past and present engagements vary from database design and coding to teaching, consulting, and writing about databases. Also not to forget, BI, creating algorithms, chess, philately, 2 dogs, 2 cats, 1 wife, 1 baby...
You can find him on LinkedIn
View all posts by Emil Drkusic
- Learn SQL: How to prevent SQL Injection attacks - May 17, 2021
- Learn SQL: Dynamic SQL - March 3, 2021
- Learn SQL: SQL Injection - November 2, 2020