

In this article, I am going to describe how to use a date dimension table in Power BI. Using a date dimension table becomes extremely important while visualizing facts and figures over some time in the calendar. Sometimes it is possible that we do not have the continuous date values in our dataset that we are trying to work upon.
For example, let us consider sales from a supermarket which remains closed on the weekends. In such a case, there will be sales only for the weekdays and no sales happening on the weekends. If we try to work on the data for such a store, then in the data source, we will not have any data for the days on which the sales were not made. However, to do time-based calculations, it is necessary to have all the dates continuously in the database to properly aggregate the results.
So, to overcome this issue, we can introduce a concept of date dimension table in Power BI, in which we will pre-populate all the possible date values for a few years and then make a join with the date of the sales. When creating the visualizations, we can take the date values from the date dimension table and the sales values from the sales table. In this way, we will have a clear idea on which days there were sales made and which were the days with zero sales.
Creating the Date Dimension
There are two ways of creating the date dimension as follows:
- Using a SQL table as the date dimension
- Using DAX to create a date dimension in Power BI
If the dataset that we are working on comes from a SQL database, then it is ideal that we can create a small date dimension table in that database itself. However, if the source is not an SQL database, but some SaaS products or some other file system, then we can use DAX to create a separate date dimension in the Power BI data model. In this article, let us explore how to create and use the date dimension in Power BI using DAX
Creating the Date Dimension using DAX
Power BI is an amazing business intelligence tool that gives us the ability to calculate many time-intelligent calculations based on the available underlying data. Few in-built functions allow the business users to calculate month-over-month, or month-to-date, etc. calculations just out of the box. The only requirement for Power BI to calculate such functions is to have a date dimension table in the Power BI data model on which it can make the calculations.
Let us now go ahead and enable the Auto Date/Time function under the Time Intelligence options.
Open Power BI Desktop and click on File. Select Options and settings, and a new dialog box will appear. In the new dialog box, select Data Load and check the box against Auto date/time:
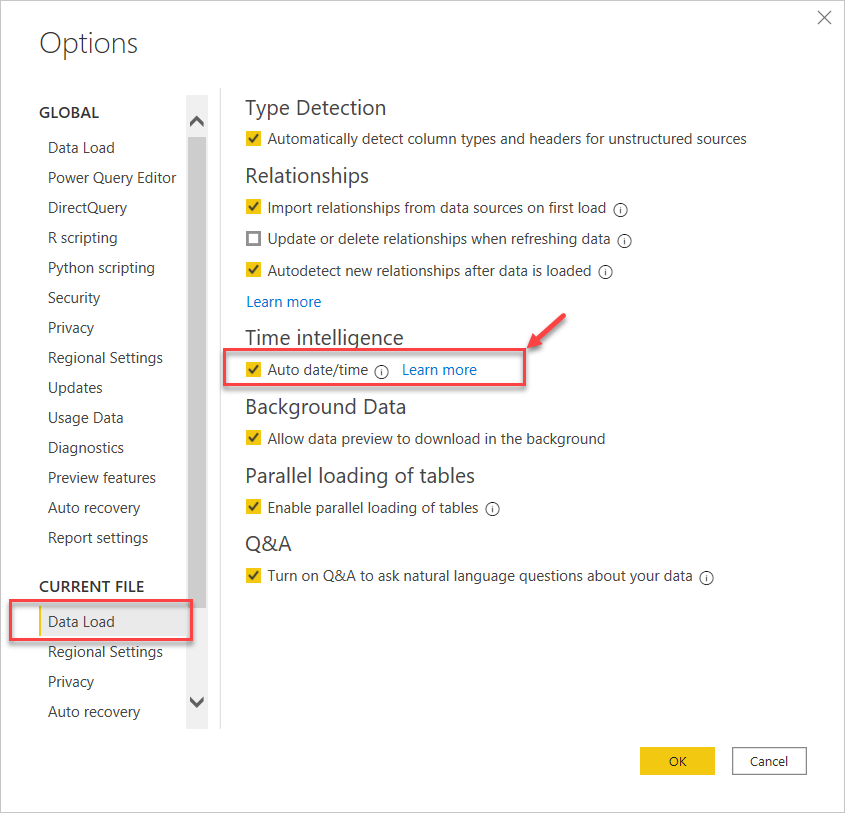
Figure 1 – Options Dialog Box
Next, let us fetch some sales data into the Power BI data model. For the sake of this article, I am going to use the Fact.Sale table from the WideWorldImportersDW database. In the Power BI Desktop, go to Get Data and select SQL Server. Select the Fact.Sale table and click on Load. This will connect to the SQL Server database table and bring the data into the Power BI environment:
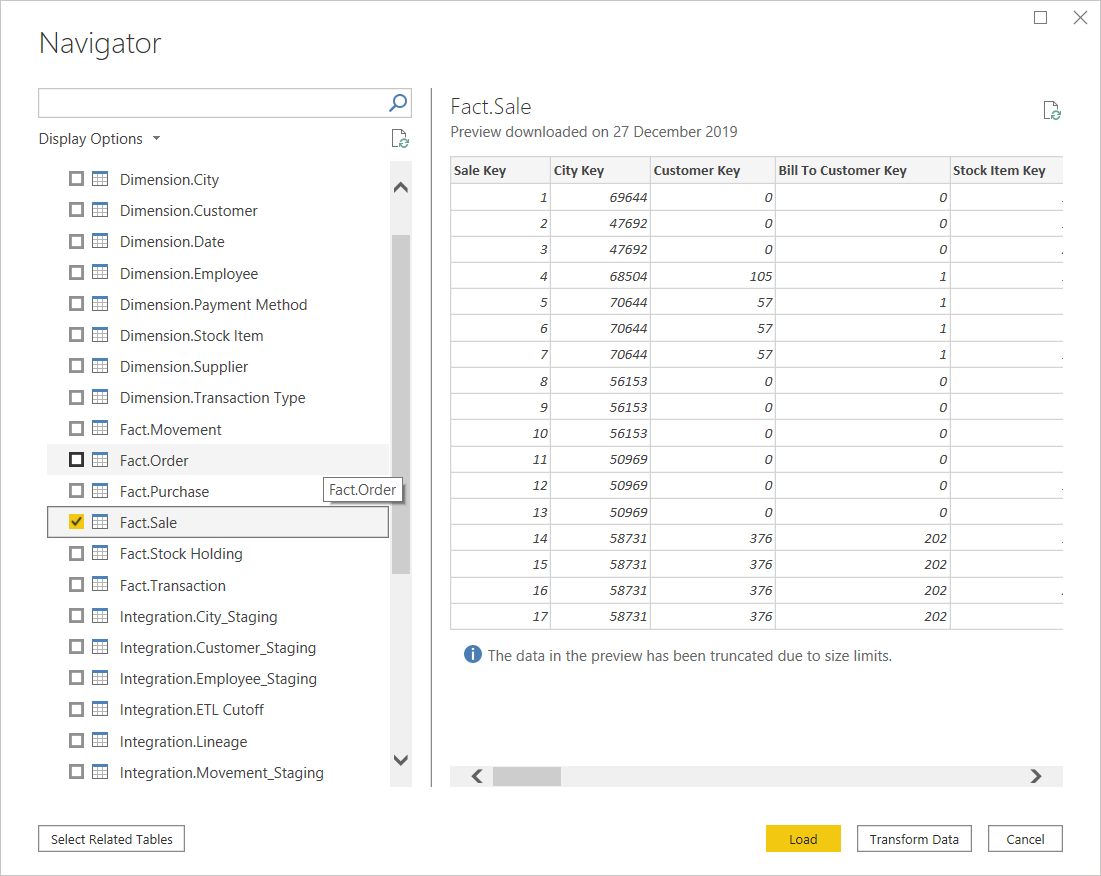
Figure 2 – Fetching in Sales Data into Power BI
Once the table is imported, you can see the Power BI data model as follows:
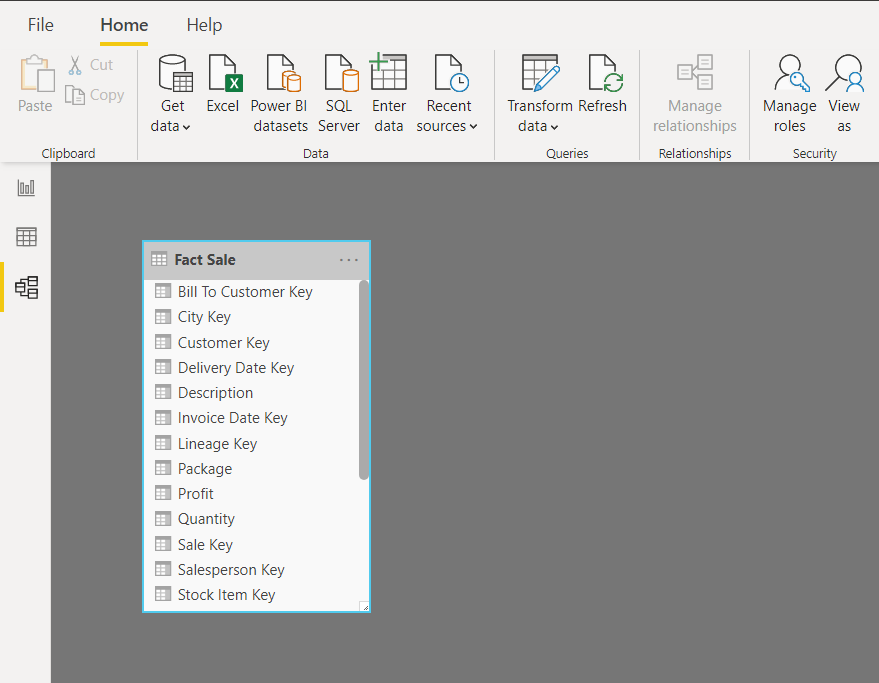
Figure 3 – Sales Data Imported
Let us now create the calendar table in the Power BI. To give it a name, let us call the table DateDimension:
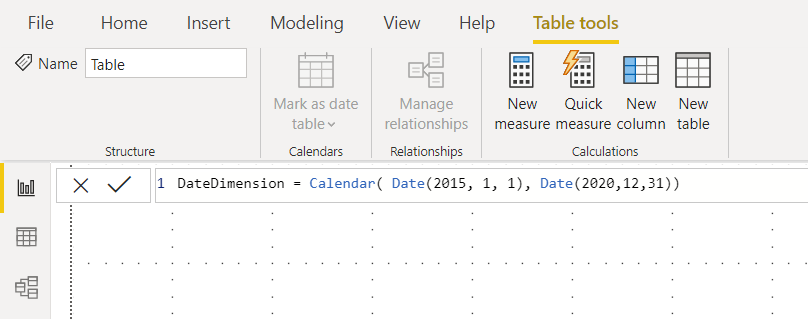
Figure 4 – Creating the Date Dimension in Power BI
To create the date dimension in Power BI, click on the Data view, which is available on the left bar, and then navigate to the Modelling tab on the top. Select the New Table and enter the following DAX expression to generate a calendar table with records starting from 1st January 2015 to 31st December 2020. This will create a new table with all the dates all these six years:
|
1 |
DateDimension = Calendar( Date(2015, 1, 1), Date(2020,12,31)) |
Click on the tick button or press Enter to generate the table. You can now see the new table has been added to the Power BI Data model with only one field in it:
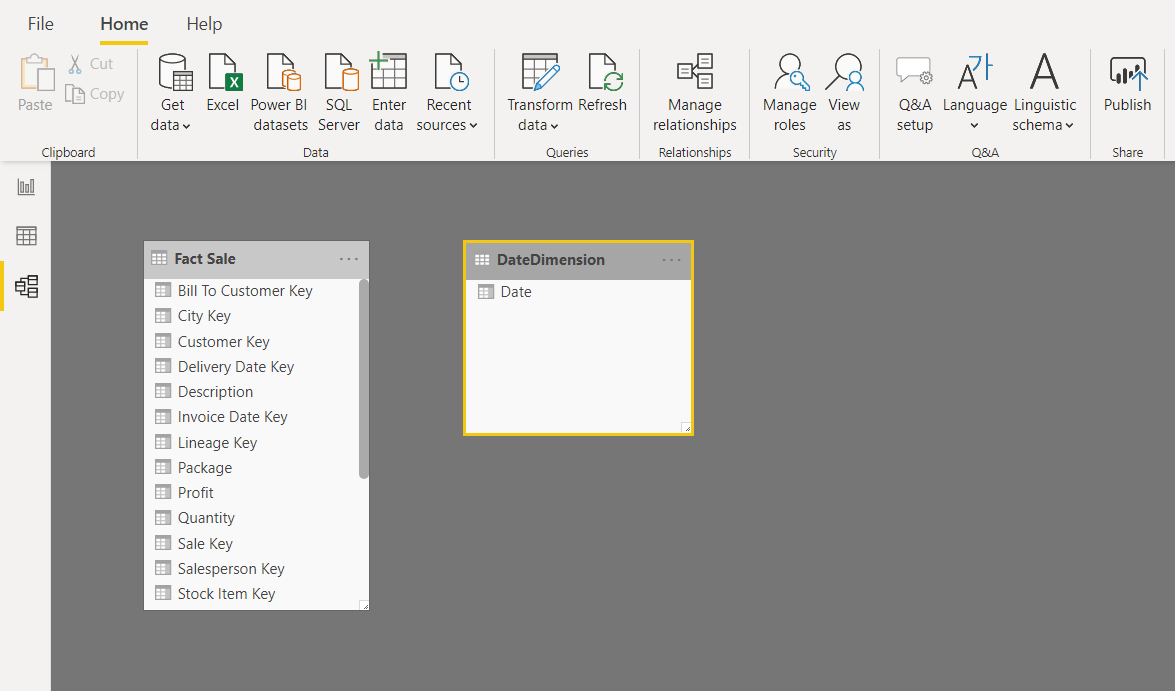
Figure 5 – Date Dimension Added
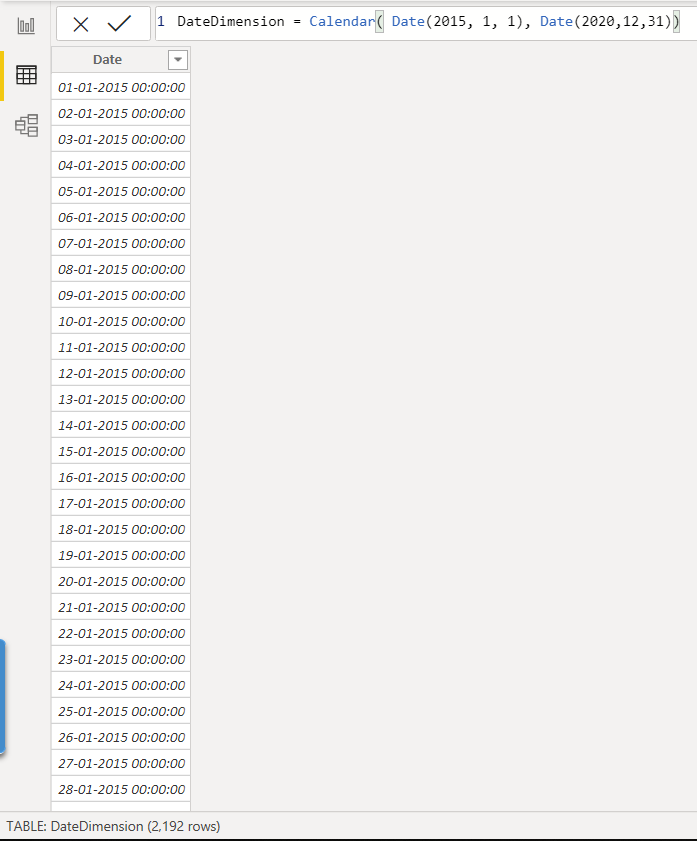
Figure 6 – Date Dimension Data
Now that our basic date dimension table is ready, we can go ahead and add additional columns to it. These additional columns can be like Month, Week, Year, Weekday, etc. To keep things simple, let’s just add the month, quarter, and year to the table.
Click on the New Column button and add the following DAX expression to create the month’s labels for all the dates in the table. This will create the Month column in the table:
|
1 |
Month = Format('DateDimension'[Date], "MMM yyyy") |
Similarly, add the columns for Quarter and Year accordingly. You are free to add as many columns as required into this table:
|
1 2 |
Quarter = Year(DateDimension[Date]) & "-Q" & Format(DateDimension[Date], "q") Year = Format(DateDimension[Date], "yyyy") |
Once all the columns have been added to the data model, the date dimension will look something like this:
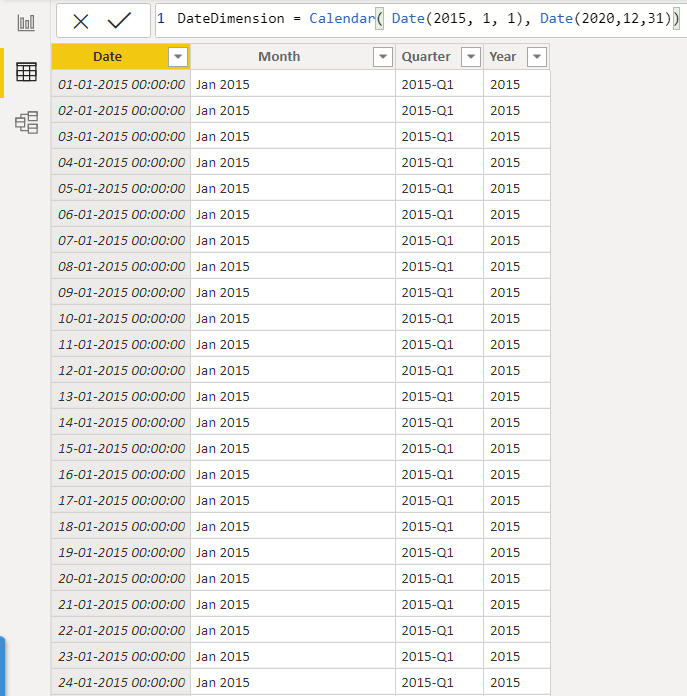
Figure 7 – Date Dimension Created
Since the Month column we added is a string field, the months will be sorted alphabetically and not chronologically. To sort the months chronologically, let us add a MonthYear column which will sort the Month based on the integer value of the months and years:
|
1 |
MonthYear = Format(DateDimension[Date], "yyyy-mm") |
Select the Month column and sort it is using the MonthYear column:
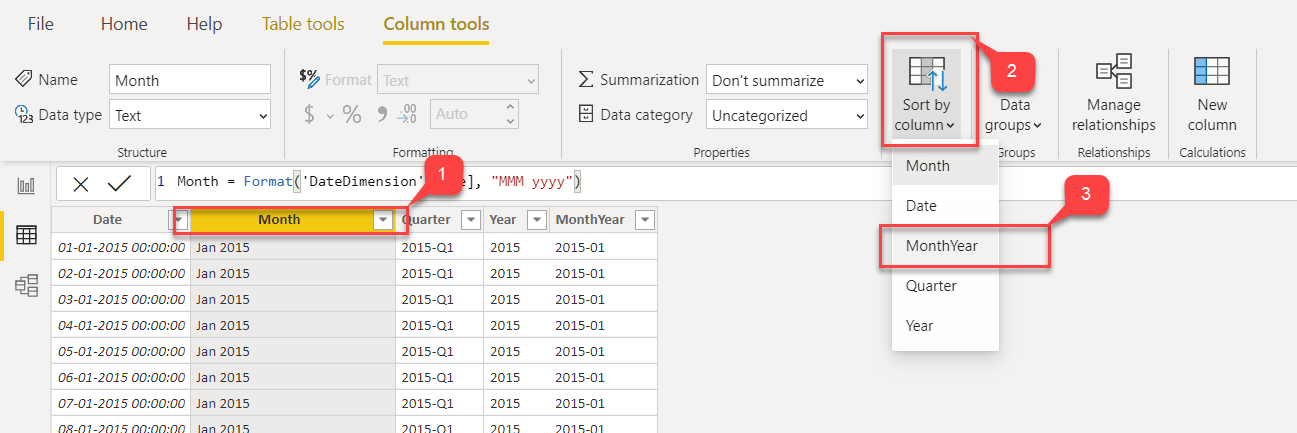
Figure 8 – Sorting by MonthYear
That date dimension is now ready. The final step here is to link this date dimension with the Sales table in Power BI:
To do that, we need to create a relationship between these two tables.
In the Data Model view, drag and drop the Date column from the DateDimension onto the InvoiceDateKey field in the FactSale table:
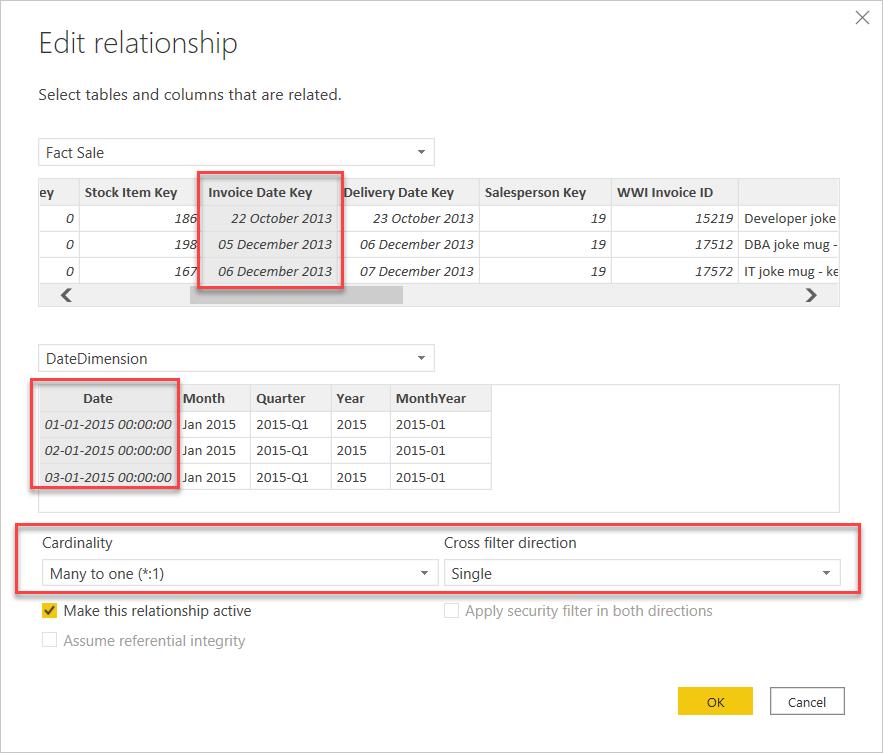
Figure 9 – Setting up the relationship
As you can see in the figure above, select the InvoiceDateKey column from the FactSale table and then select the Date column from the DateDimension table. This will establish a relation between the two tables. In the Cardinality settings, select Many-to-one as the relationship type and Cross Filter Direction as Single. Click OK once done:
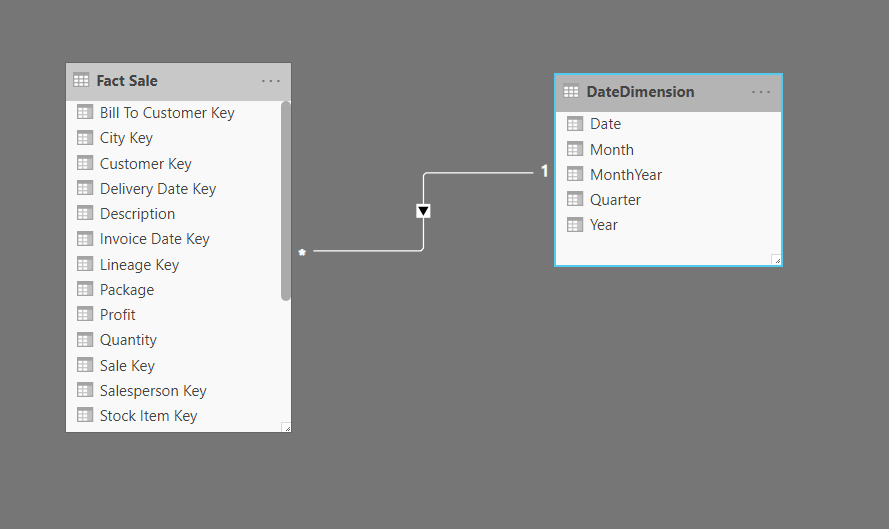
Figure 10 – DateDimension related to FactSale table
Now that the Date dimension is created let’s go ahead and quickly create a visualization out of it. Click on the Report Pane and select the Stacked Column chart from the menu. Click on the Month column from the DateDimension table and add it to the axis. Next, click on the Total Excluding Tax column and add it to the values pane:
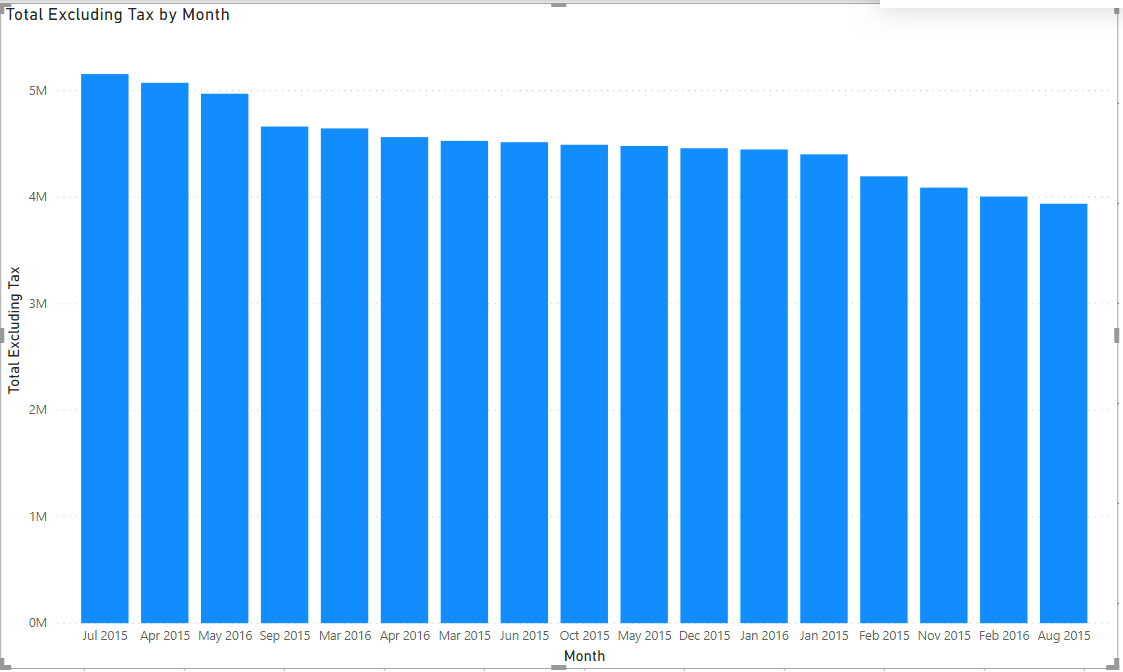
Figure 11 – Power BI Report Generated using Date Dimension
As you can see in the above figure, we have created the report by fetching the months from the date dimension table and the values from the FactSale table.
Conclusion
In this article, we have seen how to implement a date dimension table in Power BI and how to visualize the missing periods therein. Using a date dimension table is important, especially while making time-based calculations. It is also useful to understand which were the periods with good sales and periods where there were no sales at all. In short, using a date dimension tables adds an advantage to correctly display graphs without missing out any periods which are not available in the dataset.

He is a prolific author, with over 100 articles published on various technical blogs, including his own blog, and a frequent contributor to different technical forums.
In his leisure time, he enjoys amateur photography mostly street imagery and still life. Some glimpses of his work can be found on Instagram. You can also find him on LinkedIn
View all posts by Aveek Das
- Getting started with PostgreSQL on Docker - August 12, 2022
- Getting started with Spatial Data in PostgreSQL - January 13, 2022
- An overview of Power BI Incremental Refresh - December 6, 2021