Business Intelligence

Rajendra Gupta

How to create and configure the Tree Map Chart in SQL Server 2016 Reporting Services

October 28, 2016 by

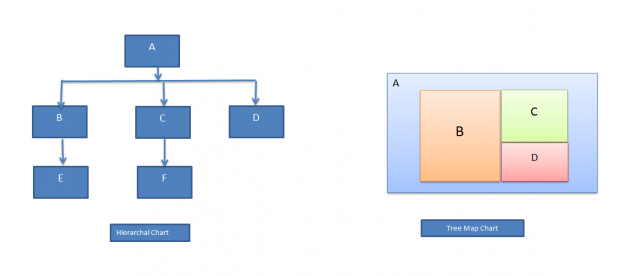
In the previous article, in this series, How to create and configure a Sunburst chart in SQL Server 2016 Reporting Services, we have explored new chart types in SQL Server 2016; the Sunburst chart and the Tree Map chart, that are used to display hierarchical data. The Sunburst chart is a way of presenting relational datasets together in a compact form. The Tree Map Chart is also a way of showing hierarchical data.

In this article, we are going to show how to create a Tree Map chart and its comparison with the Sunburst chart.

Read more »
Steve Simon

How to effectively extract data from an OLAP cube by relying upon T-SQL

October 19, 2016 by

Introduction

Last month I ran two Business Intelligence pre-conferences in South Africa. A interesting request arose during the course of the preconference in Cape Town. The individual wanted an approach to extracting data from an OLAP cube that would avoid intensive utilization of MDX and more reliance upon T-SQL. His main concern was with filtering the data at run time, via the report front end.

In this “fire side chat” we shall do just that, utilizing the cube that comes with the new Microsoft database “WideWorldImporters” and we shall learn how we can get from this

Read more »
Steve Simon

Reporting in SQL Server – Customize the visual appearance of your reports

October 3, 2016 by

Introduction

As we are nearing the end of the North American summer, I thought that we would take a lighter look at nifty ways of reporting information. In today’s “fireside chat” we have a look at a unique way of displaying our information using charts and line graphs all in one single chart (see below). We shall take things one step further and work with the color fill of the vertical bars to reflect the values that they represent.

Read more »
Sifiso Ndlovu

How to filter multidimensional OLAP cubes in SSRS reports

September 28, 2016 by

Ever since the early days of my career, SQL Server Reporting Services (SSRS) has been one of my preferred data visualization tools simply because end users and developers alike use it for free. Although a majority of my SSRS solutions have been based off a relational dataset that uses Transact SQL (T-SQL), I have also produced several reports that used Multidimensional Expressions (MDX) to connect and retrieve data from SQL Server Analysis Services (SSAS) multidimensional OLAP cube. Recently, I found myself having to refactor some of these SSAS based SSRS reports, particularly converting a single value SSAS-populated parameter into a multi-value parameter. In this article, I explore how you can go about making these changes using SSRS query designer’s design and query modes.

Read more »
Sifiso Ndlovu

How to stop a runaway SSIS package

September 13, 2016 by

There are many reasons for terminating a long running SSIS Package. Picture a scenario whereby an inexperienced DBA/developer accidentally kicks-off a monthly job instead of a daily job, inadvertently impacting SQL Server performance. Whatever the reasons, you are more than likely to encounter a situation in which you have to temporary stop a long running process.

Read more »
Sifiso Ndlovu

How to use SQL Server Reporting Services (SSRS) to execute SQL Agent Jobs

August 22, 2016 by

Every production ETL (Extract, Transform, Load) solution is often intrinsically linked to a scheduling mechanism that is used to execute that ETL solution. In a SQL Server-based environment, SQL Server Agent is one of the scheduling mechanism that can be utilized to schedule an execution of ETL solutions such as SQL Server Integration Service (SSIS) packages. In the organization that I currently work for, we’ve had several instances (for various reasons) whereby as the data team we’ve been required to provide a platform for business users to execute an ETL at their own convenience (i.e. on-demand). In this article, we will demonstrate on how we went about delivering self-service ETL execution requirement.

Read more »
Steve Simon

Reporting in SQL Server – Combine three reports into one using SQL Server Data Tools

August 4, 2016 by

Introduction

In our last “fireside chat” we discussed a few of the challenges that the HR Manager of a major hardware chain was experiencing. Mary Smith, the HR manager has since approached us to modify her existing reports to function more efficiently and effectively by utilizing her existing data, yet reduce the total number of reports.

Read more »
Steve Simon

Reporting in SQL Server – Combine T-SQL and DAX queries to produce effective reports

July 27, 2016 by

Introduction

With today’s challenging economic times it has become more and more important to manage and rectify changing sales patterns and trends.

In today’s “get together” we shall be expanding our outlook by creating efficient and effective reports utilizing SQL Server Reporting Service 2016 and T-SQL, together with the DAX code that we created in our last “fire side chat”.

Read more »
Steve Simon

SQL Server and BI – How to document your Tabular model with Reporting Services 2016

July 20, 2016 by

Introduction

A few weeks back I had been working on an interesting proof of concept for a client within the food/grocery industry. The objectives were to be able to provide the client with information on sales patterns, seasonal trends and location profitability. In our previous “get-together” we discussed how to create a tabular model project and how to create efficient and effective reports utilizing Excel.

Read more »
Daniel Calbimonte

Using Power BI Desktop to connect to SQL Server and Facebook

July 12, 2016 by

Introduction

Power BI is an extremely popular new Microsoft Tool to create reports. In a previous article, we talked about Power BI Cloud based services. In that article, we connected from a SQL Azure Data Warehouse database to the Power BI Cloud services. In this new article, we will work with the Power BI Desktop Tool from zero. The Power BI Desktop is a reporting software that can be installed in your Windows machine to create reports locally and connect to different data sources like Azure, SharePoint, Active Directory, Exchange, Facebook, Google Analytics and many other data sources. We will create Reports from a SQL Server database and finally we will extract information from Facebook. With Power BI, you can easily access to maps at street level around the world.

Read more »
Steve Simon

SQL Server and BI – How to document your Tabular model with Excel

July 12, 2016 by

Introduction

A few weeks back I had been working on an interesting proof of concept for a client within the food / grocery industry. The objectives were to be able to provide the client with information on sales patterns, seasonal trends and location profitability. The client was an accountant and was therefore comfortable utilizing spreadsheets. This said, I felt that this was a super opportunity to build our proof of concept utilizing a SQL Server Tabular Solution and by exploiting the capabilities of Excel and Power Reporting for the front end.

Read more »
Sifiso Ndlovu

New Excel slicer feature for report users in Office 2016

May 9, 2016 by

Whilst researching for the article Report filtering: Excel slicers vs SQL Server Reporting Services (SSRS) parameters, I discovered a new Excel Slicer feature in Microsoft Office 2016 that allows users to select/deselect multiple items without having to hold down the control (Ctrl) keyboard key. For some people, this may not be a sufficient reason to upgrade to Office 2016 but for developers of business intelligence (BI) solutions, this new feature further enhances the experience of consumers of BI solutions.

Read more »