
This article explores the report filtering using Excel Slicer and SQL Server Reporting Services.
At the heart of interactive reporting is the ability for end-users to filter report datasets according to their preference. Therefore, a great data visualization tool is the one that caters for report filtering. Some of the popular data visualization tools used by some of my clients to consume my Business Intelligence solutions usually include SQL Server Reporting Services (SSRS) and Microsoft Excel. Although these tools share a similar publisher, Microsoft, they have several differences on their report usage and configuration. One difference they seem to share is in the way they are configured to enable report filtering, which is the focus of this article.
Case study
Likewise, proper discussions surrounding topics relating to SQL Server are better explained through technical demonstrations. Consequently, the dataset that will be used to produce SSRS and Excel reports will be based on the dummy data that was imported as part of the demo in my article, Working with Ragged Right Formatted Files in SSIS. For the purposes of this article, I have further transformed this data and represented it in a form of a SQL Server View titled, FruitSales.
The definition of the view can be downloaded here.
Figure 1 shows the execution results of a SELECT T-SQL command against the FruitSales view.
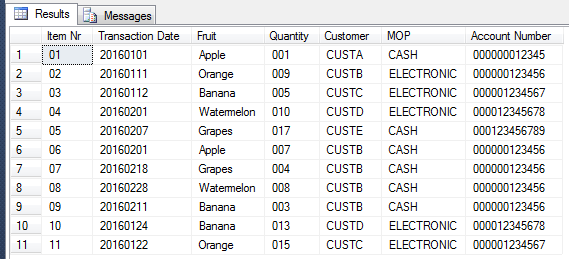
A typical business case with such a dataset could be as follows:
- As a business user, I would like to see breakdown of customers by the total number of quantities of fruits they have purchased to date.
- I would also like to filter the report by fruit names.
Report filtering using Excel slicer
Figures 2 and 3 respectively show an SSRS and Excel reports that have been developed to address the aforementioned business case. As it can be seen, from the perspective of an end-user, the reports are almost similar with SSRS implementing reporting filtering through a multi-select Fruits parameter and Excel Pivot making use of Fruit Slicer.
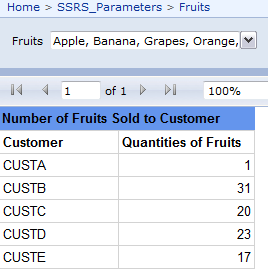
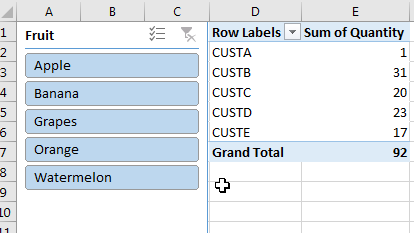
However, one advantage that Excel Pivot report has over SSRS is the ease at which end-users can add and remove slicers (or filters). Whilst an SSRS report requires development IDE like SSDT, BIDS, or Report Builder to add and remove report filters, in Excel – as a developer, you leave it to users to configure their own filters by going through the following few steps:
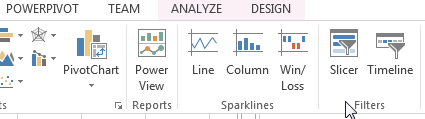
Step 1: Insert Excel Slicer
Navigate to the INSERT menu and click on Slicer under the filters section of the tool bar as shown in Figure 4.
Upon clicking the Excel Slicer button, an Insert Slicers dialog box comes up and allows you to choose you slicers from a list of all available fields from your dataset as shown in Figure 5.
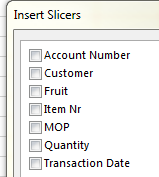
Furthermore, adding multiple slicers in Excel is just a matter of checking boxes next to the fields you want to filter on.
SSRS Report filtering using parameters
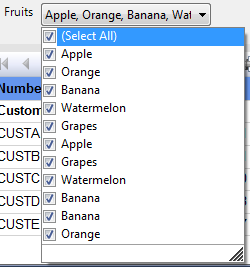
As mentioned in the previous section, whilst introducing slicers in Excel is the matter of checking boxes next to the fields you want to filter on, SSRS requires that several datasets (in addition to the main dataset) be added in order to have the additional filters appear in the report. You have an option in SSRS to populate parameters based on the main dataset but unlike in Excel, the values are duplicated as shown in Figure 6.
Thus the best way to populate parameters is to set up a new dataset.
The following is a list of steps that are required to setup report parameter in SSRS:
Step 1: Setup Data Source in SSRS Report
This is where you configure your connection string to SQL Server. You have an option to skip this step provided you have already configured a shared data source in your report.
Step 2: Setup Dataset in SSRS Report
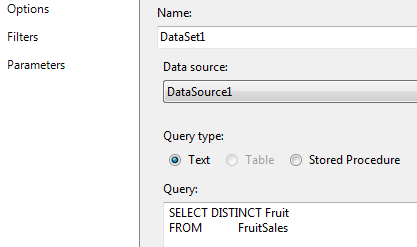
In the case of our Fruits report filter, a new dataset was setup with a text query type which ensured that we eliminate duplicates by retrieving a unique fruit names from our FruitSales view, as shown in Figure 7.
Step 3: Add New Parameter in SSRS Report
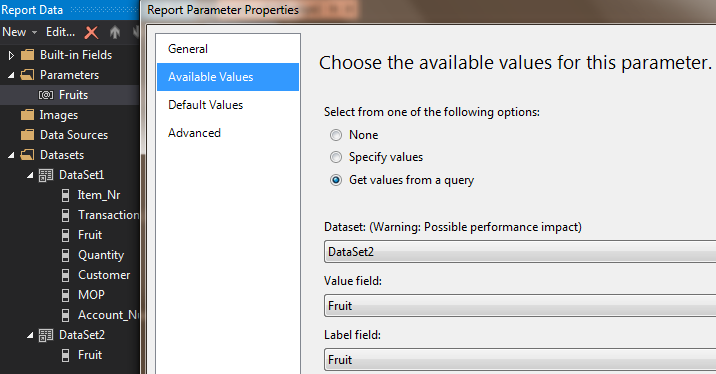
Once your dataset is setup, you have to navigate to the Parameters folder (which is found under the Report Data window) and click add new parameter button. When the SSRS Report Parameter Properties dialog comes up, configure Available Values and Default Values of the parameter to be populated by the new dataset, as shown in Figure 8.
Now, should business users later realize the need to further filter the SSRS report by – for instance, Method of Payment (MOP) – you will, unfortunately, have to repeat all steps 1-3 again.
The performance cost
It’s not just the number of steps that you have to perform to set up additional filtering in SSRS Report, but there is a SQL Server performance angle to it too. Because every parameter has its own dataset, then whenever an SSRS report is executed, separate SQL Server database connection sessions are generated to retrieve and populate report parameter values.
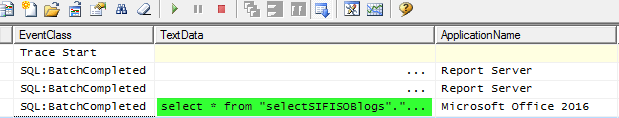
To demonstrate this point, I set up a database trace prior to running both an SSRS report and Excel Pivot report. When we refresh the Excel Pivot report, only a single SQL:BatchCompleted event class is generated as shown in Figure 9. We can also see the T-SQL script that was executed as part of refreshing the report, which was the execution of the FruitSales view.
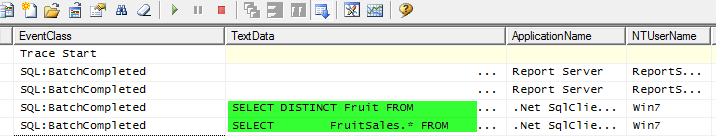
The trace results of an SSRS report refresh indicate that in addition to executing the FruitSales view, another T-SQL script was executed to retrieve unique fruit names as shown in Figure 10. It is important to note that only two scripts were executed because we only have one parameter if, later, business requires additional parameters, then more T-SQL scripts will come up in the trace.
Conclusion
The purpose of this discussion has not been to underestimate the value of SSRS Report instead to share a scenario (report filtering) whereby the use of Excel could be more convenient for report end-users and development team than SSRS. The convenience of filtering report using slicers in evident in the ability for users to select multi-slicers by checking boxes which reduces some dependencies on report developers.
Reference:

Sifiso's LinkedIn profile
View all posts by Sifiso W. Ndlovu