
SQL Server 2016 provides great enhancement capability features for troubleshooting purposes. Some of the important features are:
Query store
Enhancement for extended events
Live query execution plan
Real-Time Analytics
In-Memory OLTP (online transaction processing)
Management studio enhancements like the Compare Showplan
The Compare Showplan feature provides the ability to compare two sets of query execution plans. For example: we’ve had the situation where a user reported that the query is not working fine, while it was working fine for some time before.
To elaborate – SQL Server generates the optimized query execution plan based on several factors like number of rows, index, stats, memory, CPU etc. and it might be useful to compare 2 query execution plans to see what actually changed. Prior to SQL Server 2016, it was very difficult to perform this kind of comparison, but now we can use this feature to quickly figure out the changes.
Some of the potential benefits of the execution plan comparison can be:
Troubleshooting a production scenario
Comparing execution plans between test and production environment
Comparing execution plans between two sets of query like parametric queries
Query Performance review after doing a server/database upgrade
SQL Server 2016 introduces the Compare Showplan feature that allows side-by-side comparison of two execution plans.
How to use the Compare Showplan feature
Let us understand this query execution plan comparison feature in SQL Server 2016 with examples.
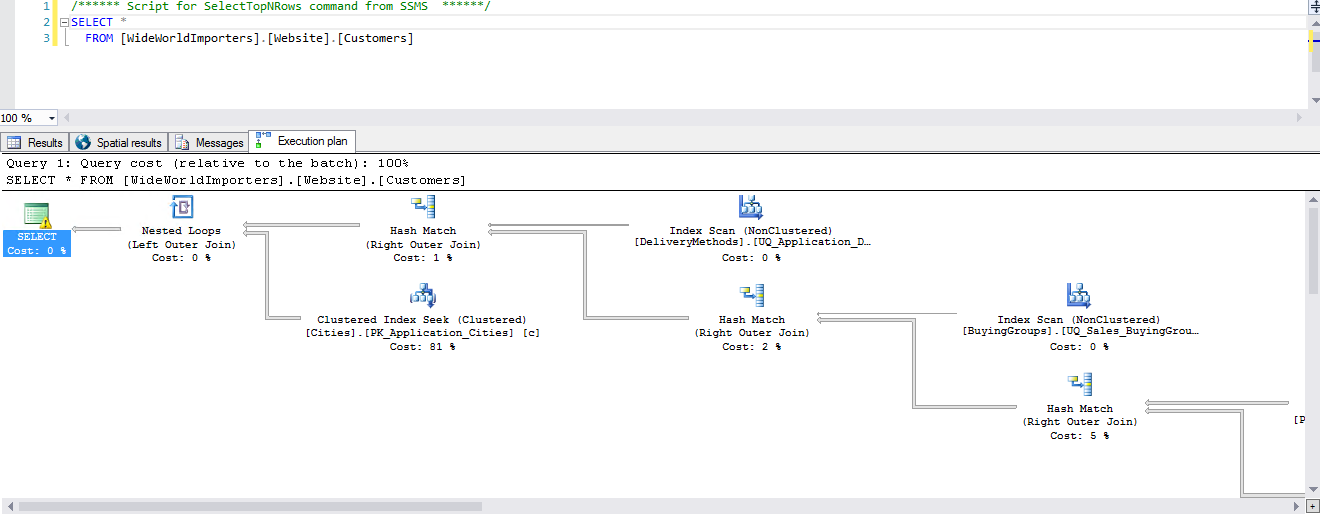
For the demonstration purpose, I am using a sample database named WideWorldImporters. This is the SQL Server 2016 sample database. It can be downloaded from here.
The sample query is below:
|
1 2 3 4 5 6 7 8 9 10 11 12 13 14 15 |
/****** Script for SelectTopNRows command from SSMS ******/ SELECT TOP 1000 [OrderID] ,[CustomerID] ,[SalespersonPersonID] ,[PickedByPersonID] ,[ContactPersonID] ,[BackorderOrderID] ,[OrderDate] ,[ExpectedDeliveryDate] ,[CustomerPurchaseOrderNumber] ,[IsUndersupplyBackordered] ,[Comments] ,[DeliveryInstructions] ,[InternalComments] ,[PickingCompletedWhen] ,[LastEditedBy] ,[LastEditedWhen] FROM [WideWorldImporters].[Sales].[Orders] where OrderID =1268 |
I have included the actual execution plan with the query (to add the actual query execution plan click on Query ➜ Include Actual Execution Plan or Shortcut key Ctrl+M)
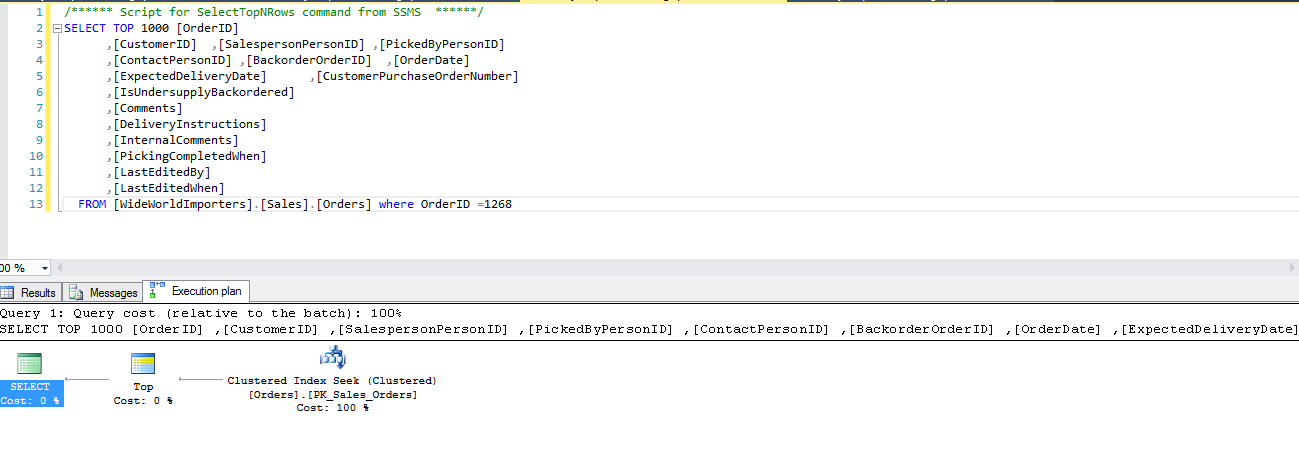
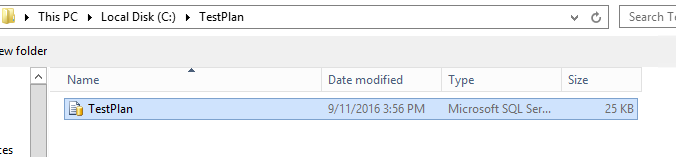
To save this execution plan just right click on Execution plan ➜ Save Execution plan as, and specify the location along with the name of the plan. Extension of the plan will be .sqlplan.
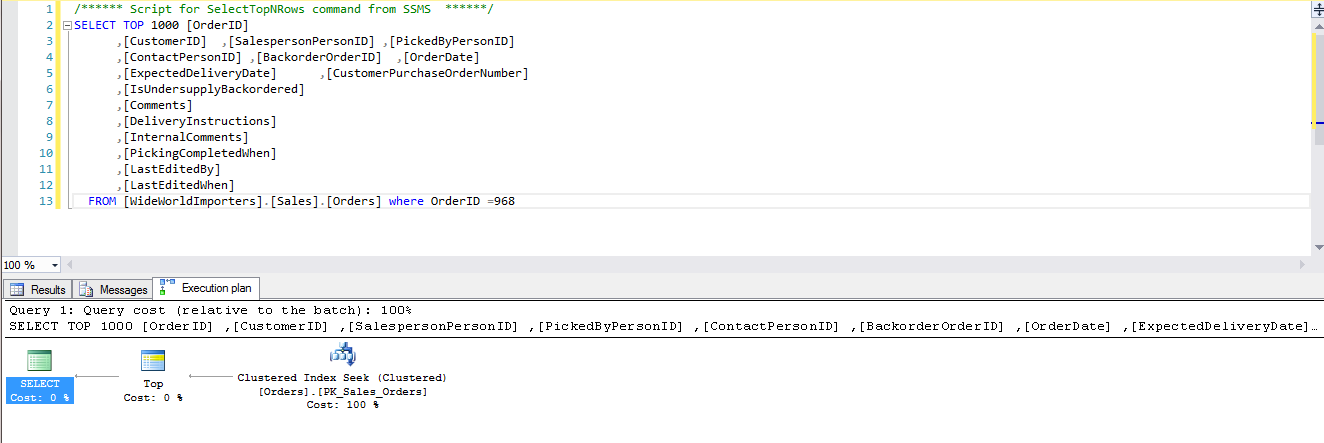
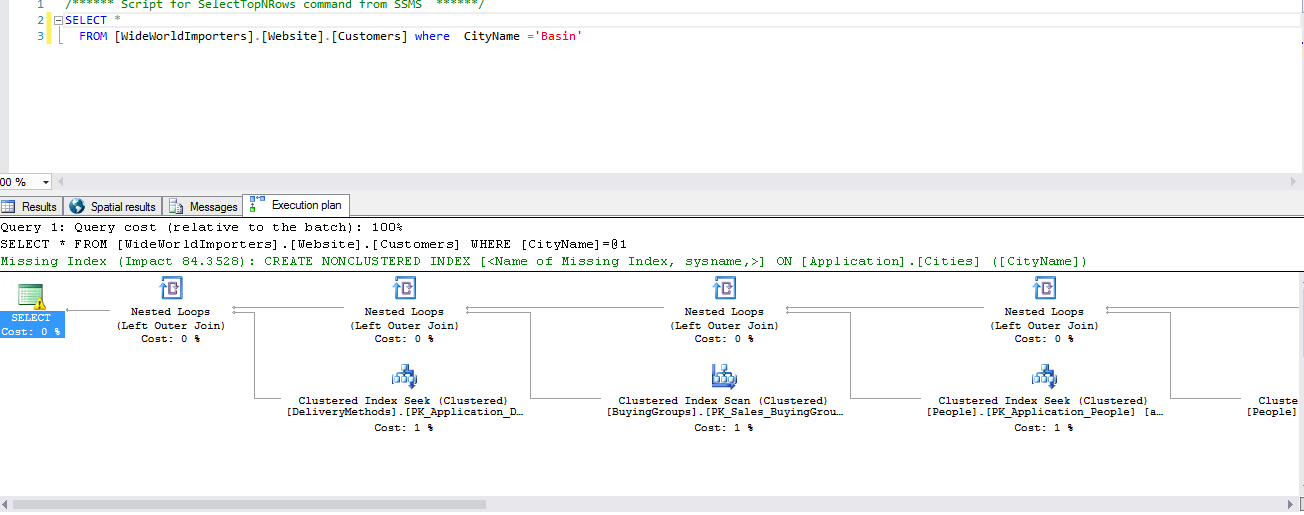
In the next step, I’ll run the same query with a different order ID in another query window with its actual execution plan.
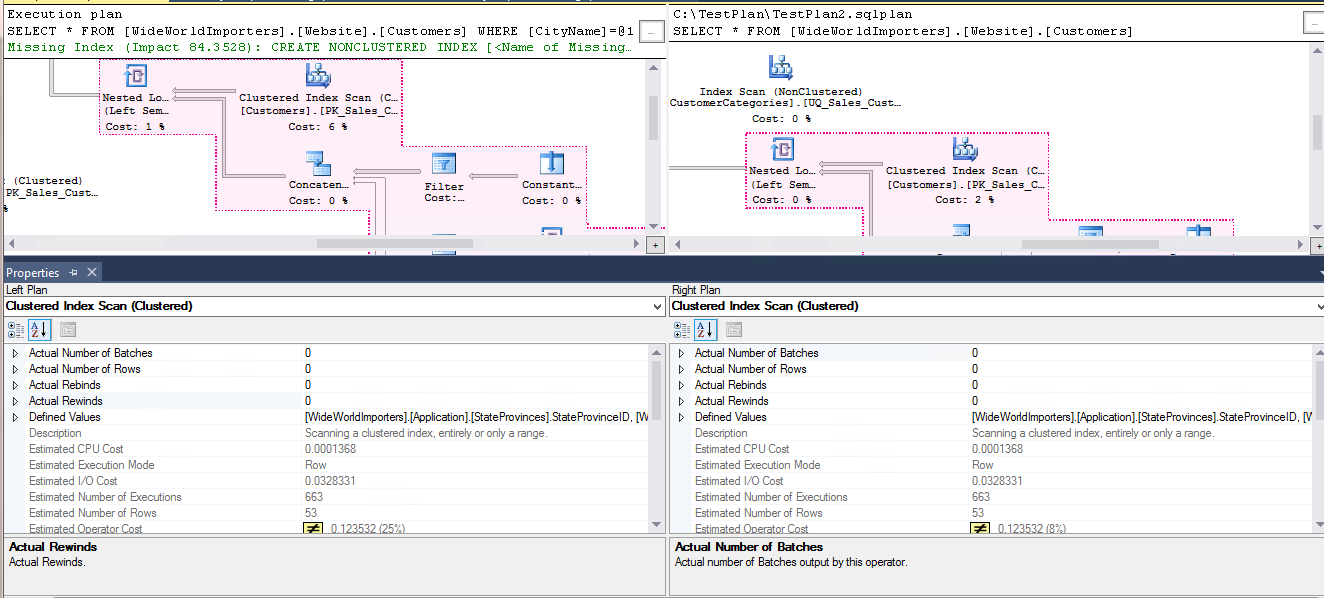
To compare the execution plan of both query executions simply right click on Execution plan ➜ Compare Showplan
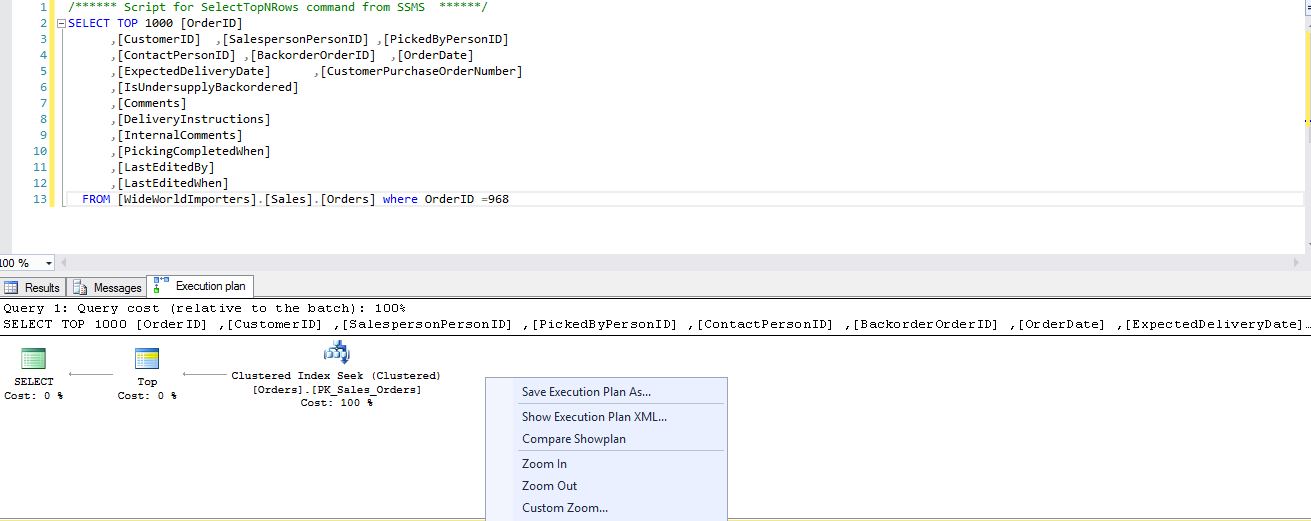
It opens a dialog box where we need to specify the location of the previously saved execution plan:
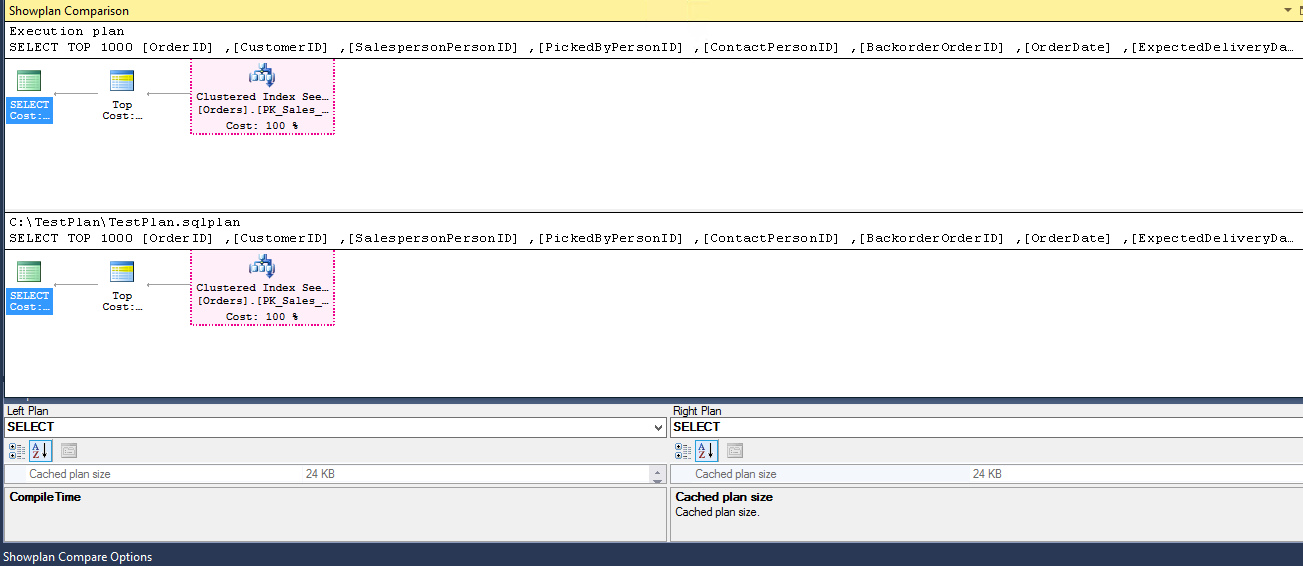
We can see both execution plans in the same screen with their properties:
By default, the comparison of both execution plans will be shown in top -bottom (horizontal) view. If we want to make it vertical, we’ll just right click on any Execution plan ➜ Toggle Splitter orientation
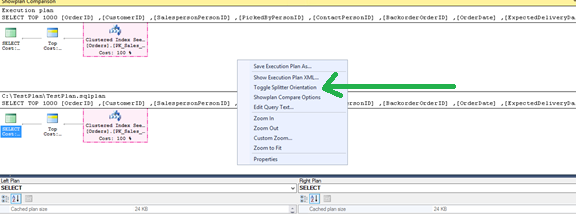
Both query execution plans are now adjacent to each other.
When two Showplans are compared, areas and operators of the plan, that do essentially the same thing, are highlighted in the same colour. This shows the operator that is essentially doing the same kind of operation in both plans.
As we can see in the example above, both execution plans are using clustered index seek operator.
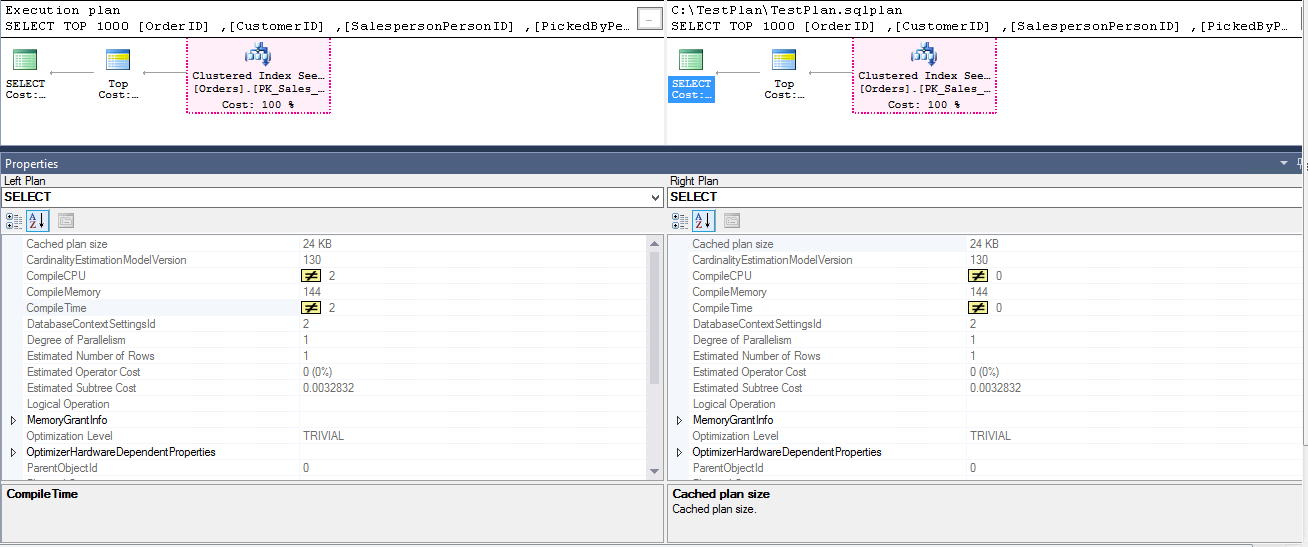
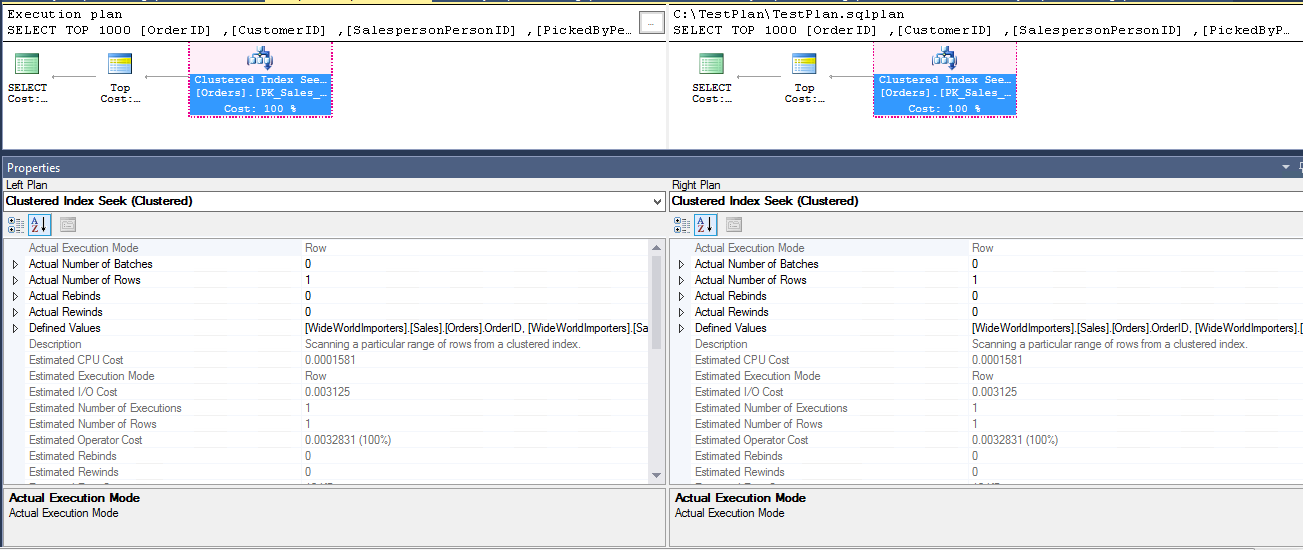
There is also a property dialogue box opened with both execution plans. It shows a lot of information about execution time, estimated number of rows, actual number of rows, logical operations, memory, CPU, parallelism, physical read, logical read, storage, table cardinality, number of executions, etc.
We can compare each execution plan operator in both queries. Suppose we want to see and compare the properties of a clustered index seek; just clicking on it will make the change in the properties section.
Comparing the execution plan of the already saved execution plan
We can compare the execution plan of the already saved query execution plan as well. To do so, just open the query execution plan in SQL Server Management Studio 2016. Once opened, right click on the execution plan, and click on the Showplan compare.
Comparing the execution plan of different queries
We can also compare the different queries execution plan with the same Showplan compare. In the below example I am doing a comparison for two sets of queries, that are running Index scan and Index seek operators separately.
In the below query, I am filtering the records instead of retrieving the complete table:
Now, we can do the showplan comparison:
We can compare both execution plans performing different queries with properties of each operation and then tune our query\workload accordingly. This also helps to design a query in multiple ways and then compare both.
Comparing the execution plan between different versions\cardinality of SQL Server
In my company, we used to upgrade the database to a higher SQL Server version (with better hardware too) but users complained that the query is responding slowly after the upgrade.
We can save the critical, or top resource consuming queries execution plan of the queries before the upgrade and after the upgrade to SQL Server 2016. We can compare the properties of both.
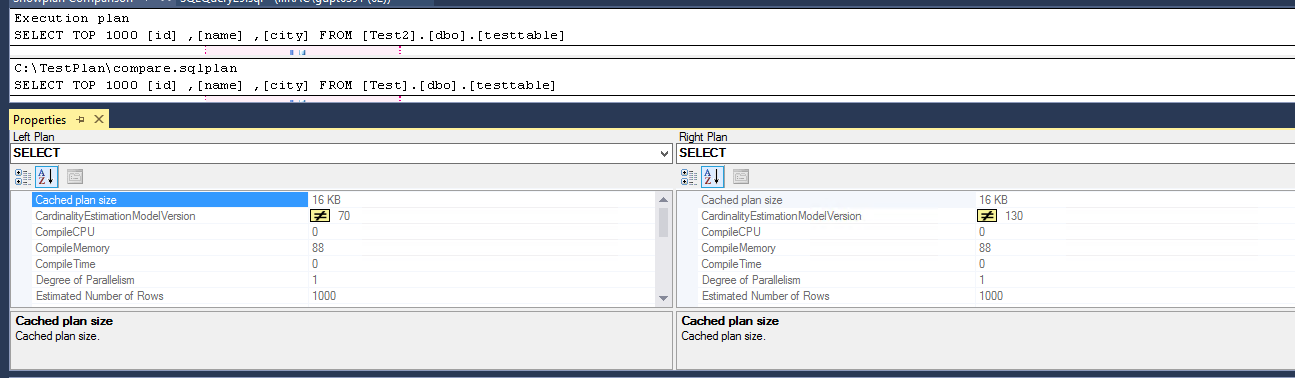
In the below screenshot, I have compared two similar queries but one is running with CardinalityEstimationModelVersion 70 while other is running with CardinalityEstimationModelVersion 130.
How to improve the query performance with the Compare Showplan
Normally, we are used to test the performance of our query before and after creating any index to see what overall impact that is actually making on the performance of execution plan operators.
The query that I am using here for the demo is:
|
1 2 3 4 5 6 7 8 9 10 11 12 13 14 15 16 17 18 |
/****** Script for SelectTopNRows command from SSMS ******/ SELECT ol.[OrderLineID] ,o.[OrderID] ,o.ExpectedDeliveryDate ,ol.[StockItemID] ,ol.[Description] ,ol.[PickedQuantity] ,ol.[PickingCompletedWhen] ,ol.[LastEditedBy] ,ol.[LastEditedWhen] FROM [WideWorldImporters].[Sales].[OrderLines] OL join sales.orders O on ol.orderid=o.orderid where ol.description like 'Tape%' and ol.LastEditedWhen >=getdate()-365 and o.ExpectedDeliveryDate >getdate()-180 and o.PickingCompletedWhen >getdate()-180 order by OrderLineID |
The execution plan for the query is :
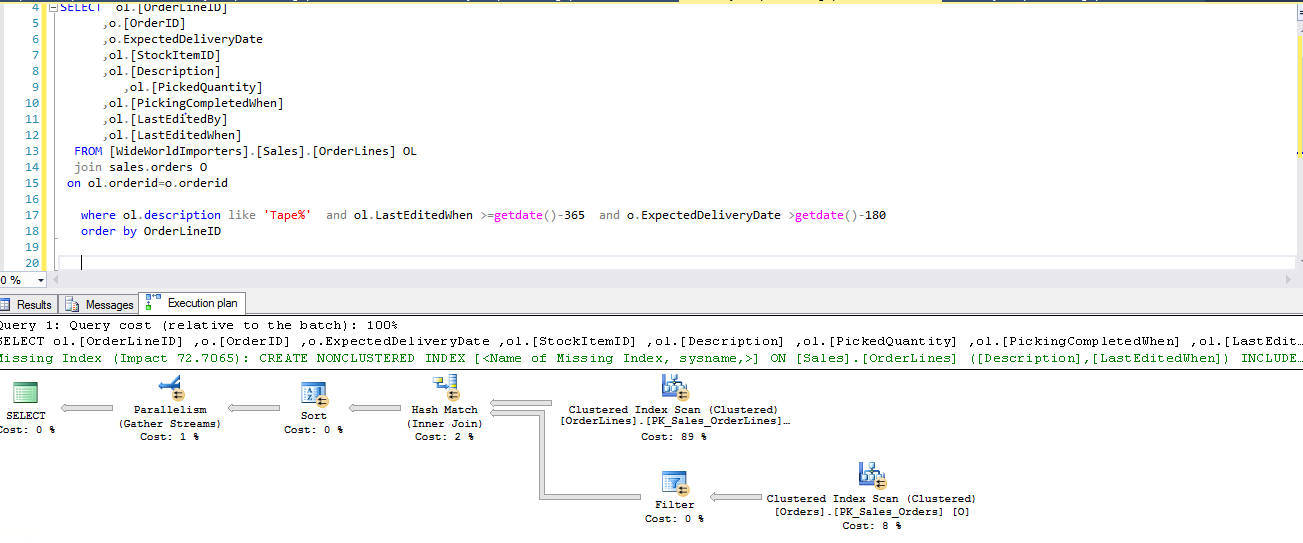
The execution plan is now showing the index recommendation with overall impact of 72%. Therefore, I created the missing index as per recommendation:
|
1 2 3 4 5 6 7 8 |
USE [WideWorldImporters] GO CREATE NONCLUSTERED INDEX [testplan] ON [Sales].[OrderLines] ([Description],[LastEditedWhen]) INCLUDE ([OrderLineID],[OrderID],[StockItemID],[PickedQuantity],[PickingCompletedWhen],[LastEditedBy]) GO |
The execution plan for the same query has been generated and the comparison is as follows:
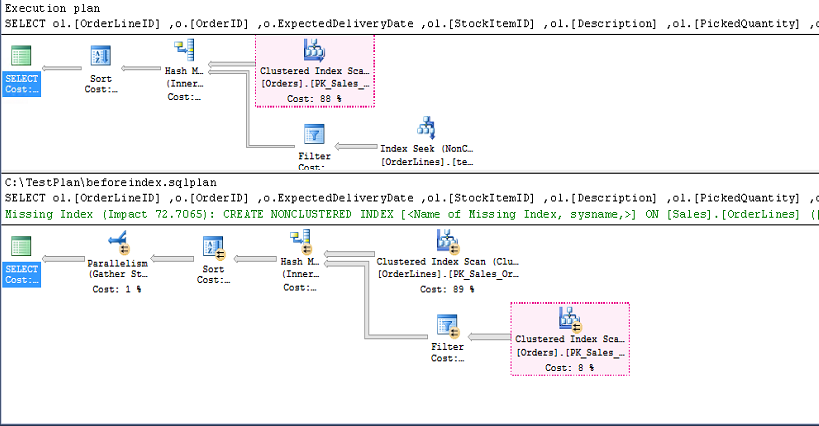
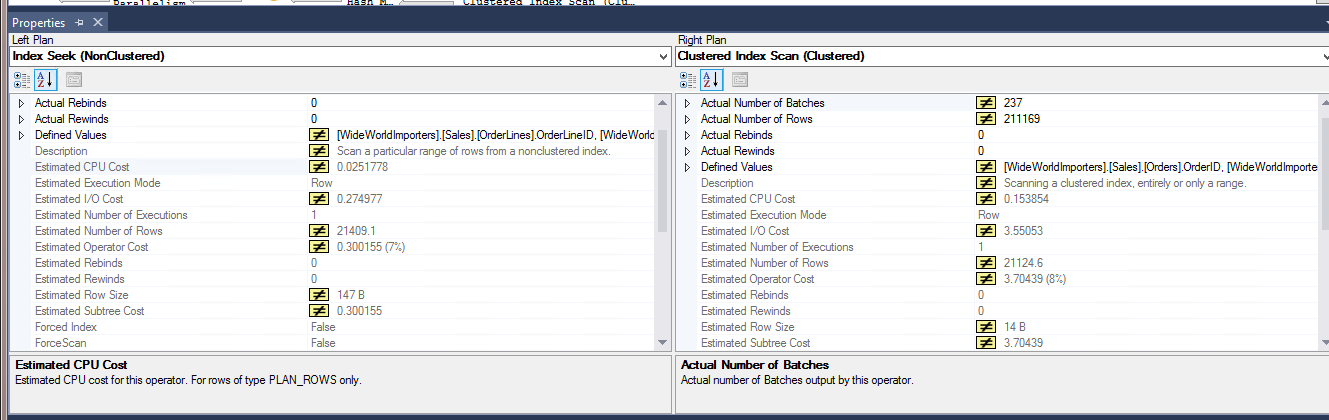
After the index creation, query is using the index seek instead of the clustered scan that has a good performance impact in case there is a large number of rows.
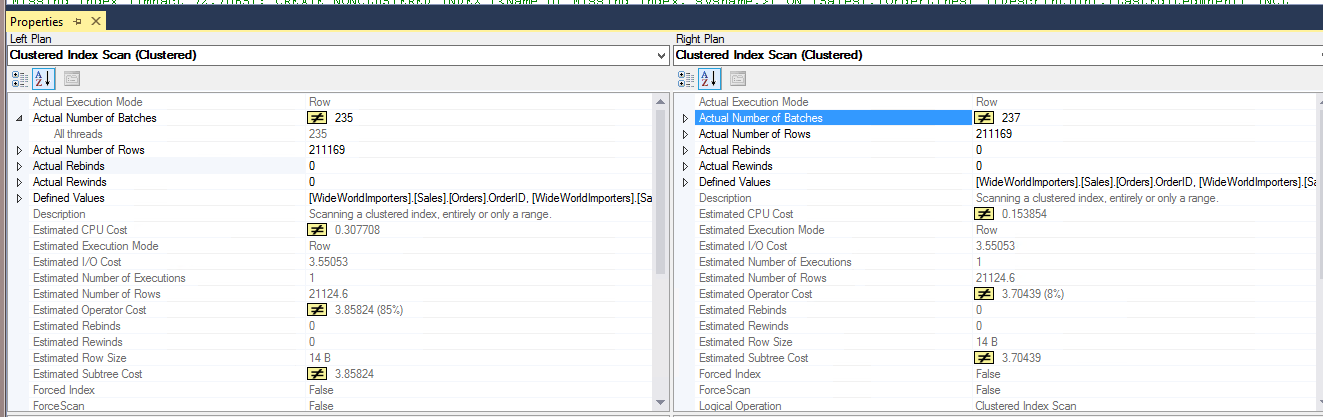
We can see the overall cost for the clustered index scan is now 8% compared to 88% after creating the recommended index. Furthermore, we can see the impact on using the properties where CPU cost is reduced from 0.307708 to 0.153854
It also shows the equivalent operator from another execution plan. For example, if we click on index seek operator it automatically selects clustered index scan operator from another execution plan.
The Showplan compare options
When we click on Showplan Compare, along with the execution plan compare, it also opens the Showplan Compare window:
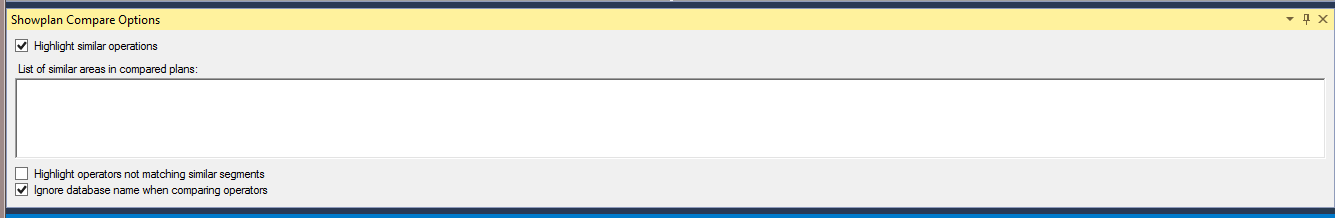
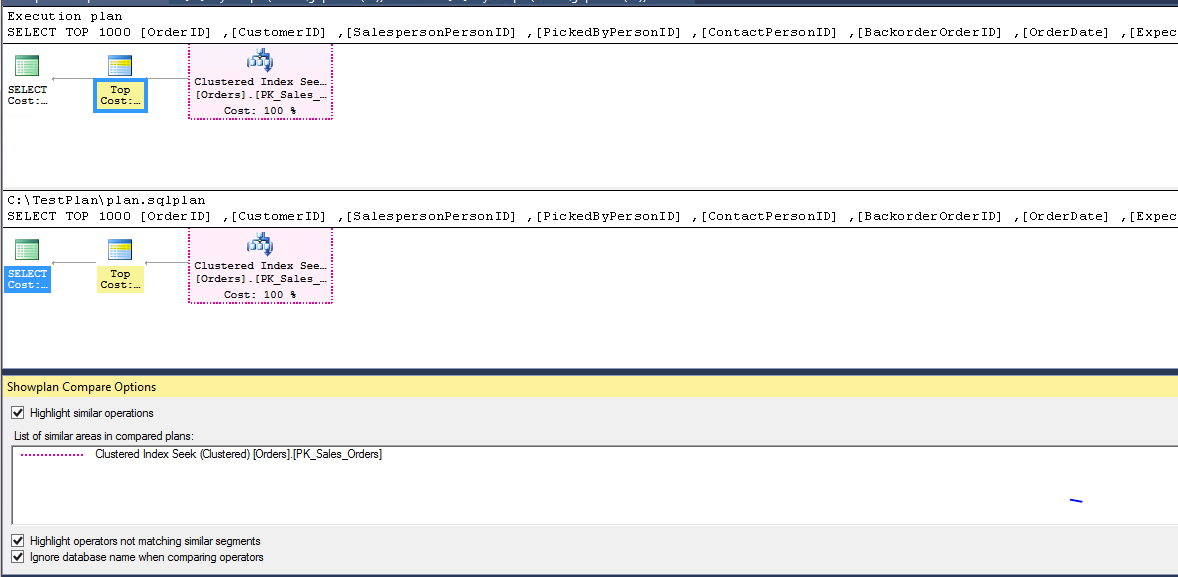
We have seen, in the examples above, that the similar operators are highlighted from both execution plans. We can control this behaviour using the Highlight similar operations option. By default, it is turned on.
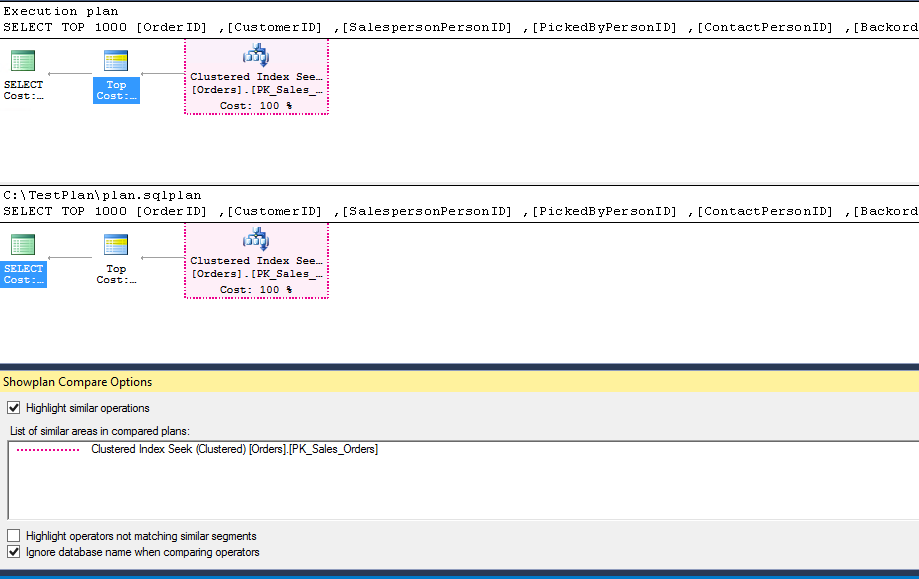
It shows the list of similar operators in the list of a similar area in a compared plan section.
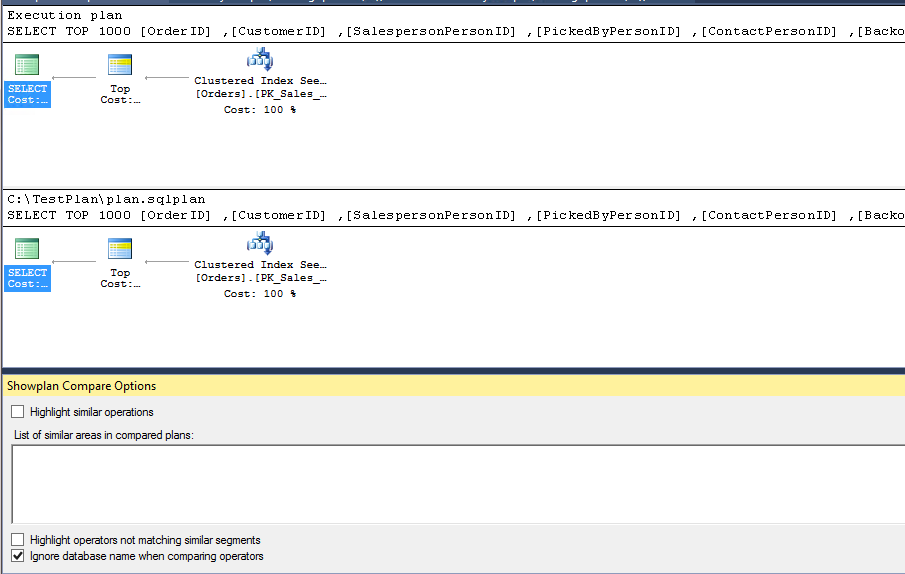
If we do not want to see the similar operator highlighted, we can simply uncheck the box:
If we want to highlight operators that are not matching similar segments, we can check the box as shown below:
Conclusion
The Compare Showplan is a useful feature, introduced in SQL Server 2016, which can help in troubleshooting real world scenarios, and in developing queries as well.

I am the author of the book "DP-300 Administering Relational Database on Microsoft Azure". I published more than 650 technical articles on MSSQLTips, SQLShack, Quest, CodingSight, and SeveralNines.
I am the creator of one of the biggest free online collections of articles on a single topic, with his 50-part series on SQL Server Always On Availability Groups.
Based on my contribution to the SQL Server community, I have been recognized as the prestigious Best Author of the Year continuously in 2019, 2020, and 2021 (2nd Rank) at SQLShack and the MSSQLTIPS champions award in 2020.
Personal Blog: https://www.dbblogger.com
I am always interested in new challenges so if you need consulting help, reach me at rajendra.gupta16@gmail.com
View all posts by Rajendra Gupta
- Understanding PostgreSQL SUBSTRING function - September 21, 2024
- How to install PostgreSQL on Ubuntu - July 13, 2023
- How to use the CROSSTAB function in PostgreSQL - February 17, 2023