
Whilst researching for the article Report filtering: Excel slicers vs SQL Server Reporting Services (SSRS) parameters, I discovered a new Excel Slicer feature in Microsoft Office 2016 that allows users to select/deselect multiple items without having to hold down the control (Ctrl) keyboard key. For some people, this may not be a sufficient reason to upgrade to Office 2016 but for developers of business intelligence (BI) solutions, this new feature further enhances the experience of consumers of BI solutions.
Background
Since its initial release in Office 2010, slicers have always been part of the excel reports that I produce for my clients. As per the explanation here, slicers have several advantages to the traditional filtering approach that has long existed in Excel Pivots. Some of these advantages can be summarised as follows:
Easily visualise items you have filtered on
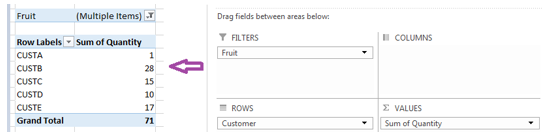
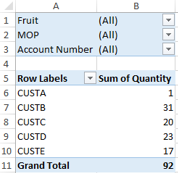
Some of the negative feedback relating to my excel reports had nothing to do with my report development but limitations of the tool in that users were usually frustrated when attempting to identify items that they have chosen as filters. For instance, Figure 1 shows my fictitious fruit sales report by total quantities of fruits purchased per customer. The screenshot shows that there are filters in the report but there is now way of knowing the actual items except for that there are (Multiple Items).

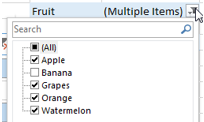
Figure 1: Traditional Excel Pivot Report Filter In order to identify the items, you would have to click the dropdown, as shown in Figure 2. This is less frustrating because dataset from my fictitious scenario is small, but if you are referencing datasets from production systems – you are more likely to scroll down the list just to see the selected items.
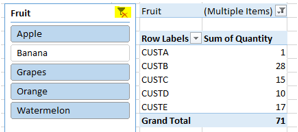
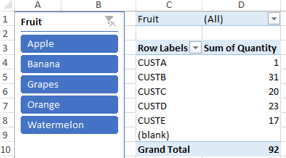
Figure 2: Multiple Items in Traditional Excel Pivot Report Filter On the other hand, however, a slicer not only indicate the presence of filters (as highlighted in Figure 3), I can also see the selected filter items.
Figure 3: Filtering using Excel Slicers Visually Indicate items with no data
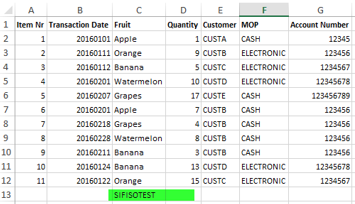
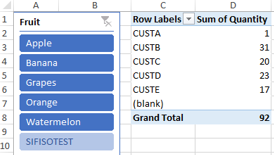
Another benefit to using slicers is that you can visually indicate items that have no data. Say for instance, we refactor our dataset and add a dummy type of fruit called – SIFISOTEST, as shown in row 13 of Figure 4.
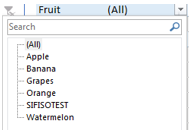
Figure 4: Dummy Fruit Type Once we have refreshed the pivot report, we can see in Figure 5 that SIFISOTEST is now part of items of our fruit slicer. It can also be seen that because there are no transactional data associated with this new dummy fruit, the background colour of the SIFISOTEST fruit is different to other items. Thus, report users can intuitively see that SIFISOTEST has no data.
Figure 5: Updated items of in fruit slicer However, this works differently in the traditional filter as it can be seen in Figure 6 that there is no convenient way to differentiate items that do not have data.
Figure 6: Updated items of in fruit filter Hide items with no data
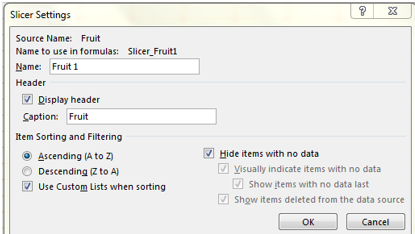
Another advantage of slicers is that they allow users to exclude filter items with no data from showing up in a slicer. This is achieved via the Slicer Settings property as shown in Figure 7.
Figure 7: Slicer settings dialog box Immediately after you have clicked the OK button to save your Slicer settings, the SIFISOTEST item disappears from the slicer list as shown in Figure 8.
Figure 8: Slicer items without SIFISOTEST fruit Custom Slicer Positions
Much of report development has to do with working on the look and feel of the report. Some of the frustrations with traditional report filter in Excel is that you cannot move the positions of your report filters.
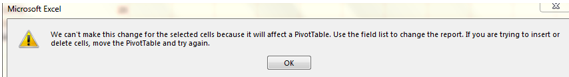
Figure 9: Traditional filter positions For instance, if you try cut and move the filters in rows 1-3 shown in Figure 9 to be underneath the grand total row or delete row 4, you will run into a cells locked error message as shown in Figure 10.
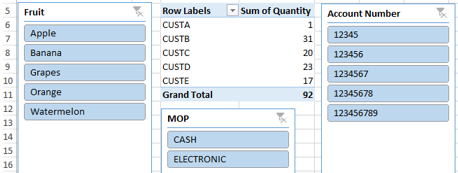
Figure 10: Filter error message This limitation is resolved in slicers as you are able to move them around as shown in Figure 11.
Figure 11: Slicers in different positions
The New Feature
Although since its release in Office 2010, slicers continue to be located in the INSERT menu over the releases, they have evolved in terms of graphical icons as well as functionality. In Office 2010, the slicer was a simple control that looked as shown in Figure 12.
Although no functional slicer feature was added during the release of Office 2013, a new graphical slicer icon was introduced along with a new slicer sibling, the Timeline filter – as shown in Figure 13.
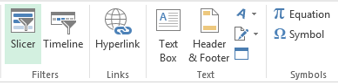
In Office 2016, the slicer and timeline filters return with similar graphical icons but with a new functionality for selecting and de-selecting filter items as shown in Figure 14.
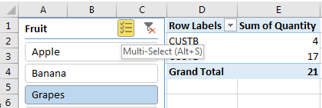
As soon as you add a slicer, you will notice the new icon next to the Clear Filter button. Now, if you want to filter our fictitious dataset on Grapes and Apples – you just activate multi-select by clicking on the new icon and then select the two fruit names.
Couple of things to note:
- To disable multi-selection, click on the icon again – which will reset it background colour to a transparent white.
- The multi-select button can be used to both select and deselect/remove multiple items from the slicer
- Like so many controls in Microsoft Office, there is a keyboard shortcut for enabling the multi select without clicking the button. That is done by, Click alt S
- If you prefer the old way of doing things, you can still control keyboard key to select/deselect items
- One noticeably difference with slicer is that you can add duplicate slicers and the report won’t notice it
Conclusion
Ever since the initial introduction of slicers in excel 2010, report usability experience has been enhanced as slicers continue to be a better alternative to traditional report filters. The introduction of an effortless multi-select slicer in further strengthens excel as one of the leading data visualisation tools for many report users.
Reference

Sifiso's LinkedIn profile
View all posts by Sifiso W. Ndlovu