
In this article, we will show how to create a simple SQL Server Reporting Services report from a SSAS Tabular model database as a data source, using DAX query, and then deploy it.
For this example, the requirements include SQL Server Data Tools version 2013 or higher, SQL Server version 2014 or higher, with installed SQL Server Reporting Services instance in Native mode (used in this article) and SQL Server Analysis Services instance in Tabular mode with deployed Tabular model database.
All of the steps of creating and deploying the customized SSRS report take place fully in SSDT.
-
Creating a Report Server project
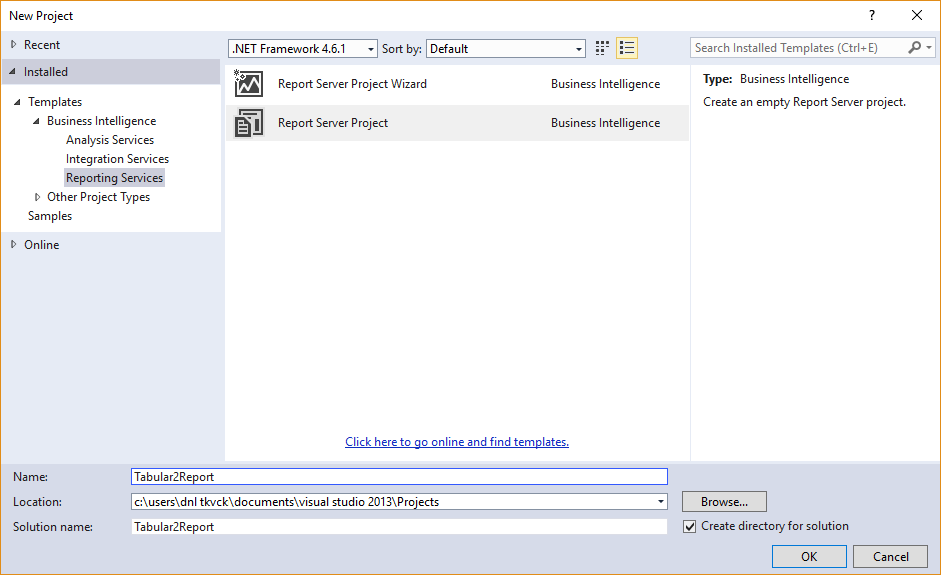
Create a new Report Server Project and give it a custom name and solution name (for this occasion, Tabular2Report). This is the base for the future SSRS report.

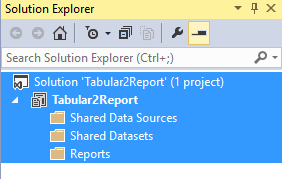
After creating the project file, these elements should appear in Solution explorer docked window:
The file Tabular2Report (below Solution) is the actual Report Server project. It contains separate shared folders for data sources, datasets and report definition files.
-
Adding Data Source
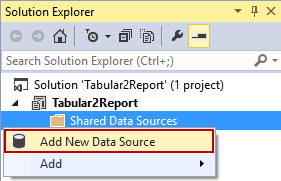
Right-click on folder Shared Data Sources and select the Add New Data Source:
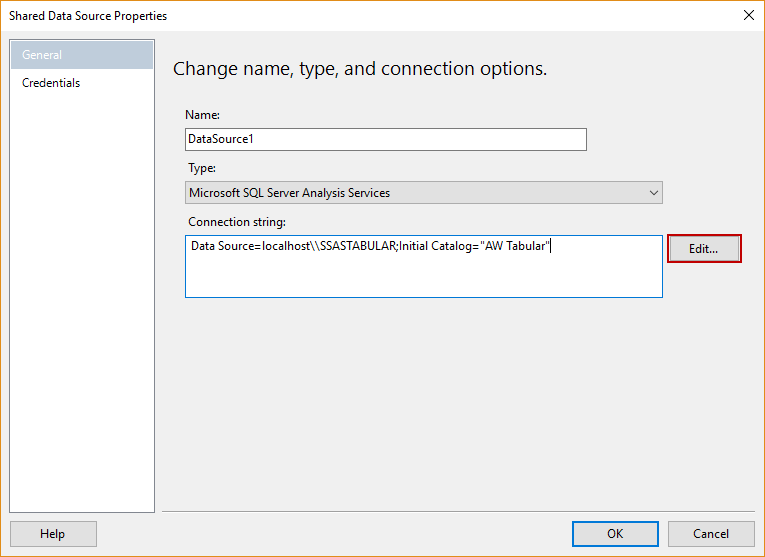
The Shared Data Source Properties dialog appears:
In General tab, set the name (or leave a default), choose type of data source (in this case, that will be Microsoft SQL Server Analysis Services), and input the connection string, regarding this form:
123Data Source=localhost\\<name of the SSAS Tabular instance>;Initial Catalog="<name of the cube>"Note: The actual source of data is a SSAS Tabular instance, and the cube is considered as a “catalog”. SSRS catalog contains all objects and data related to SSRS, including shared data source, shared datasets and report definition.
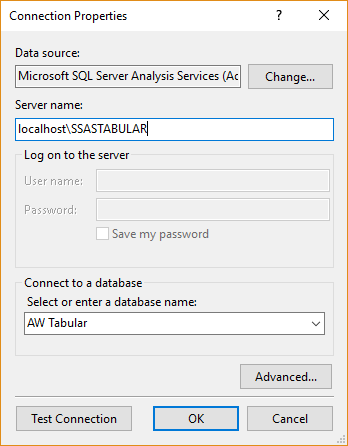
Alternatively, a data source can be set by editing a connection string in the Connection Properties dialog (click the Edit button, shown in picture above):
Note: To verify the validity of the chosen server instance and database, click on “Test connection” button.
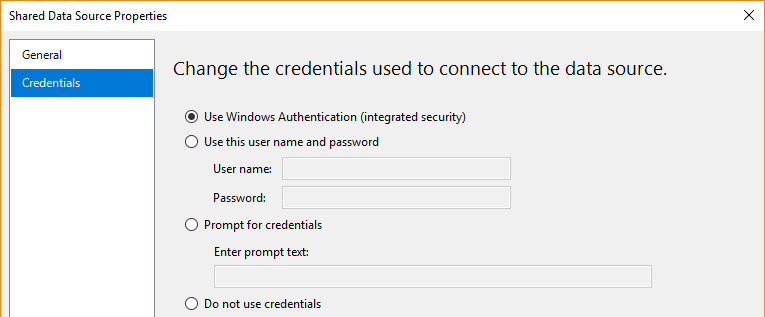
After that, set a valid credential for SSAS Tabular database in Credentials tab:
For this occasion, Windows authentication with integrated security will be used.
-
Adding Dataset
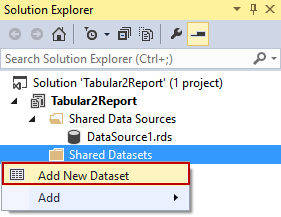
Add a dataset within right-click on Shared Datasets folder:
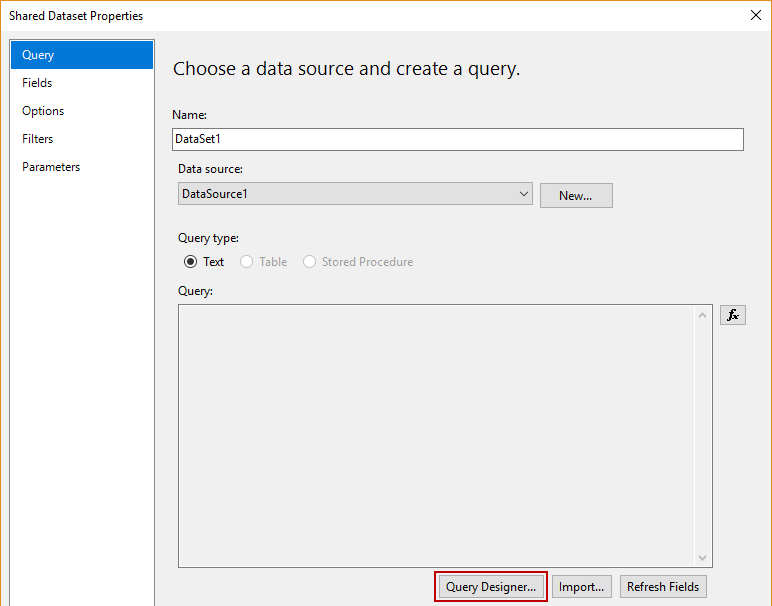
The Shared Dataset Properties dialog will appear. In the Query tab, click on Query Designer button:
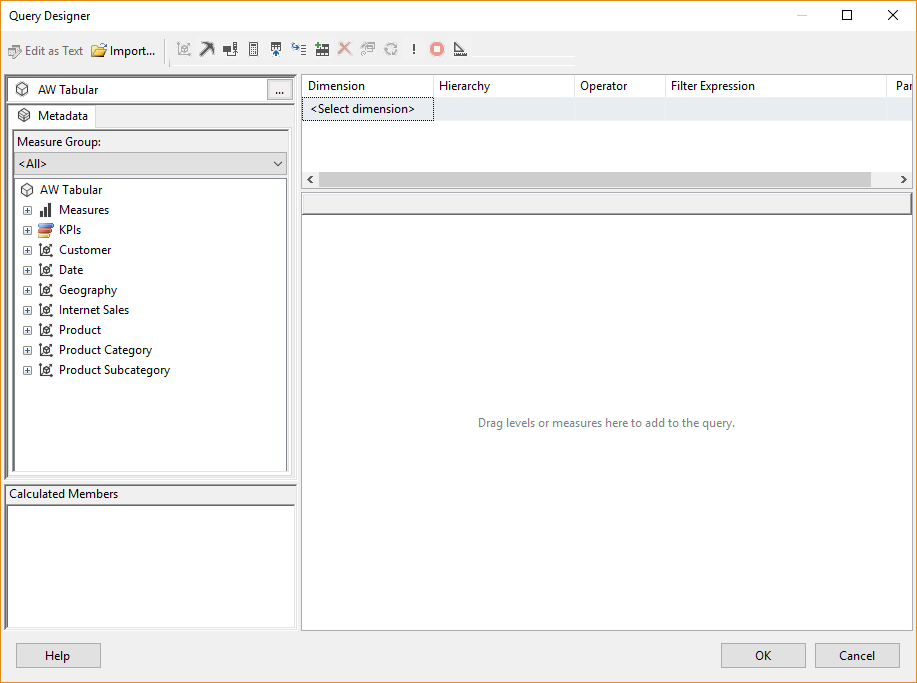
The Dataset for this project will be created through DAX query in query designer:
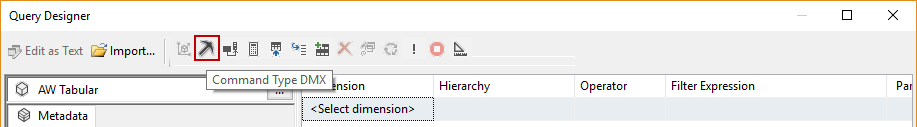
At this moment, query designer holds MDX queries by default, so Command type DMX must be set:
Note: SSAS Tabular model supports DMX extension, which is query language for data mining models. In this case, Tabular database will be considered as a mining model, in order to override the limitation of using DAX query in SSDT.
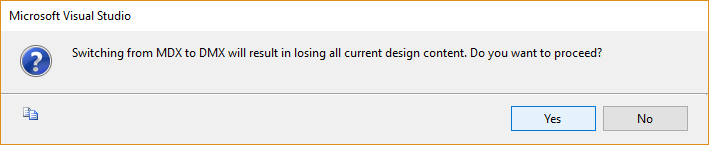
Click Command type DMX and confirm:
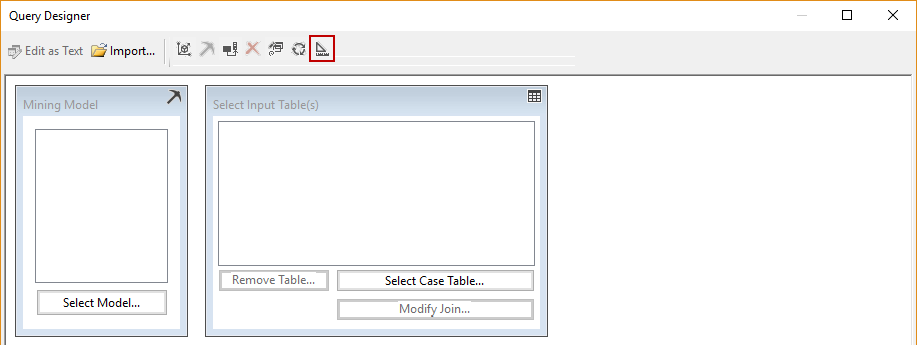
After confirmation, switch to the Design mode, by clicking button as shown:
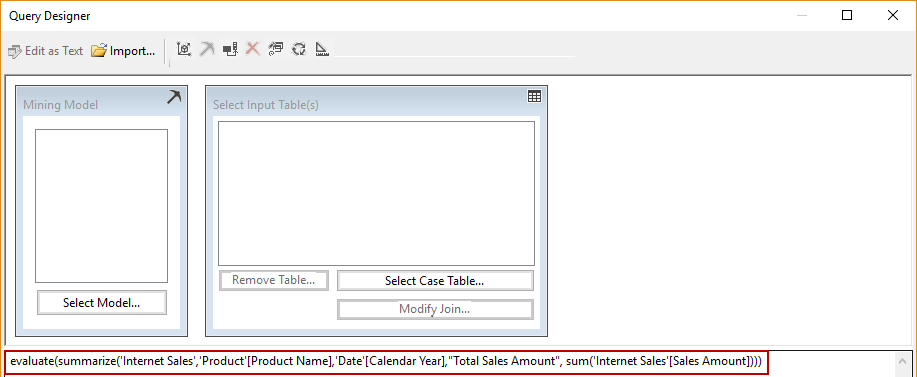
Input this DAX query below into specified field and confirm:
123evaluate(summarize('Internet Sales','Product'[Product Name],'Date'[Calendar Year],"Total Sales Amount", sum('Internet Sales'[Sales Amount])))
This query retrieves and wraps up the following objects from the cube into dataset: full table Internet Sales, columns Product Name (from Product table) and Calendar Year (from Date table) and the calculated measure Total Sales Amount.
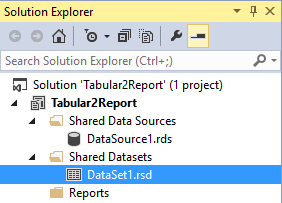
After confirmation, double-click on the created Dataset, which shows in Solution explorer:
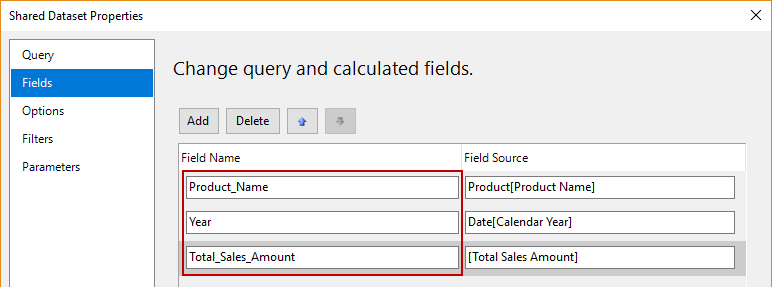
Go to the Fields tab, and rename Field Name strings as shown in the picture below, and confirm:
With simplified field names like this, it will be easier to use them in report designing.
Note: Space character cannot be used when renaming, because it raises error.
-
Creating a report definition file
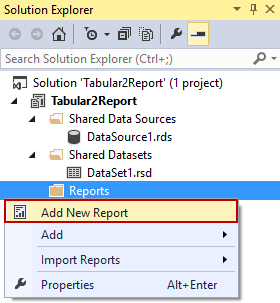
Create a report definition with right-click on Reports folder:
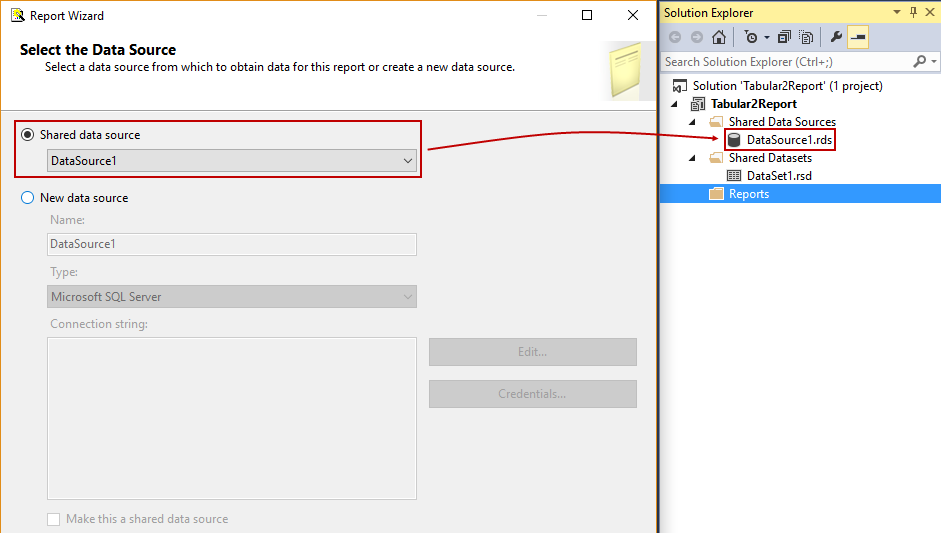
Previously set Shared Data source should appear in Report Wizard dialog:
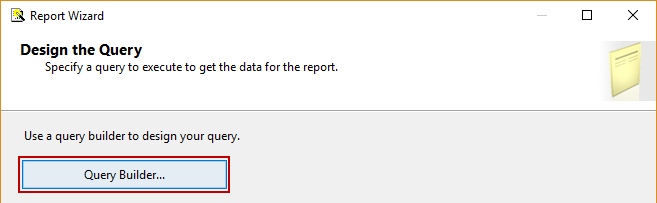
In the next step, click on Query Builder button:
Note: In Query Builder, the Command type DMX and Design Mode options must be chosen, one after another, in order to successfully insert the query (see Add Dataset section of this article)
Input the query, same as the one mentioned before:
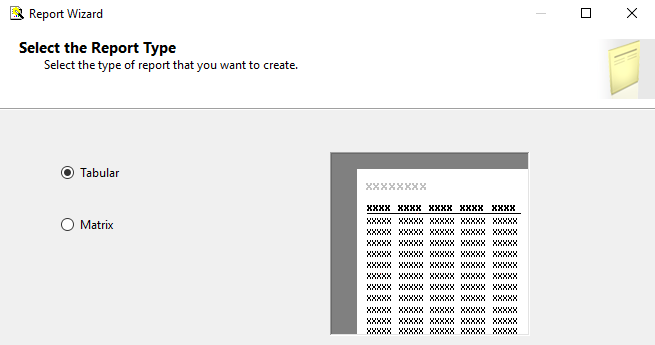
123evaluate(summarize('Internet Sales','Product'[Product Name],'Date'[Calendar Year],"Total Sales Amount", sum('Internet Sales'[Sales Amount])))After that, select the Tabular type of report:
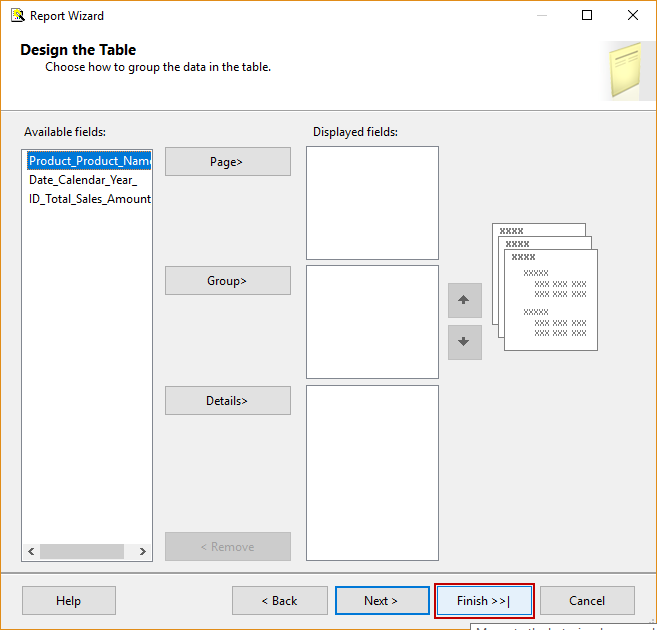
From this point, as shown in the picture below, Report Wizard leads through a basic table design. In this article, we will leave default settings for report building, by clicking Finish:
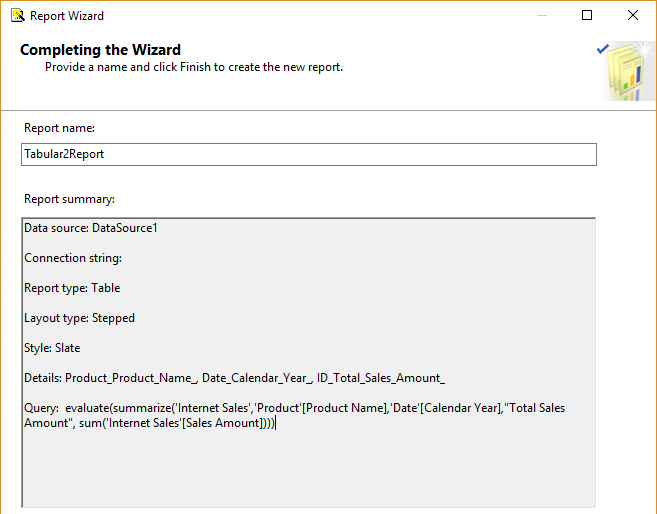
Next step is summary of the future SSRS report:
Set a custom name (in this case, it is Tabular2Report), review the report summary and then confirm the creation of the report definition file.
-
Tabular2Report customization
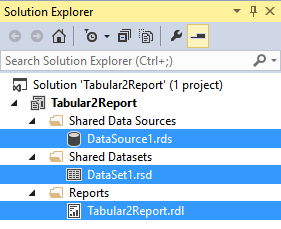
After successful creation of three necessary files for this Report project, they will appear in the Solution Explorer:
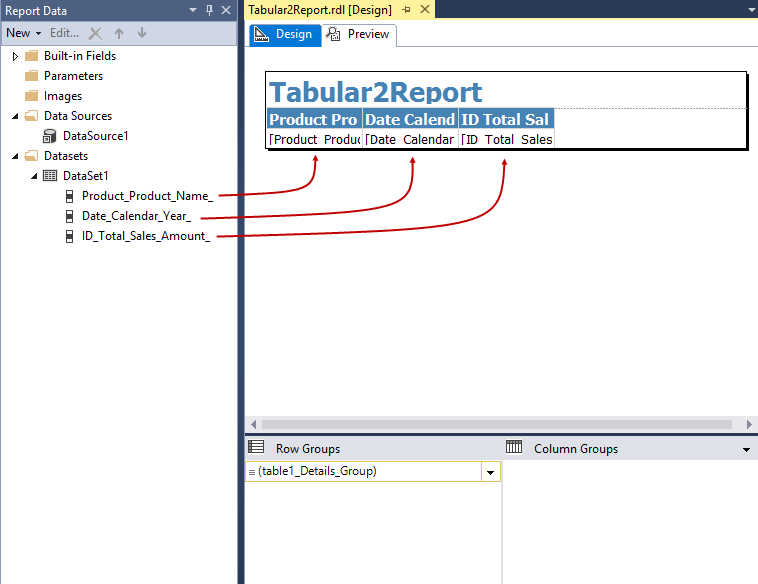
Tabular2Report report definition already has predefined design, as shown in the picture below:
The elements of the report definition design are fully customizable (tables, cells and other elements). As can be seen, there is a label with a name of the file and table with the header and corresponding cells which contain the elements from the Report Data docked window (placed left in the picture above).
After a customization, Tabular2Report design looks like this:
Beneath table header, these cells contain the parts of defined dataset, columns Product Name, Year and calculated measure Total Sales Amount, which will correspond with the DAX query.
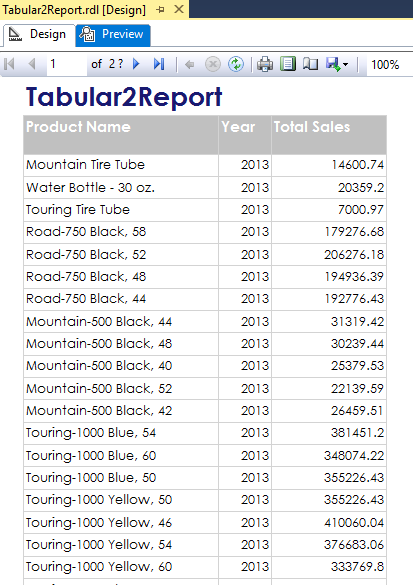
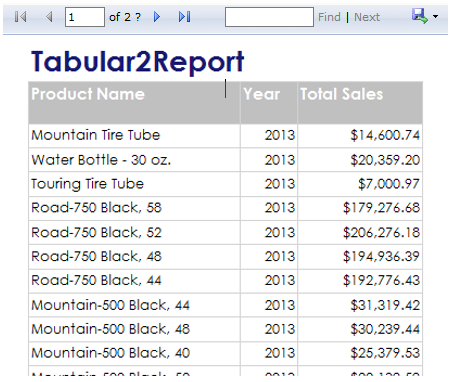
To see fully generated report, click the Preview tab:
Notice that tabular view expands and show all of the rows within tables, and also the calculated measure shows the results.
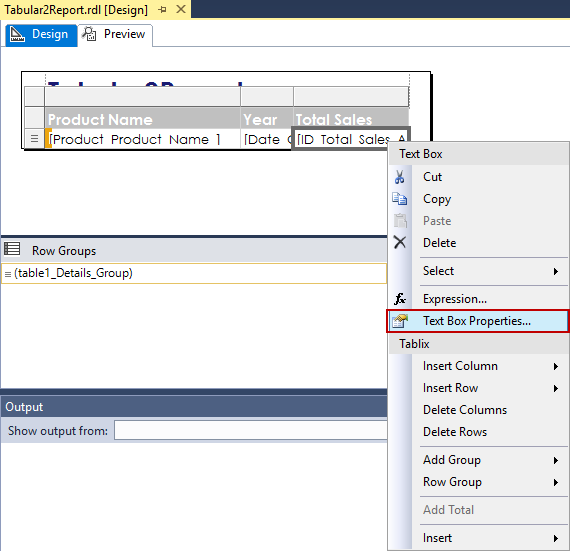
We will add a currency symbol in rows from Total Sales column, by right-click on the Text Box properties:
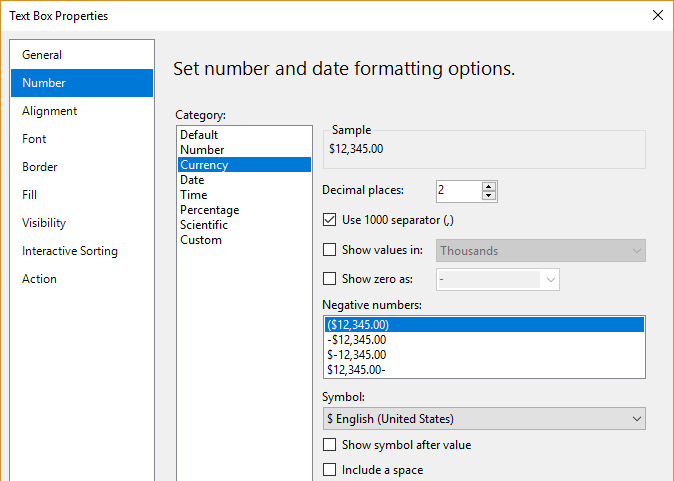
In Number tab, Currency category, set that currency symbol stands before value, as shown in the picture below, and confirm:
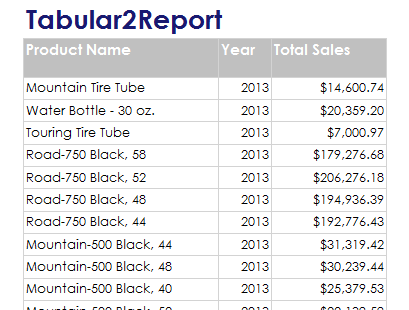
Now look the report in Preview tab, as the currency sign is present:
-
Deploying files to the Report Server
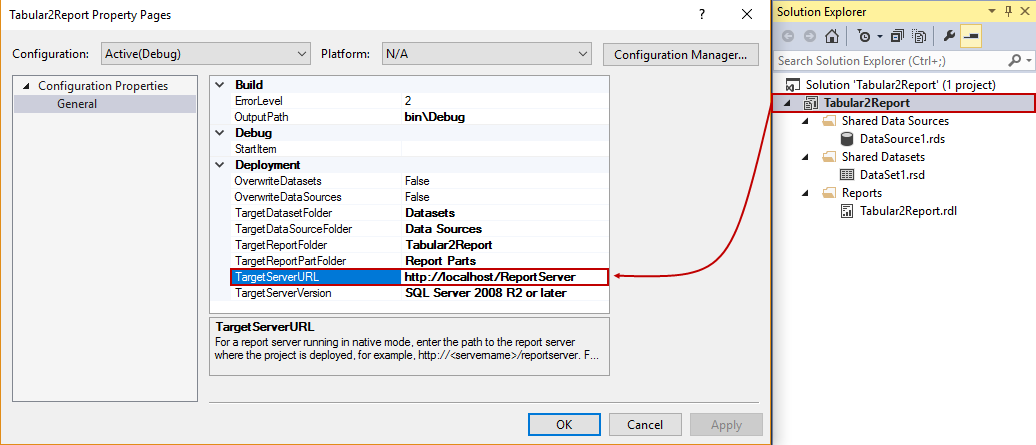
To deploy Data Source, Dataset and the Report definition file itself, set the target URL of Report Server, within properties:
Build and deploy every particular file from the project: DataSource1.rds, Dataset1.rsd, and Tabular2Report.rdl.
Note: If Target URL is not reachable or invalid, troubleshoot the Report Server
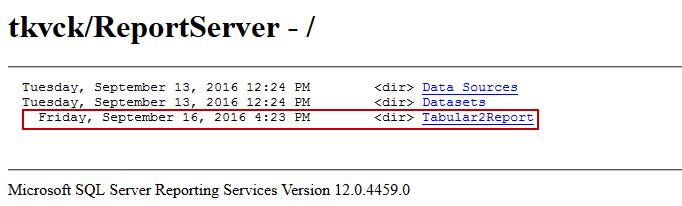
After successful deployment, all these files should appear the Report Server folder:
Also, the report can be rendered in a browser, to see it in its entirety:

I hope you enjoyed creating a simple SSRS report from a SSAS Tabular database!
References
- How to create a SQL Server Reporting Services (SSRS) report
- Create a Basic Table Report (SSRS Tutorial)
- Getting Started in Report Designer (SSRS)

Daniel is currently working for ApexSQL LLC as Software sales engineer where he specializes for the BI environment.
- How to monitor the SQL Server tempdb database - July 6, 2017
- How to monitor total SQL Server indexes size - June 12, 2017
- How to set and use encrypted SQL Server connections - May 8, 2017