
Microsoft has recently launched SQL Server 2016 with lots of new features like row level security, always encrypted, stretch database, PolyBase, R Services, hybrid cloud capabilities, Dynamic Data Masking, query store, etc. There is a rich set of business intelligence, security features, and high availability solutions.
There were no major enhancements to SSRS in previous versions of SQL Server. With the release of SQL Server 2016 though, there are many new features in SSRS, along with a change in existing reporting layouts. Some of the important changes in SSRS are:
- Brand new Reporting services web portal
- Custom branding for the web portal
- Key performance indicators (KPI) in the web portal
- Mobile reports
- Power BI dashboard
- TreeMap and Sunburst Charts
- Subscription Improvements
- Report Builder improvements
Mobile reports in SQL Server
SQL Server 2016 takes a next step in reporting services by introducing Mobile reports. With the increase of smartphones and tablets, it is very much necessary to create the reports that are accessible, compatible on mobile and tablets. There are different screens sizes available for mobiles and tablets so the reports should have optimal viewing experience on these devices.
Microsoft acquired mobile business intelligence and data visualization leader Datazen Software in 2015. SSRS mobile reports are built on Datazen technology.
Mobile report publisher tool Installation
We need to install the Mobile Report Publisher tool to create mobile reports. Use this link to download the tool.
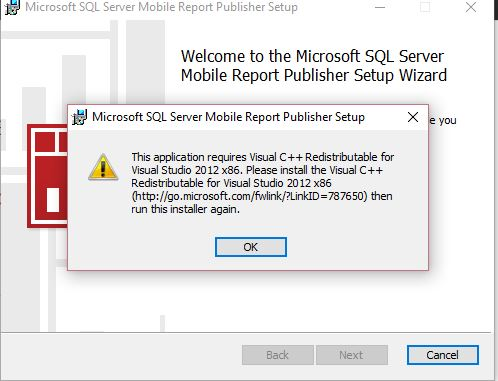
This application requires .NET Framework 4.5 (or later) and Visual C++ Redistributable for Visual Studio 2012 (x86). We get the error if Visual C++ Redistributable for Visual Studio 2012 (x86) is not present.
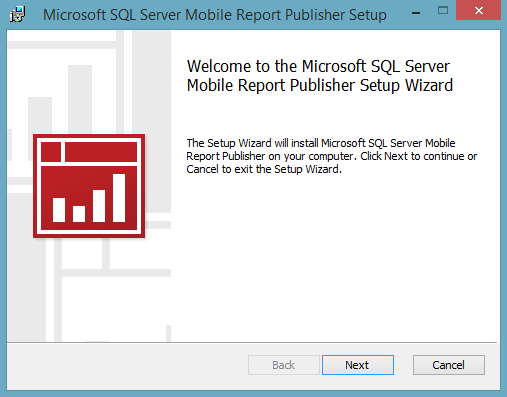
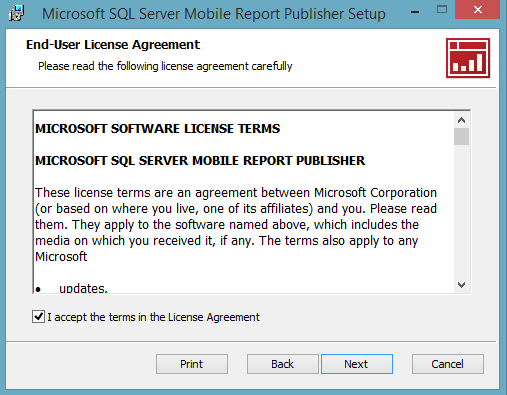
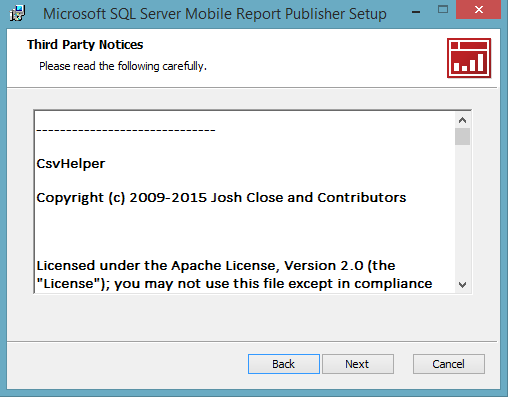
After installation , the Mobile Report publisher installation is as shown below.
To create reports, launch Microsoft SQL Server Mobile Publisher and it will appear as below
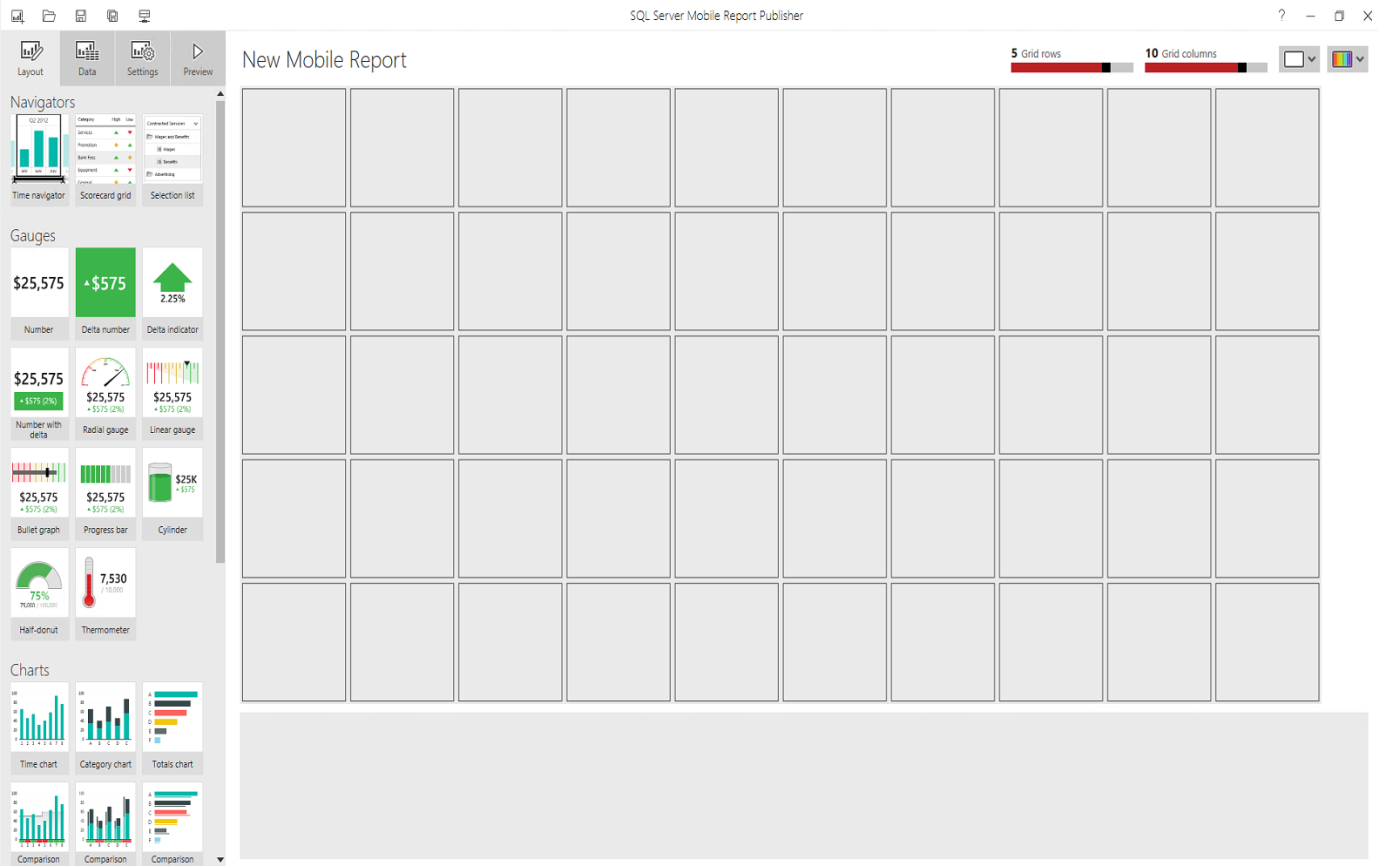
SQL Server Mobile Report Publisher consists of multiple parts as below.
- Layout (Navigators, Gauges, Charts)
- Data (Add data, Refresh all data, Export all data)
- Reports settings
- Preview ( master, tablet, mobile mode)
- Grid control
- Layout control
Create new mobile report
To create new mobile report, we need to import data. We can add data from either an Excel worksheet or the Report Server.
Click on add data provides options as shown below
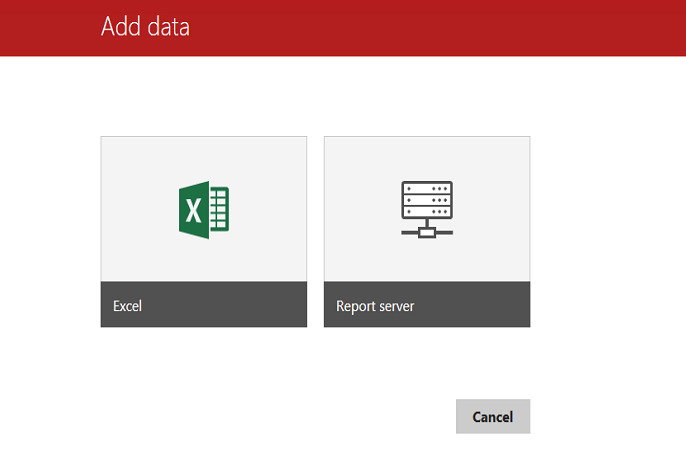
If we want to add the data from the report server, click on the report server and provide the report server address along with the credentials.
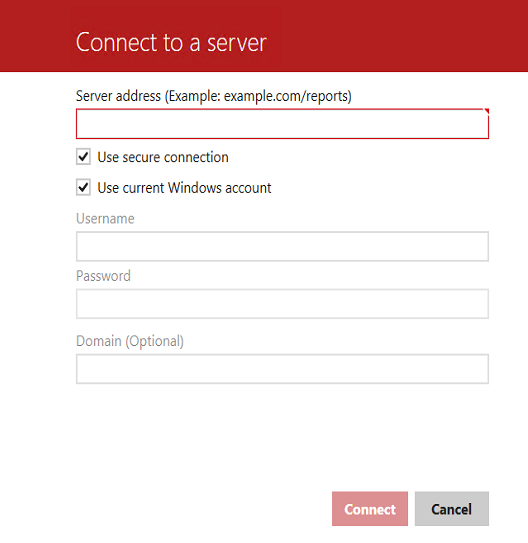
Now click on connect and it will display the reporting site name after connected. The dataset should be created first to be utilized here. We can select the dataset that we want for the data purpose.
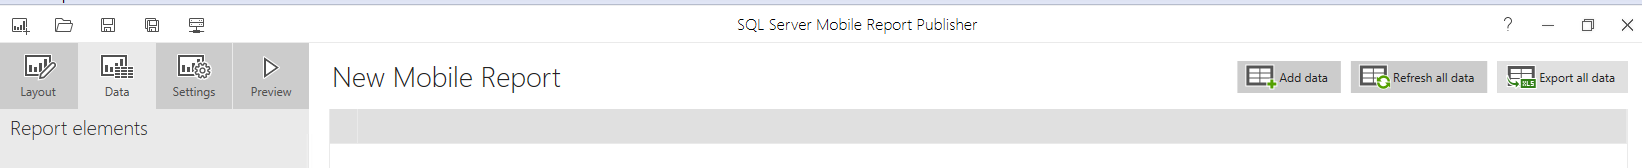
If we want to update the data, later on, we can use option ‘Refresh all data’. Apart from this ‘Export, all data’ option can be used to export data into excel sheet.
Report settings
Before we start configuring new reports, we can do some customization for the reports. Click on Settings tab shows the options.
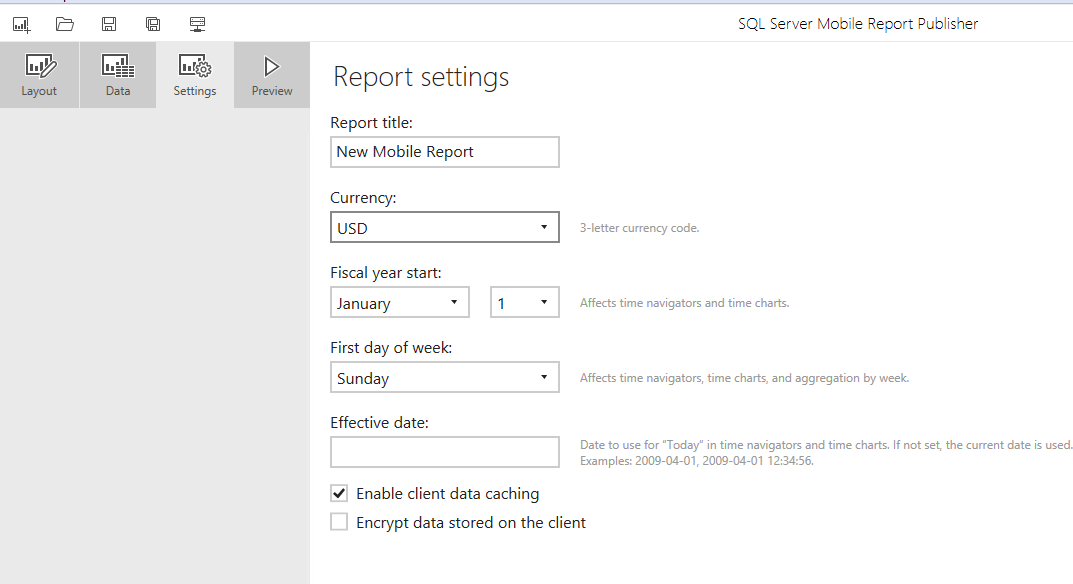
Report Title: The report title will appear in the report header. By default, it is New Mobile Report.
Currency: By default, it will take currency like USD, there are various currency options available as a drop-down.
Fiscal year start: we can specify the fiscal year start as well. Some countries have their fiscal year start from April so we can change it accordingly.
The first day of the week: We can define the first day of the week, by default it is Sunday.
Effective date: we can also define an effective date for “Today” in the format of yyyy-mm-dd or yyyy-mm-dd hh:mm:ss.
Enable client data caching: this option gives the ability to enable or disable client data caching, this is default enabled.
Encrypt data stored on the client: If we want to store the sensitive data at the client level, we can enable this.
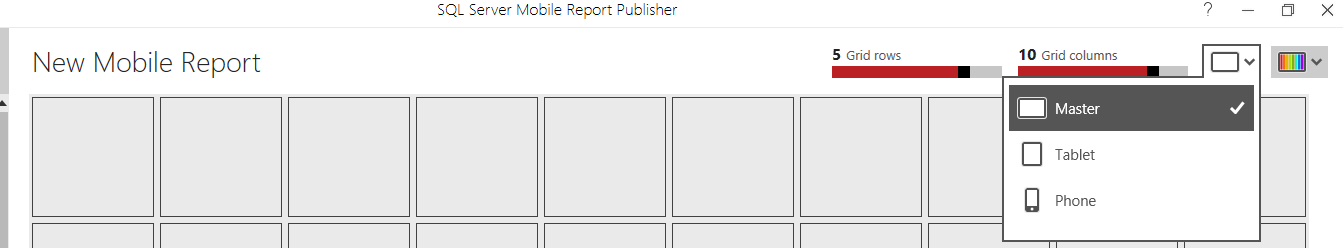
Layout of mobile reports
We can choose from the layout mode as Master, Tablet, and Phone. By default, it is the master layout.
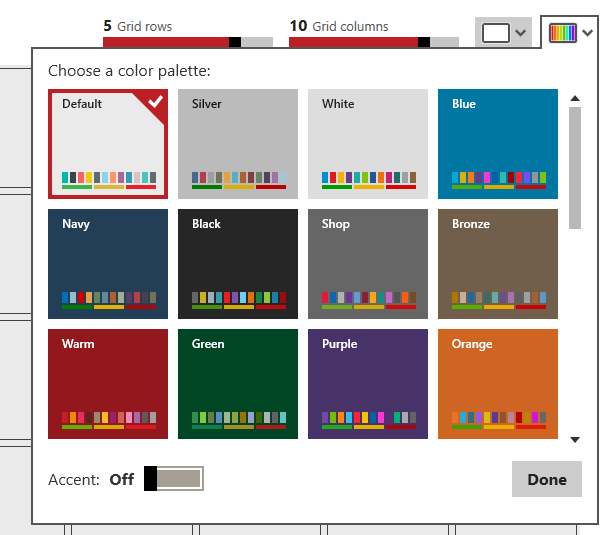
We can also choose the color palette as well from the different color palette provided.
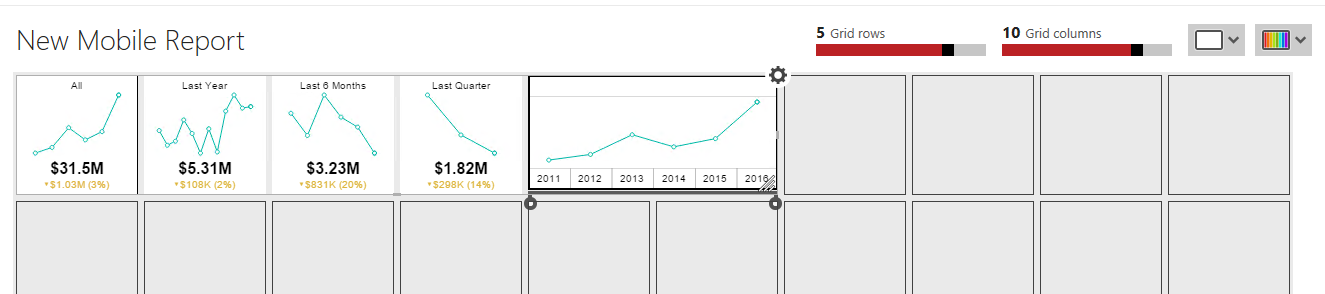
Grid Rows and Columns: We can choose the no of grid rows and columns for our report. The default value is five grid rows and ten grid columns. We can easily change these values just by click on the line bar.
Design mobile report
Suppose we want to build the mobile report with the below components
- Time Navigator
- Gauges
- Charts
- Data grids
For my report, I have used the sample data provided along with the mobile report publisher tool. Now, I will go through each item and see how we can configure those.
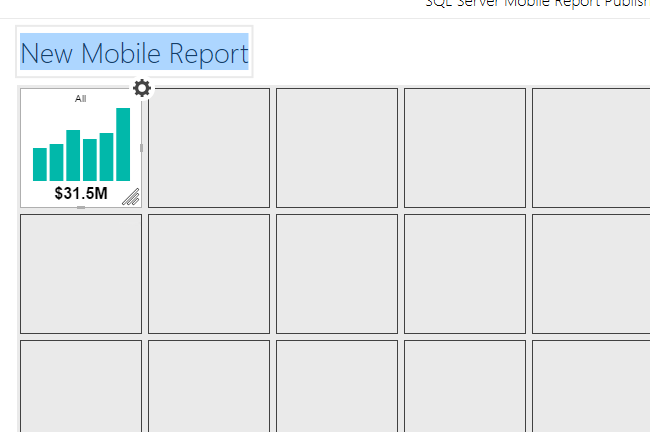
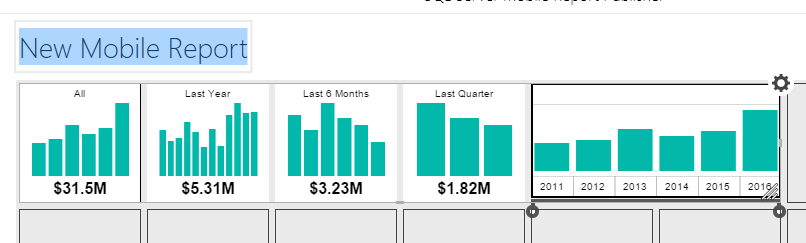
Time navigator
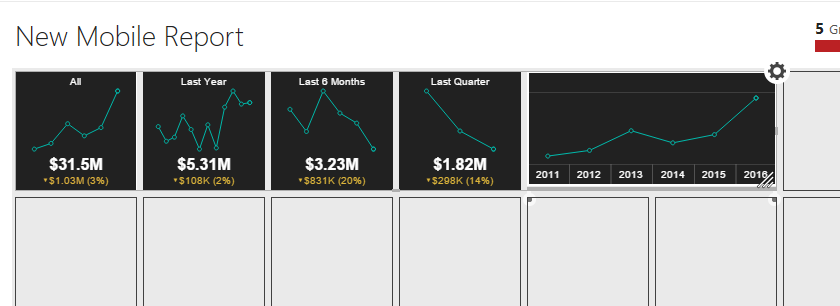
It provides an option to see the data based on different time intervals. To add this drag this into one of the columns and it will look like as

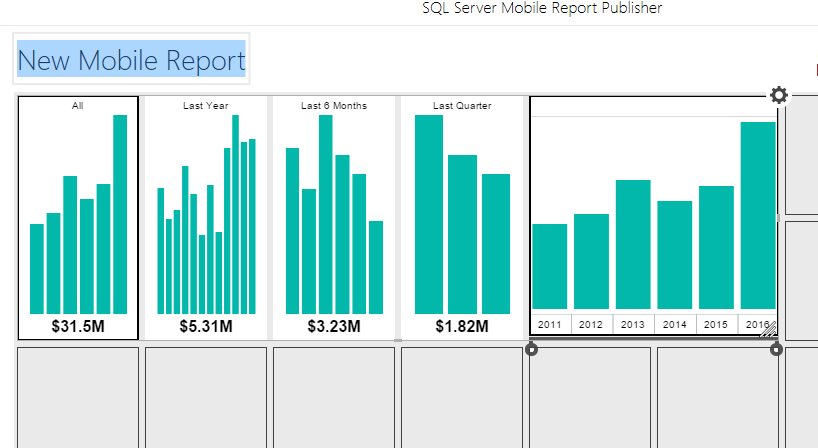
Now to expand the time intervals i.e. last year, last quarter keeps dragging it towards right.
If we want to change the size of the graph, just drag this to multiple rows.
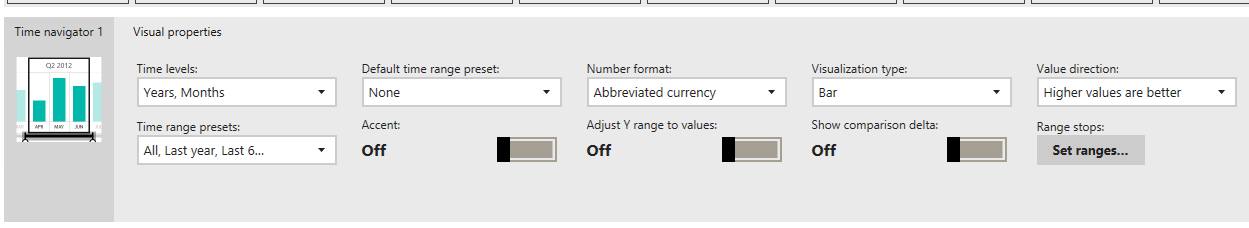
It provides further customization option for the time navigator
Time intervals: it gives options to define time intervals to years, months, weeks, days, hours.
Number format: We can select from the various number format provided.
Visualization type: We can select graph type as bar, line, area, and step area.
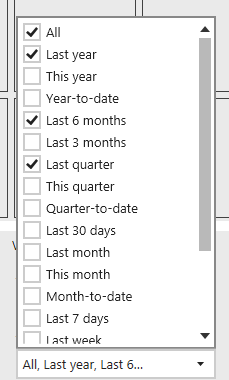
Time range pre-sets: here we can define what should be the time range. There are a couple of options provided here.
Show comparison delta: this provides further details into the graph by including comparison delta details.
Accent: By default, the accent is off. If we enable it, the background of the graph appears as shown below.
Suppose we want line visualization with Delta show comparison on so that time navigator will look like
-
Gauges
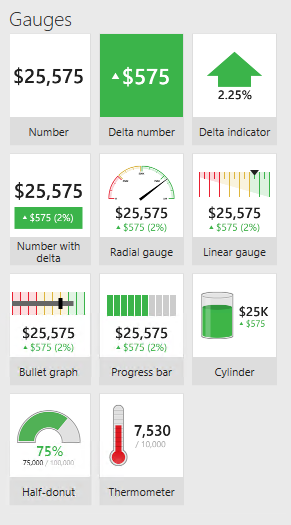
SSRS Mobile reports provide many gauges to select as shown below
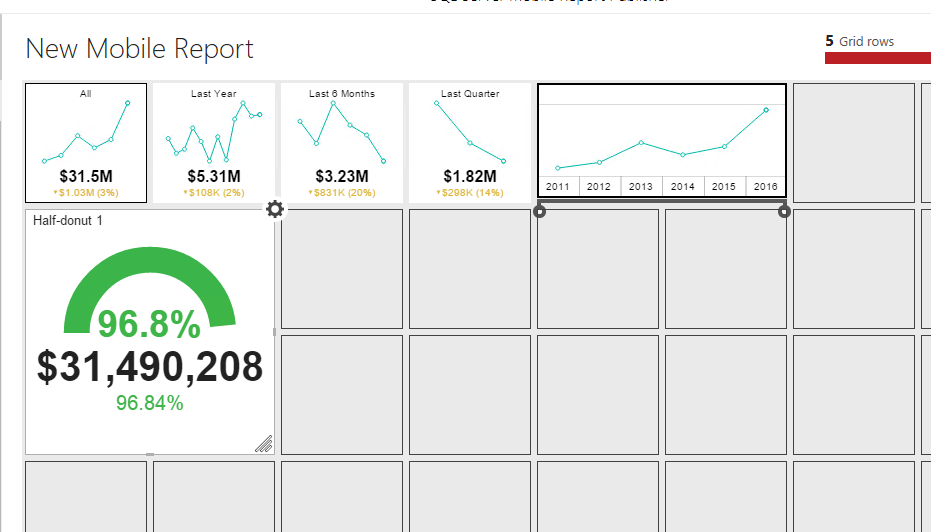
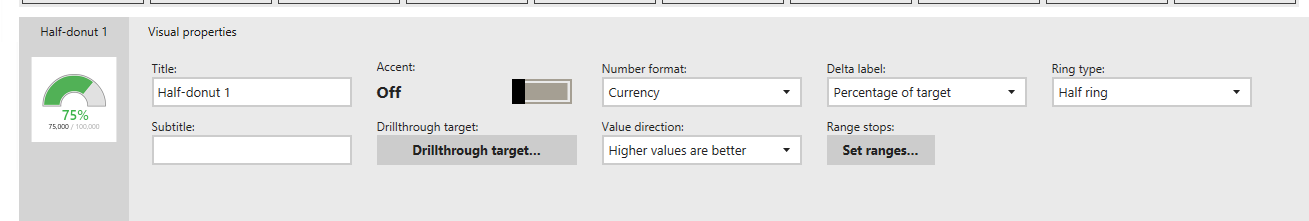
Now we want to add gauges to the report. For this report, I have used half–donut. Similar to time navigator we can adjust it to multiple columns and rows.
It is also having configuration option available similar to the previous one. Few important configurations are below.
Title: By default, it displays as half donut 1. I change it to “Gauges”
Ring type: it is showing half ring as of now. If we want to have a full ring, change this property to the full ring.
-
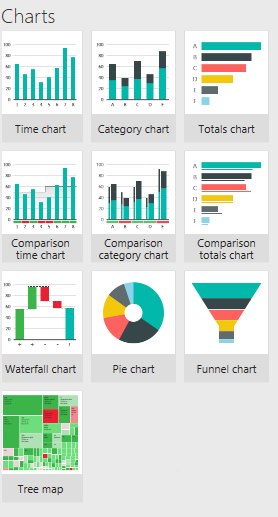
Charts
We have a couple of chart options to choose as shown below.
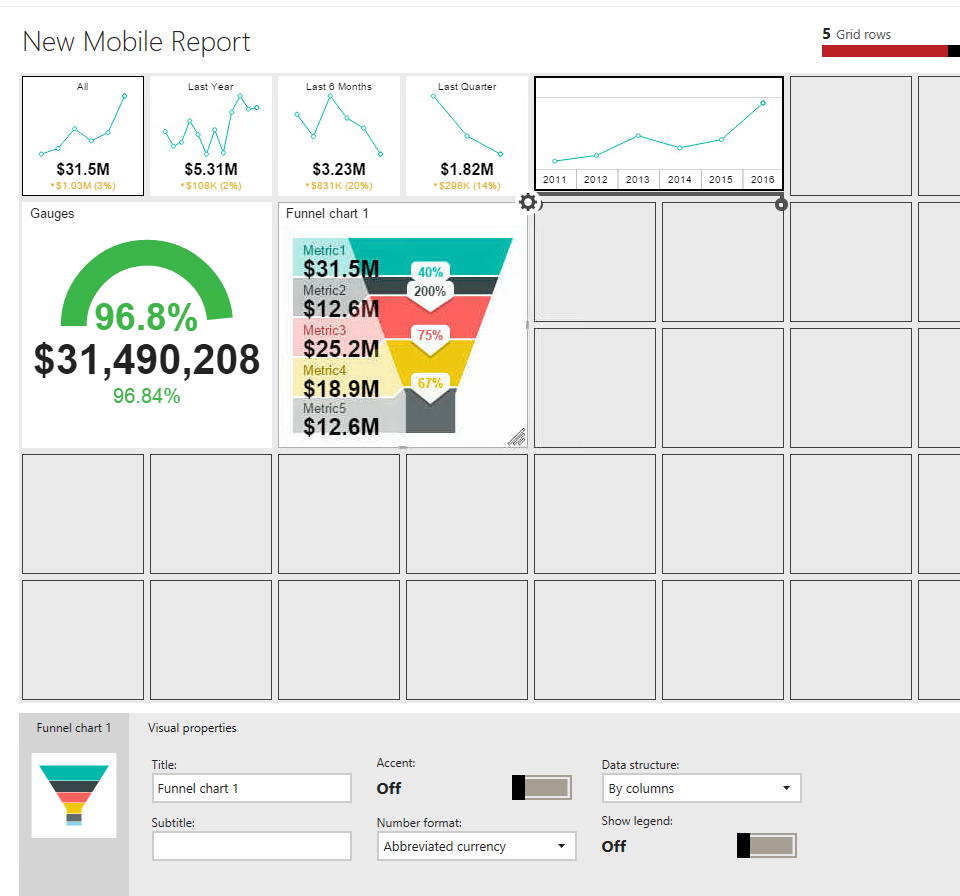
Suppose we want to add funnel chart into our report so drag it to the report and customize it from the options provided.
-
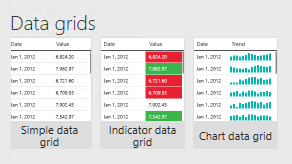
Data grids
We can select the data grid from the options provided and configure it similar to the time navigator.
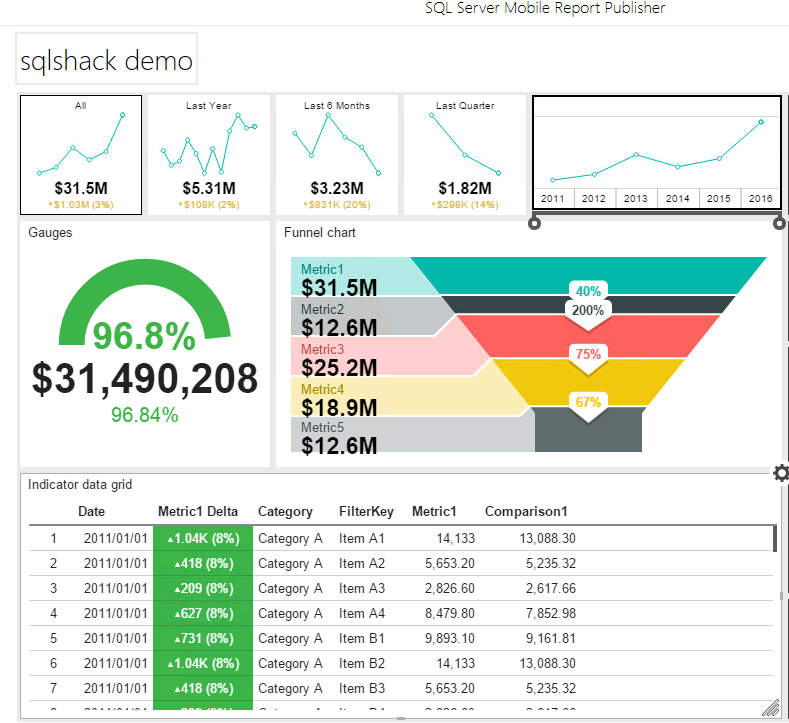
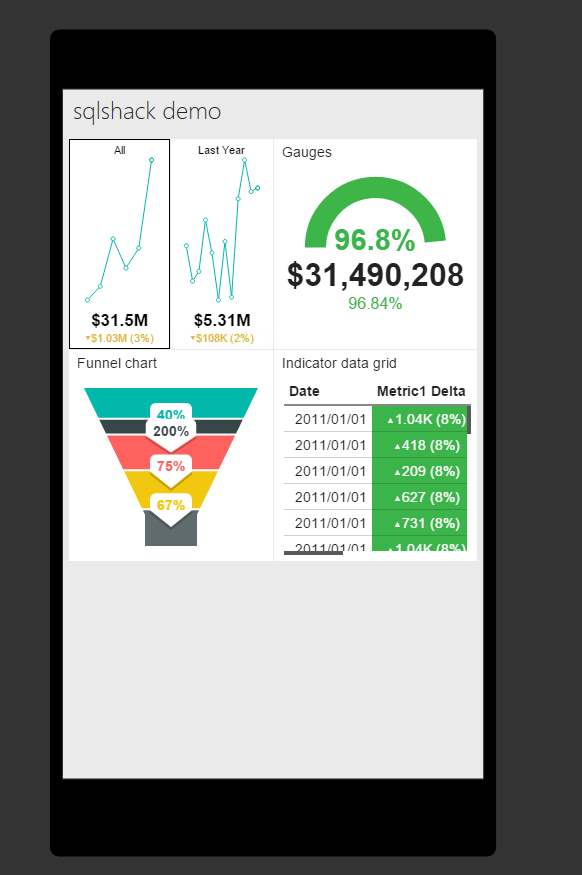
I have renamed the report to “sqlshack demo”, and my final report preview looks as shown below

Converting report from master to tablet
Now to convert the master report to tablet layout click on a tablet from the drop-down. The report layout is now as shown below
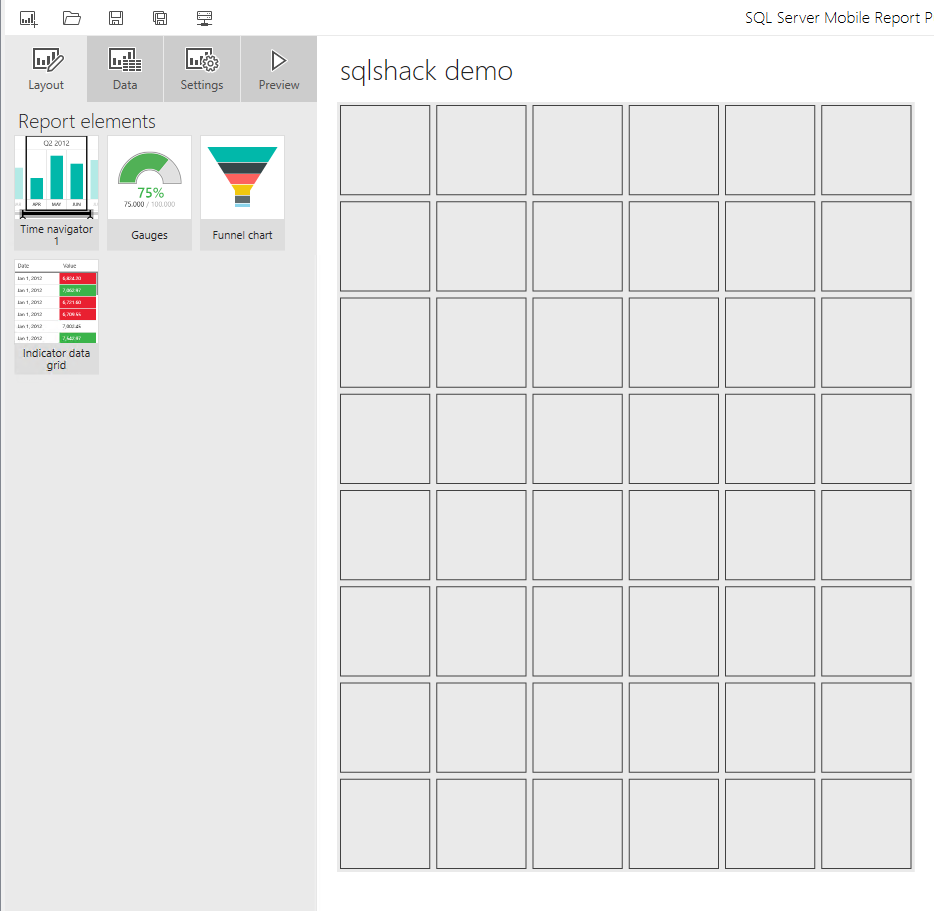
A report element shows the elements like a graph, gauge, data, chart we used in the master report.
Now drag and drop the elements into the tablet layout like below
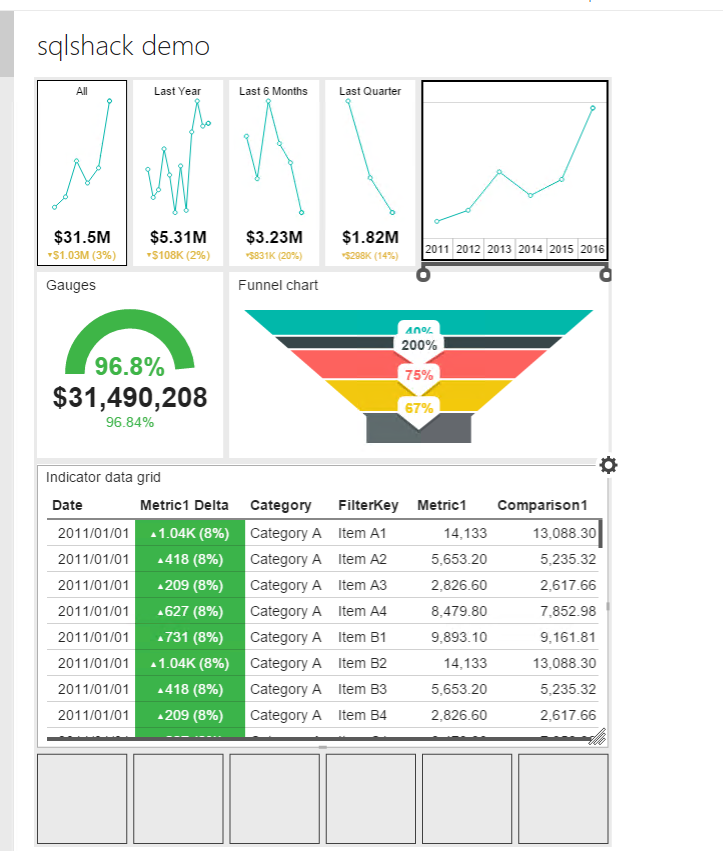
Click on the preview to see the final report and you can see the report in a tab format.
Converting report to mobile
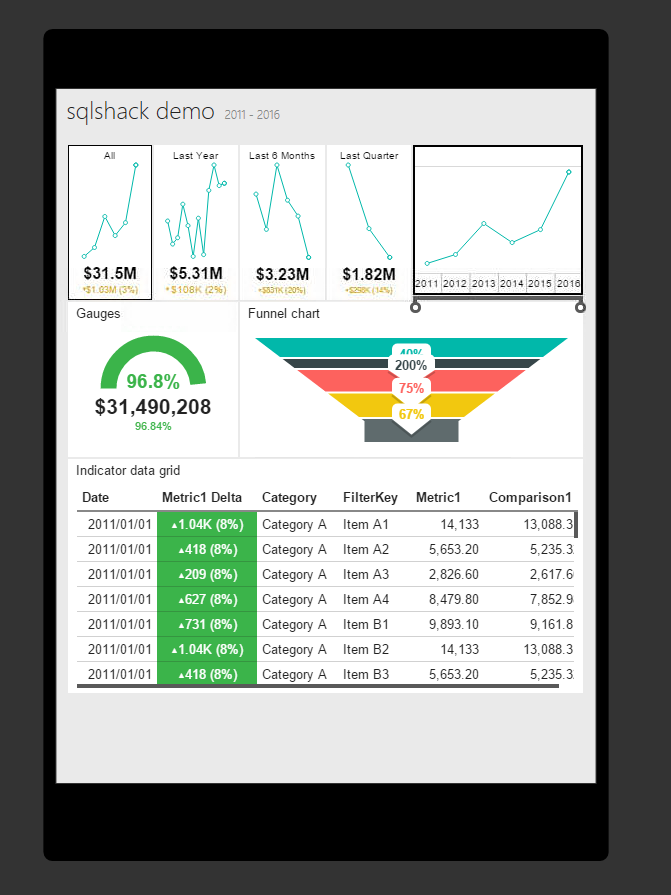
We can convert the report to mobile layout as similar to the previous one, just change the layout mode to the phone, drag-drop the report elements and preview the report.
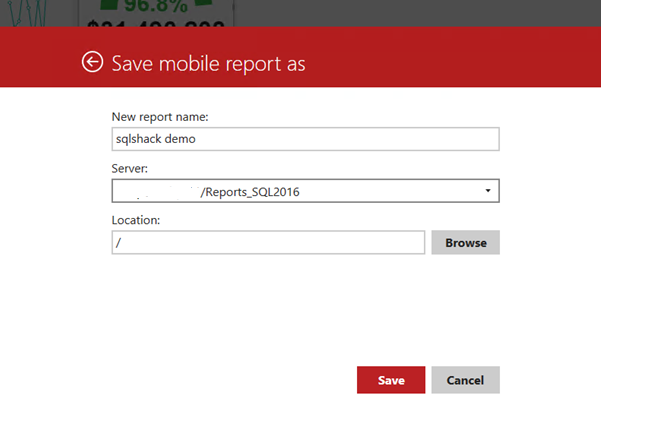
Once we have created the report, click on save mobile report. We can save the report to the file system or the server. If we select the server, we can choose the report name, server name, and location where we want to publish it.
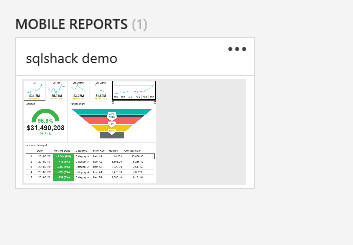
Once deployed we can see the report showing as a thumbnail. The report is now accessible on the mobile, tablets format.
Conclusion
Mobile Reports are an exciting feature in the SQL Server Reporting Services. It is easy to develop reports using the mobile report publisher tool. Explore these reports in your environment and take advantage of the rich functionality.
Useful links
- Create mobile reports with SQL Server Mobile Report Publisher
- Introducing mobile reports
- Bring business insights to more people with SQL Server 2016 mobile reports

I am the author of the book "DP-300 Administering Relational Database on Microsoft Azure". I published more than 650 technical articles on MSSQLTips, SQLShack, Quest, CodingSight, and SeveralNines.
I am the creator of one of the biggest free online collections of articles on a single topic, with his 50-part series on SQL Server Always On Availability Groups.
Based on my contribution to the SQL Server community, I have been recognized as the prestigious Best Author of the Year continuously in 2019, 2020, and 2021 (2nd Rank) at SQLShack and the MSSQLTIPS champions award in 2020.
Personal Blog: https://www.dbblogger.com
I am always interested in new challenges so if you need consulting help, reach me at rajendra.gupta16@gmail.com
View all posts by Rajendra Gupta
- Understanding PostgreSQL SUBSTRING function - September 21, 2024
- How to install PostgreSQL on Ubuntu - July 13, 2023
- How to use the CROSSTAB function in PostgreSQL - February 17, 2023