

Introduction
We will be discussing one of the most common prediction technique that is Regression in Azure Machine Learning in this article. After discussing the basic cleaning techniques, feature selection techniques and principal component analysis in previous articles, now we will be looking at a data regression technique in azure machine learning in this article.
Different Types of Regression Techniques
The regression technique is used to forecast by estimating values. There are different regression techniques available in Azure machine learning that supports various data reduction techniques as shown in the following screen.
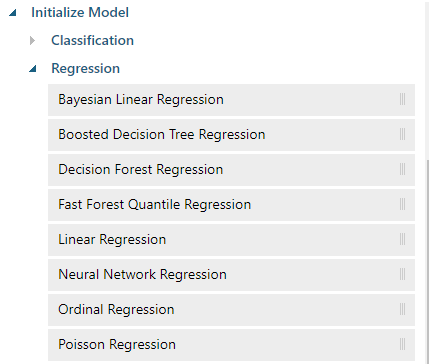
Let us look at what are the key feature of these techniques of regression in Azure Machine Learning.
|
Regression Technique |
Features |
|
Bayesian Linear Regression |
A linear model for small datasets |
|
Boosted Decision Tree Regression |
Large memory is required. Fast training time and accurate results. |
|
Decision Forest Regression |
Fast training and accurate results. |
|
Fast Forest Quantile Regression |
Predict a distribution. |
|
Linear Regression |
Linear model and fast training. |
|
Neural Network Regression |
Long training time and accurate results. |
|
Ordinal Regression |
Data set in rank-ordered categories |
|
Poisson Regression |
Predict event counts. |
Let us look at the usage of different techniques of regression in azure machine learning in detail.
Linear Regression
One of the most very common techniques in regression is Linear Regression. The linear regression is a linear approach to modelling the relationship between a dependent variable and one or more independent variables. For example, if you want to predict the house prices (dependent variable) by using independent variables of house location, house size, the relationship will be linear.
In the AdventureWorks example, let us say we want to predict the yearly income of customers using other features of customers such as occupation, age, number of children, education, etc.
Let us create an experiment that we have been doing in previous articles as shown in the below screenshot.
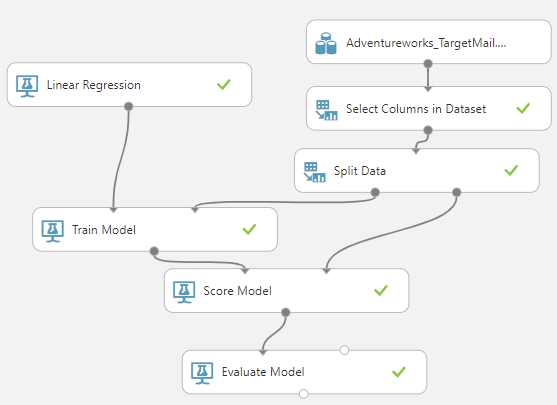
Let us rush through the settings in the above experiment as a recap. We have included the AdventureWorks data set that was uploaded before. Since there are a lot of attributes, we have selected only a few columns that will make an impact to decide the yearly income. Those attributes are Marital Status, Gender, Yearly Income, Total Children, Number of Children At Home, Education, Occupation, House Owner, Number of Cars Owned, Age. After the columns are selected, data is split to train and test. In the Train Model, Yearly Income is selected as the predicted column.
We have used linear regression and the following are the configurations of the Linear Regression.
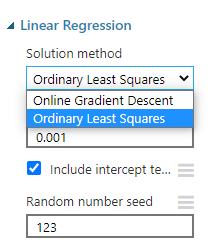
As shown in the above screen, there are two types of methods, Ordinary Least Squares, and Online Gradient Descent methods.
The following are the two parameters for both methods that can be observed from the Train Model control.
|
Ordinary Least Squares |
Online Gradient Descent |
||
|
Age |
6.46262 |
Age |
340.93 |
|
Bias |
19730 |
Bias |
3732.1 |
|
EnglishEducation_Bachelors_0 |
693.804 |
EnglishEducation_Bachelors_0 |
847.45 |
|
EnglishEducation_Graduate Degree_1 |
9802.35 |
EnglishEducation_Graduate Degree_1 |
740.45 |
|
EnglishEducation_High School_2 |
-2328.31 |
EnglishEducation_High School_2 |
-643.9 |
|
EnglishEducation_Partial College_3 |
8022.83 |
EnglishEducation_Partial College_3 |
-80.9 |
|
EnglishEducation_Partial High School_4 |
3539.36 |
EnglishEducation_Partial High School_4 |
-622.5 |
|
EnglishOccupation_Clerical_0 |
-16267 |
EnglishOccupation_Clerical_0 |
-1881 |
|
EnglishOccupation_Management_1 |
38564 |
EnglishOccupation_Management_1 |
2746.6 |
|
EnglishOccupation_Manual_2 |
-29871.3 |
EnglishOccupation_Manual_2 |
-2409 |
|
EnglishOccupation_Professional_3 |
22230 |
EnglishOccupation_Professional_3 |
2245.3 |
|
EnglishOccupation_Skilled Manual_4 |
5074.31 |
EnglishOccupation_Skilled Manual_4 |
-461.4 |
|
Gender_F_0 |
9799.73 |
Gender_F_0 |
159.5 |
|
Gender_M_1 |
9930.31 |
Gender_M_1 |
81.083 |
|
HouseOwnerFlag |
-1892.1 |
HouseOwnerFlag |
303.2 |
|
MaritalStatus_M_0 |
9880.4 |
MaritalStatus_M_0 |
727.64 |
|
MaritalStatus_S_1 |
9849.63 |
MaritalStatus_S_1 |
-487.1 |
|
NumberCarsOwned |
4218.63 |
NumberCarsOwned |
2081 |
|
NumberChildrenAtHome |
6711.04 |
NumberChildrenAtHome |
2105.3 |
|
TotalChildren |
-3314.54 |
TotalChildren |
914.13 |
You will see that model parameters are different depending on the method that you used in the Liner regression control.
Let us see what is the better method for the above set of data by visualizing the evaluation parameters from the evaluation control.
|
Ordinary Least Squares |
Online Gradient Descent |
|
|
Mean Absolute Error |
12,950.26 |
50,614.03 |
|
Root Mean Squared Error |
17,079.20 |
58,763.53 |
|
Relative Absolute Error |
0.51 |
1.99 |
|
Relative Squared Error |
0.28 |
3.35 |
|
Coefficient of Determination |
0.72 |
-2.35 |
By looking at the above comparison, for this dataset, Ordinary Least Squares is better than the Online Gradient Descent as the Ordinary Least Squares has fewer errors and the high coefficient of determination.
Similar to Linear Regression, Bayesian Linear Regression can be used and evaluation is compared as follows.
|
Ordinary Least Squares |
Online Gradient Descent |
Bayesian Linear Regression |
|
|
Mean Absolute Error |
12,950.26 |
50,614.03 |
12,949.71 |
|
Root Mean Squared Error |
17,079.20 |
58,763.53 |
17,079.40 |
|
Relative Absolute Error |
0.51 |
1.99 |
0.51 |
|
Relative Squared Error |
0.28 |
3.35 |
0.28 |
|
Coefficient of Determination |
0.72 |
-2.35 |
0.72 |
Poisson Regression
Poisson regression is used to predict counts. This means Poisson regression prediction will have positive integer numbers. This technique is better suited to predict votes, likes etc.
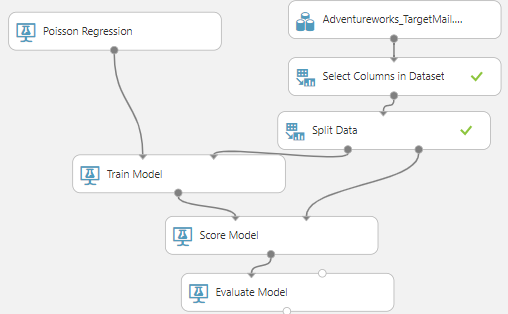
Let us predict Age of the customer using other parameters. As you know, age cannot be negative and with decimal points. To achieve this, we need to make a few modifications to the above experiment, we need to replace the prediction model with the Poisson regression and change the train model variable to the Age.
The following are the evaluation comparison of Poisson Regression with the Linear regression model.
|
Poisson |
Linear |
|
|
Mean Absolute Error |
6.76 |
6.70 |
|
Root Mean Squared Error |
8.83 |
8.75 |
|
Relative Absolute Error |
0.72 |
0.71 |
|
Relative Squared Error |
0.60 |
0.59 |
|
Coefficient of Determination |
0.40 |
0.41 |
You will see from the above table, Poisson regression in Azure machine learning evaluation is similar to the Linear regression. There are parameters available in Poisson regression to enhance the accuracy of the model.
Neural Network Regression
The artificial neural network (ANN) is used in many places in machine learning. In ANN, there are input variables, and there will be a hidden layer from which the output is generated. ANN is mostly used to more complex tasks such as image recognition, character recognition, but it can be used to solve the regression in Azure Machine learning. We will be discussing neural networks in detail in a coming article. In the case of regression, it is just a matter of using the Neural Network regression control and use as a linear regression control.
Boosted Decision Tree and Decision Forest Regression
Decision trees are one of the very common predictive techniques that can be used to classification as well as for regression in Azure Machine Learning. Let us connected the Boosted Decision Tree Regression control in the previously created experiment which was trying to model the prediction of Yearly Income. Let us compare the evaluation parameters of Boosted Decision Tree Regression with the Linear Regression.
|
Linear Regression |
Boosted Decision Tree |
|
|
Mean Absolute Error |
12,950.26 |
5,925.07 |
|
Root Mean Squared Error |
17,079.20 |
8,897.74 |
|
Relative Absolute Error |
0.51 |
0.23 |
|
Relative Squared Error |
0.28 |
0.08 |
|
Coefficient of Determination |
0.72 |
0.92 |
You will see that Decision Forest is much better than the linear regression which is very common even with many datasets. You have the option of looking at the model from the Train Model as shown in the below screenshot.
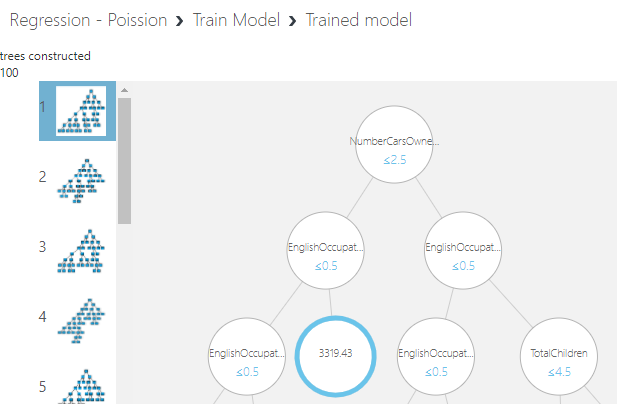
As configured in the tress model 100 trees are built. You can limit the number of trees to attain higher accuracy. According to this tree, the number of cars is the most important parameter to define the yearly income and next is the Occupation and so on.
Similarly, we can perform regression from Decision Forest Regression and the following are the results for the evaluation parameters.
|
Linear Regression |
Boosted Decision Tree |
Decision Forest |
|
|
Mean Absolute Error |
12,950.26 |
5,925.07 |
4143.01 |
|
Root Mean Squared Error |
17,079.20 |
8,897.74 |
8147.90 |
|
Relative Absolute Error |
0.51 |
0.23 |
0.16 |
|
Relative Squared Error |
0.28 |
0.08 |
0.06 |
|
Coefficient of Determination |
0.72 |
0.92 |
0.94 |
From the above table, you can see that Decision Forest is slightly better than the Boosted Decision tree and it is far better than the Linear Regression in Azure Machine Learning.
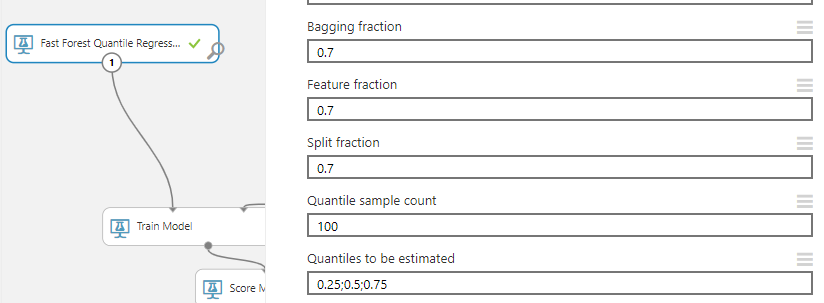
Fast Forest Quantile Regression
When predicting a value, practically we want to predict a range rather than an exact value. Fast Forest Quantile Regression in Azure Machine Learning provides a range of prediction rather than an exact value. This control is the same as the other controls, except you can provide the quantities to be estimated as given in the below screenshot.
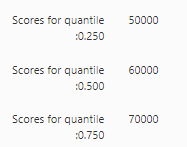
When predicting using the web service that was discussed in the prediction article, it will predict not only the mean but also the other quantities as shown.
Conclusion
In this article, we looked at different algorithms for Regression in Azure Machine Learning. In azure machine learning, there are rich controls to model regression. We identified that decision tree related regression models are much accurate than other algorithms.
Further References
Table of contents

View all posts by Dinesh Asanka
- Testing Type 2 Slowly Changing Dimensions in a Data Warehouse - May 30, 2022
- Incremental Data Extraction for ETL using Database Snapshots - January 10, 2022
- Use Replication to improve the ETL process in SQL Server - November 4, 2021