

Introduction
After discussing cleansing and prediction aspects in Azure Machine Learning, we will dedicate this article to another important feature, which is Feature Selection in Azure Machine Learning.
As we know, in machine learning, our target is to predict using the existing variables. However, there are instances where there are many variables. For example, in the sample dataset that we used in the previous articles, to decide that you are a bike buyer, there can be many variables such as Age, Region, occupation, Profession, Number of Children, Commute distance, number of cars, yearly income, gender, marital status, etc. Out of these variables, what are the important variables? By answering this question, you will find that what the important variable that you want to. This technique will allow you to evade collecting unnecessary or unimportant variables. Selecting the relevant variables is called Feature Selection.
Solution for Over-Fitting
When there are too many variables, your model will have high accuracy on your train data set. However, when it comes to prediction, it will tend to produce invalid results. Typically over-fitting can be avoided by reducing the model to only important variables. So, feature selection in Azure Machine Learning can be used as a solution for over-fitting.
Azure Machine Learning supports three types of feature selection, as shown in the following screenshot.
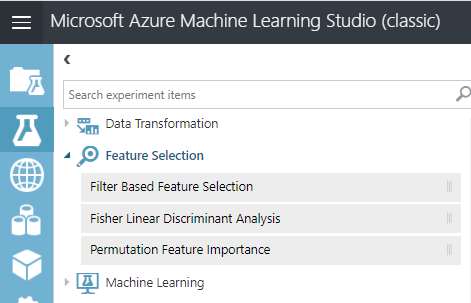
As shown in the above screenshot, Filter Based Feature Selection, Fisher Linear Discriminant Analysis, and Permutation Feature Importance are available Feature Selection Techniques in Azure Machine Learning. We will be discussing the Fisher Linear Discriminant Analysis in a separate article.
Creating Experiments for Feature Selection in Azure Machine Learning
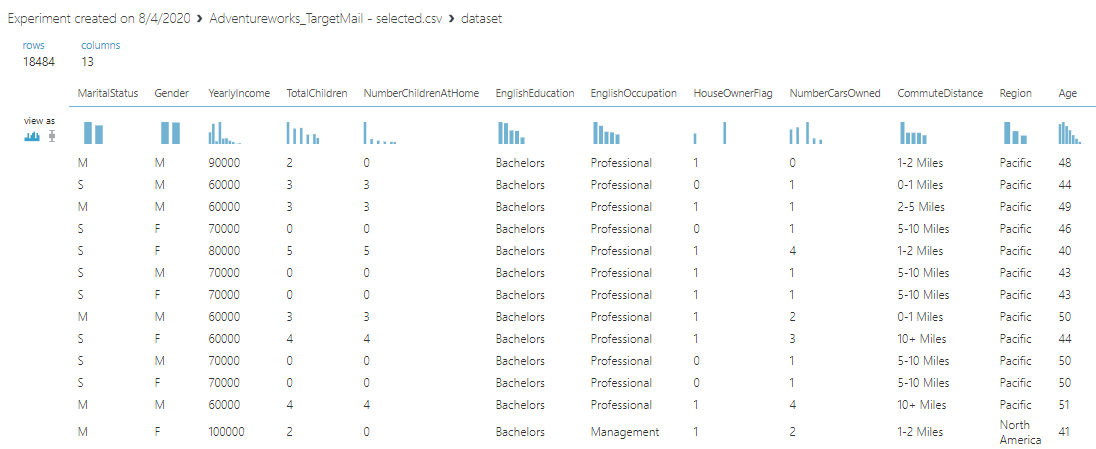
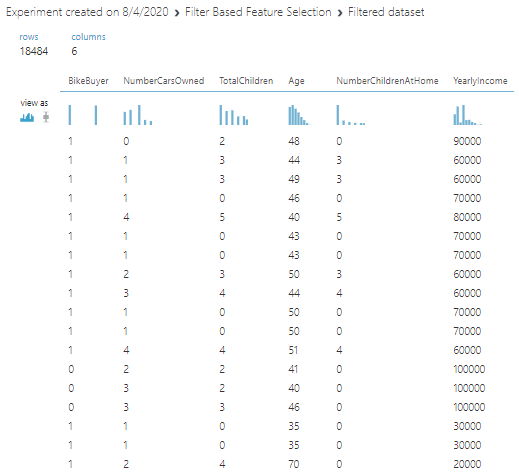
Let us see how we can use feature selection and let us create an experiment with the AdventureWorks dataset, which we have been using before. The following screenshot shows the dataset for the Adventureworks sample data set.
Filter Based Feature Selection
Let us look at a simple but the most commonly used feature selection method, which is filter-based feature selection. In the feature selection method, you have the option of filtering only the important variables to the machine learning models.
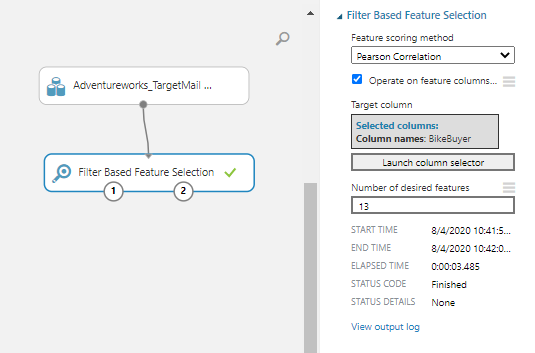
Let us drag and drop the Filter Based Feature Selection control to the Azure Machine Learning Experiment canvas and connect the data flow from the data set, as shown in the below screenshot.
There are different feature scoring methods, such as Pearson Correlation, Mutual Information, Kendall Correlation, Spearman Correlation, Chi-Squared, Fisher Scored, and Count Based. Depending on the data set, you need to choose a better scoring method.
Since we are looking at the Bike Buyer variable as the target variable, we need to set the Bike Buyer Target column option in the Feature-Based Filter Selection control.
Since we have thirteen variables in the selected dataset, let us include thirteen variables and see the output.
After the experiment was executed, verify statistics from the right-hand side second point. That is also named as features.
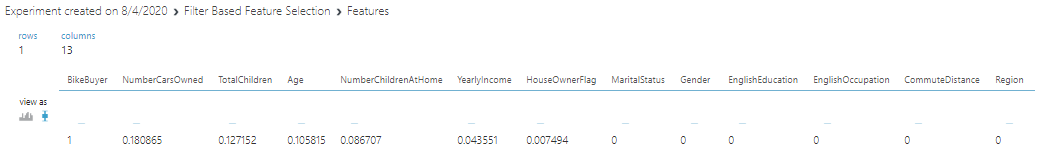
This will include the score for each feature. A higher score indicates that it is a more important variable. For example, according to the Pearson correlation, the Number of Cars Owned, Total Children, are the most important variables.
The following is the Pearson Correlation score for each variable.
Variable | Pearson Correlation Score |
BikeBuyer | 1 |
NumberCarsOwned | 0.180865 |
TotalChildren | 0.127152 |
Age | 0.105815 |
NumberChildrenAtHome | 0.086707 |
YearlyIncome | 0.043551 |
HouseOwnerFlag | 0.007494 |
MaritalStatus | 0 |
Gender | 0 |
EnglishEducation | 0 |
EnglishOccupation | 0 |
CommuteDistance | 0 |
Region | 0 |
Let us look at this from a graph.
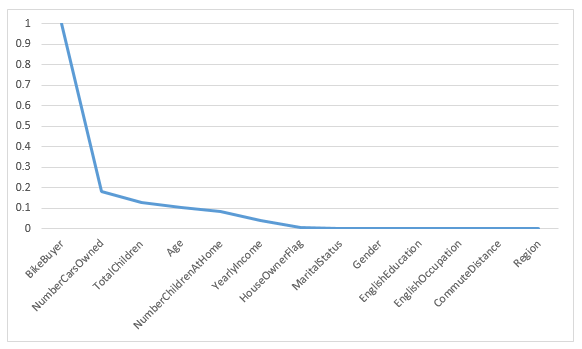
By looking at the above graph BikeBuyer, NumberCarsOwned, TotalChildren, Age, NumberChildrenatHome, YearlyIncode are the prominent variables to decide the bike buyer. This means we have five important variables to select the BikeBuyer. Then let us change the Number of desired features to 5 and re-run the experiment.
Now in the first node, you will see only five variables and Bike Buyer variable, as shown in the below screenshot.
Now you will be using these variables for the model building and evaluation rather than using all the thirteen variables.
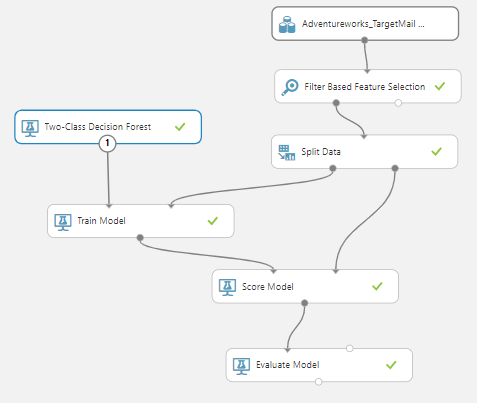
Next, we will create a prediction model, as we did in the last article, which is shown in the below screenshot.
Let us compare the accuracy and other evaluation matrices with the feature selection and without feature selection.
With Feature Selection | Without Feature Selection | |
Accuracy | 0.725 | 0.801 |
Precision | 0.727 | 0.796 |
Recall | 0.712 | 0.802 |
F1 Score | 0.720 | 0.799 |
You will observe that with the feature selection, accuracy, and the other relevant parameters have been reduced when compared to without feature selection. This is obvious, but we should select parameters and score techniques to choose the optimum accuracy.
Let us compare the Feature Selection in Azure Machine Learning with the different feature selection “Scoring Technique”.
Scoring Technique | Number of Variables | Variables | Accuracy | Precision | Recall | F1 Score |
No Feature Selection | 13 | All | 0.801 | 0.796 | 0.796 | 0.799 |
Pearson Correlation | 5 | NumberCarsOwned TotalChildren Age NumberChildrenatHome YearlyIncode | 0.725 | 0.727 | 0.712 | 0.720 |
Mutual Information | 7 | NumberCarsOwned Age TotalChildren CommuteDistance EnglishEducation NumberChildrenAtHome Region | 0.762 | 0.753 | 0.770 | 0.762 |
Kendall Correlation | 5 | NumberCarsOwned TotalChildren Age NumberChildrenAtHome YearlyIncome | 0.725 | 0.727 | 0. 712 | 0.720 |
Spearman Correlation | 5 | NumberCarsOwned TotalChildren Age NumberChildrenAtHome YearlyIncome | 0.725 | 0.727 | 0. 712 | 0.720 |
Chi Squared | 8 | NumberCarsOwned Age TotalChildren CommuteDistance EnglishEducation NumberChildrenAtHome Region YearlyIncome | 0.772 | 0.762 | 0.783 | 0.772 |
Fisher Scored | 6 | NumberCarsOwned TotalChildren Age NumberChildrenAtHome YearlyIncome HouseOwnerFlag | 0.734 | 0.732 | 0.730 | 0.731 |
Count Based | 6 | YearlyIncome TotalChildren NumberChildrenAtHome HouseOwnerFlag NumberCarsOwned Age | 0.734 | 0.732 | 0.730 | 0.731 |
From the above table, it is clear that when you reduce the number of parameters, accuracy, and other relevant evaluation parameters will be reduced. However, we need to select the optimum number of variables using Feature Selection in Azure Machine Learning.
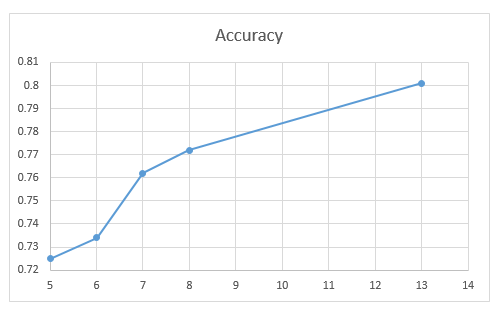
By looking at the above chart, it is clear that seven is the optimum number of variables for the above model. Apart from narrowing the number of variables, Feature selection in Azure Machine Learning will allow us to select the important variables.
Permutation Feature Importance
The next technique of Feature Selection in Azure Machine Learning is Permutation Feature Importance. Permutation Feature Importance is used differently to that of Filter-Based feature selection.
Let us look at how Permutation Feature Importance is used in the following screenshot.
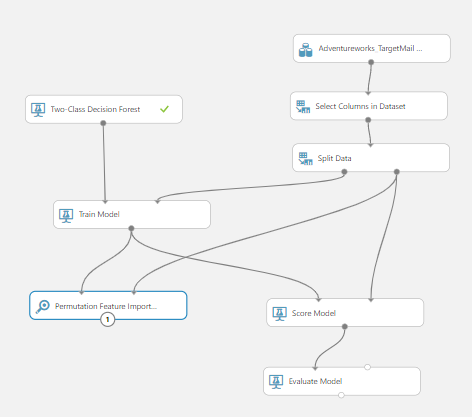
In this model, we have included Select Columns in Dataset control, as Permutation Feature Importance does not filter automatically like filtered feature selection. For the Permutation Feature Importance control, there should be input from the Train Model and another input from the Split Data, as shown in the above screenshot.
In the permutation Feature Importance control, there are two configurations. One of them is the random seed that will define the randomness of the control. For the evaluation, there are few options for classification and regression. For the Classification, Accuracy, Precision, Recall, and Average Log loss and for the Regression technique, Mean Absolute error, Root means squared error, Relative Absolute error Relative squared error, and coefficient of determination.
Let us view the results from the permutation Feature Importance control that is shown in the below screenshot:
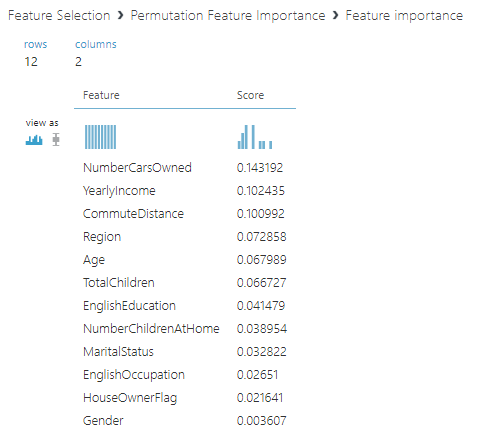
From the above list, you can identify the important variables that you need to choose from. As said, you need to use select column option control to choose the variables that you need.
Conclusion
We discussed the techniques for Feature Selection in the Azure machine learning platform from which we can find the important variables to define the machine learning model. Further, feature selection can be used to overcome the over-fitting issue. In this article, we discussed two techniques of Feature Selection in Azure Machine Learning, which are Filter Based and permutation Feature Importance.
In the Filter-Based, we can directly provide the number of columns that have to be selected after inspecting different score values. There are several ways for determining the score, of which you need to select the most optimum scoring technique.
In permutation Feature Importance, you need to use the Select Column control to filter the needed columns.
In my next article, I will be discussing the Principal Component Analysis in detail.
Table of contents

View all posts by Dinesh Asanka
- Testing Type 2 Slowly Changing Dimensions in a Data Warehouse - May 30, 2022
- Incremental Data Extraction for ETL using Database Snapshots - January 10, 2022
- Use Replication to improve the ETL process in SQL Server - November 4, 2021