

In this article, we will be discussing Microsoft Sequence Clustering in SQL Server. This is the ninth article of our SQL Server Data mining techniques series. Naïve Bayes, Decision Trees, Time Series, Association Rules, Clustering, Linear Regression, Neural Network are the other techniques that we discussed until this article.
What is Sequence Clustering
The Microsoft Sequence Clustering algorithm is a combination of sequence analysis and clustering. This technique identifies natural groups (clusters) of similarly ordered events in a sequence.
In Sequence Clustering, we will be looking at the events which have occurred in sequence. Then the clustering is applied to that data set. The clusters can be used to predict the likely ordering of events in a sequence based on known characteristics.
In this technique, the Hidden Markov model will be used to generate the sequences while K-Means and Expectation-Maximization (EM) clustering techniques will be used for clustering. Since we have discussed clustering techniques in the Clustering article, let us discuss the Hidden Markov Process in short.
Hidden Markov Process
If you wondering how Google ranks its pages, it is by using an algorithm called a PageRank. Page rank uses Markov Process. This technique was introduced by the mathematician named, Andrey Markov (1856 – 1922) in 1906. In Hidden Markov Process, we are looking at exploring the sequence of events.
Implementation
Let us see how we can implement, Microsoft Sequence Clustering in SQL Server. Like we did for all the other techniques, we need to create a SSAS project in this technique too. Similar to other projects, we need to create a data source to the AdventureWorksDW database.
In this technique, we have to use two views for the data source views similar to what we did in the Association Rule technique. Those two views are vAssocSeqOrders and vAssocSeqLineItems added to the data source views as shown below.
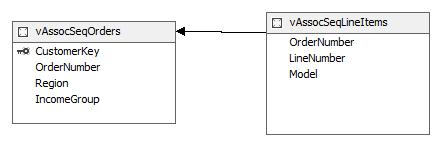
By default, there won’t be any relationships between these two views since there are no relationships built at the database level. Therefore, that relationship has to be built as shown in the above screenshot.
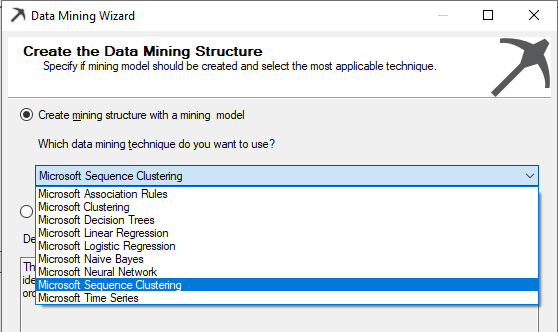
Next is to select the technique for the mining model. As shown in the below screenshot, we will be selecting the Microsoft Sequence Clustering from the available list.
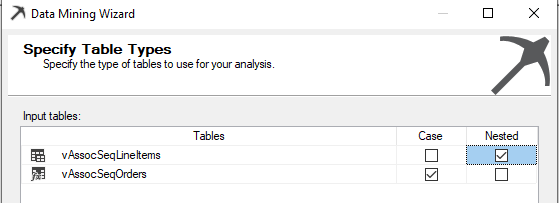
After choosing the database source view, next is to choose the Case and Nested tables. Unlike most of the other techniques, there are two tables in this technique.
In this vAssocSeqOrders should be selected as the Case table where the vAssocSeqLineItems should be selected as the Nested as shown in the below screenshot.
Let us see what our objectives in this sample data are. If you recall what we did for the association rule, is that we are looking at what are the similar items selling together. In that example, we looked at only Order Number and the Model as inputs.
In the case of sequence clustering, we are looking at the sequences. Therefore, we will include the Line Number as the sequence parameter. Though this may not be a correct business case, however from the existing sample data, this is the only dataset that has a sequence attribute.
Therefore, we have selected Key, Input and Predict as shown in the following screenshot.
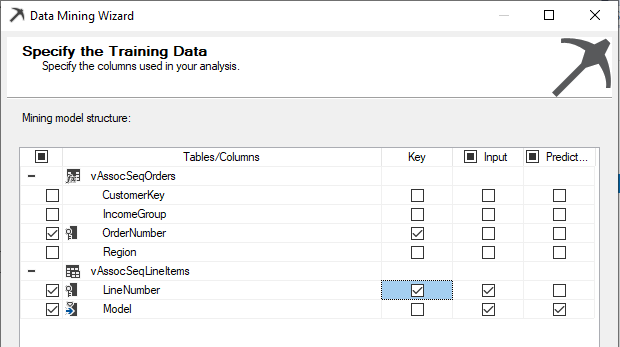
Ideally, we can choose CustomerKey as the key, but in this example, we do not have adequate data for the above case.
In the next couple of screens, default values are accepted.
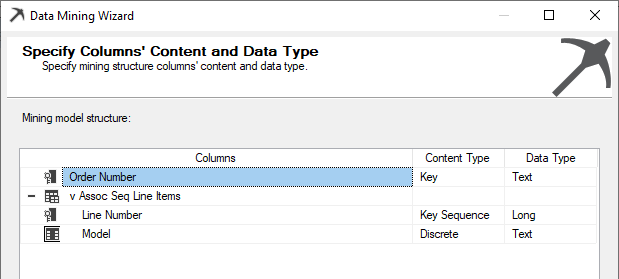
From the algorithm, it is identified that the Line Number is the Key Sequence as shown in the above screenshot.
After the project is created, then the mining model has to be processed. After the model is processed successfully, the next is to view the results.
Mining Model Viewer
In the Microsoft Sequence Clustering, there is an additional view called State Transition than to the Microsoft Clustering Model viewers. Let us look at each viewer.
Cluster Diagram
Since we have not limited the number of clusters, 15 clusters were defined. Clusters are named with default values that can be modified by looking at the cluster properties.
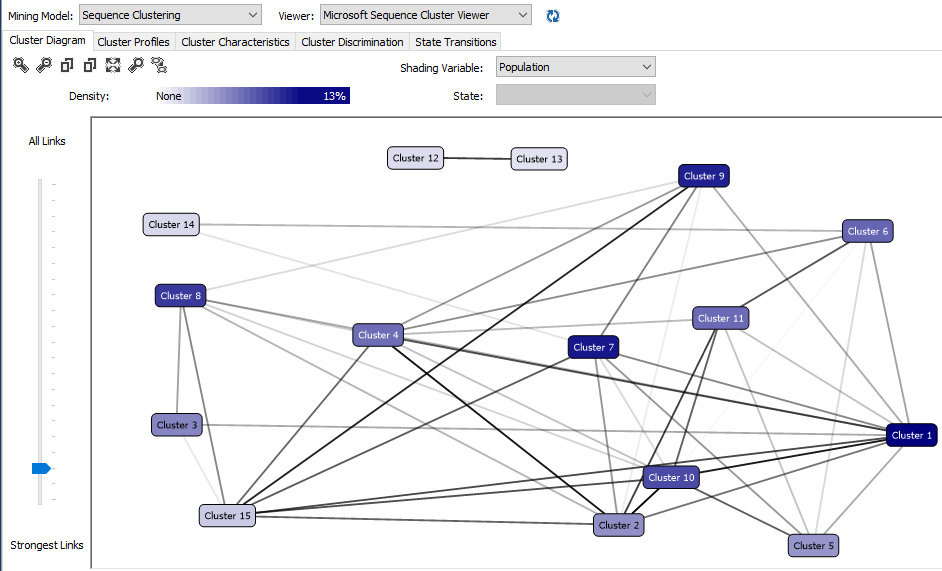
After renaming the clustering to more understandable names, the cluster diagram is visualized like follows.
Cluster Profiles
In the cluster profile view, you can view all the cluster state and the transition in one view as shown below.
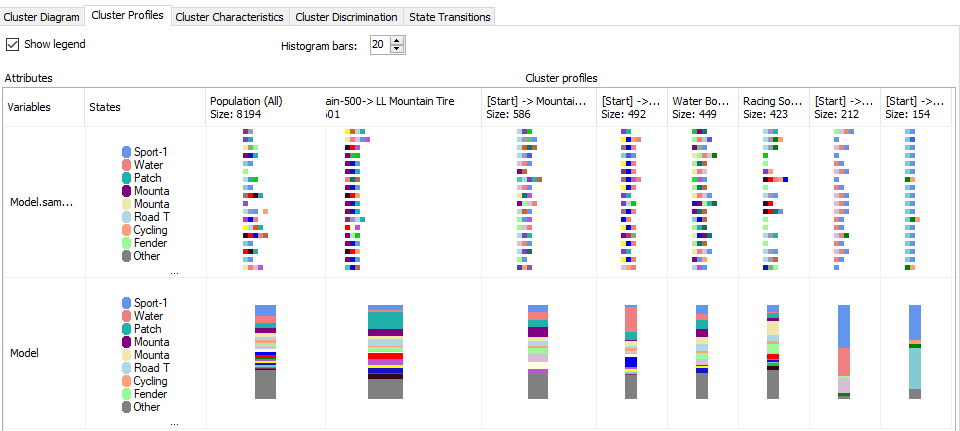
Since we have renamed the cluster names, those names are reflected in this view as well as in other views.
Cluster Characteristics
Cluster profiles view gives you a whole view of the clusters whereas the cluster characteristics view gives you details about each cluster. In the Cluster Characteristics view, you can view the details of the entire population as well as the selected cluster.
The following screenshot shows the cluster characteristics for a selected cluster.
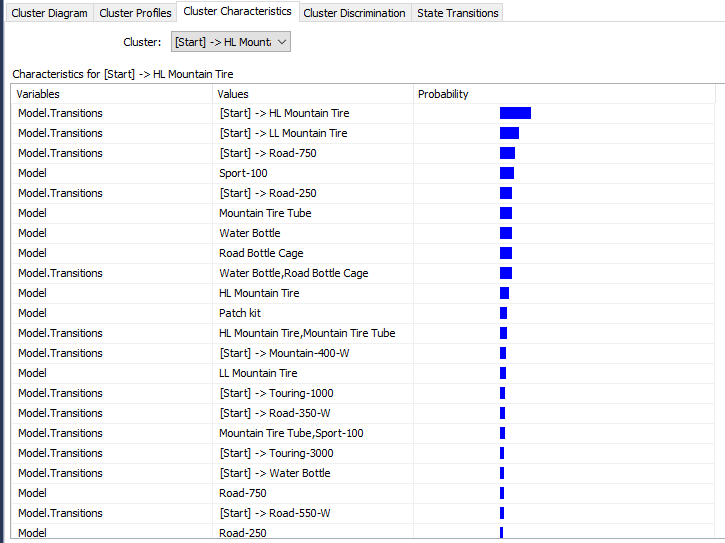
In this cluster, HL Mountain Tire, LL Mountain Tire and Road-750 model are at the start of the sequence. Further, this cluster has a Sport-100 model predominantly.
Cluster Discrimination
As always we need to compare between clusters to find out what are differences between the clusters. In the Cluster Discrimination, you can either view differences between two clusters or you can verify the differences between a cluster to all the other rest of the data.
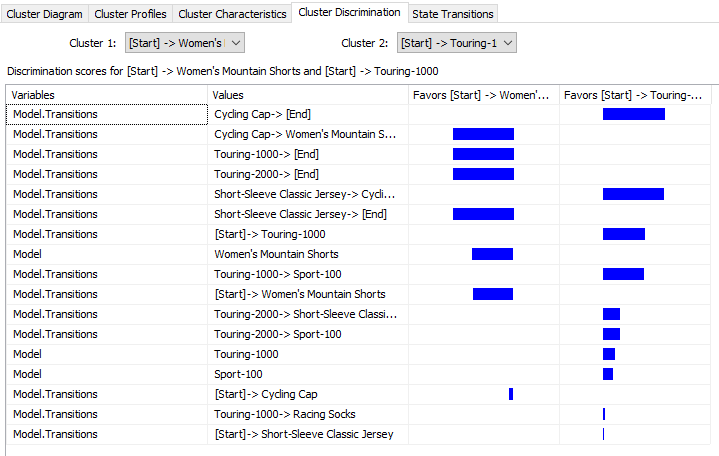
The above screenshot shows that in the first cluster more favors towards the Cycling Cap -> Women’s Mountains Shorts while the second cluster favors ending the sequence with Cycling Cap.
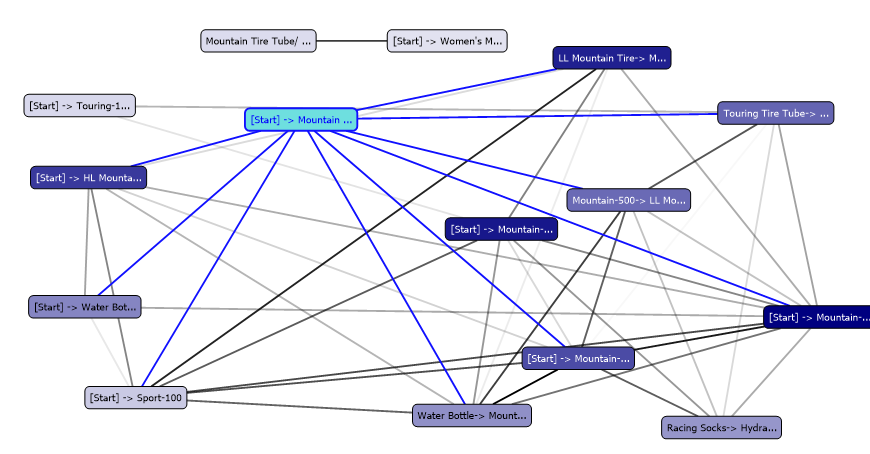
State Transitions
State Transactions view is the only view that is new to the Microsoft Sequence Clustering technique. This view is created by using the Hidden Markov Model.
Let us analyze a few cases of state transactions from different clusters.
In the following state transition diagram, it indicates that the customer buys a water bottle, not as the first choice.
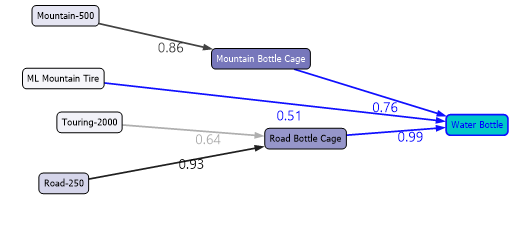
Above screenshot shows that people who buy Road Bottle Cage, there is 0.99 probability of buying a Water Bottle. Similarly, if you are buying Road-250 that there is a probability of 0.93 that buying Road Bottle Cage.
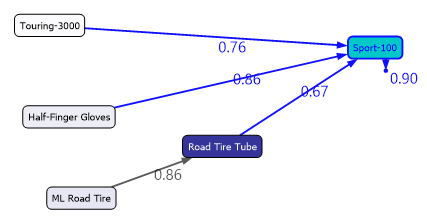
The following screenshot shows another case. In this case, people who are buying Sport-100, there is a chance that they will buy the same item again to a probability of 0.90.
The following screenshot has a few more scenarios.
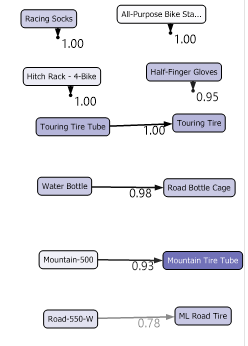
In this cluster, it is evident that customers are buying the same item again. Further, if your client is buying a Touring Tire Tube, there is a 100% probability that he will buy a Touring Tire.
Model Parameters
In Microsoft Sequence Regression there are two important parameters. Those two parameters are CLUSTER_COUNT and MAXIMUM_SEQUENCE_STATES. During the example, we got 15 clusters which are difficult to manage, so we can reduce the cluster count to a manageable number such as 5-8. MAXIMUM_SEQUENCE_STATES define the number of states. The number of states should be around 20-30 maximum. If you are setting this value to a number greater than 100, your model will be meaningless. The default value of this parameter is 64.
Let us set CLUSTER_COUNT to 5 and MAXIMUM_SEQUENCE_STATES to 8 and reprocess the Microsoft Sequence Cluster Model. Following is the Markov Model for the entire population.
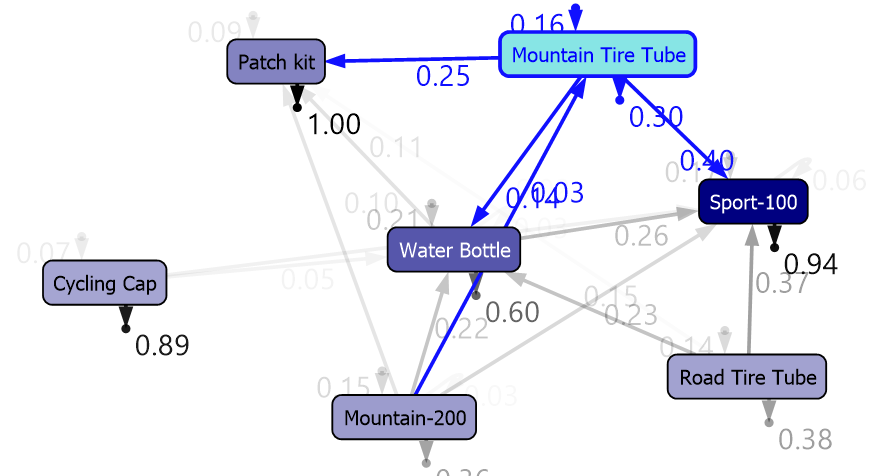
You can see that it is clearer than the previous model.
Logistic Regression
We won’t be doing another article on Microsoft Logistic Regression as it is another variant for Microsoft Neural Network. The only difference is that, in the Logistic Regression, there won’t be any hidden layer as we discussed in the last article.
Conclusion
This is the last algorithm of the Microsoft SQL Server family. Microsoft Sequence Clustering in SQL Server is the combination of sequence and clustering techniques. In this technique, common sequences are clustered.
Table of contents

View all posts by Dinesh Asanka
- Testing Type 2 Slowly Changing Dimensions in a Data Warehouse - May 30, 2022
- Incremental Data Extraction for ETL using Database Snapshots - January 10, 2022
- Use Replication to improve the ETL process in SQL Server - November 4, 2021