
In this article, we will be discussing measuring Accuracy in Data Mining in SQL Server. We have discussed all the Data mining techniques that are available in SQL Server in a series of articles. The discussed techniques were Naïve Bayes, Decision Trees, Time Series, Association Rules, Clustering, Linear Regression, Neural Network, Sequence Clustering. Data mining is a predicting technique using the existing pattern. It is obvious that we won’t be able to predict 100% accurately. However, since we are using data mining outcomes for better business decisions, the result should have better accuracy. If the accuracy is very low, we tend not to use those data mining models. Therefore, it is essential to find out how accurate your data mining models are.
Accuracy in Classification Models
Out of the nine data mining models in SQL Server, three of them can be considered as classification models. The Classification models are Naïve Bayes Decision Trees, Neural Network. Though the logistic regression is a regression technique, that can be used for a classification problem as well. Since you have four models as a solution for the classification problem, we need to look at which algorithm should be selected to use. Obviously, you need to select the most accurate data mining model. To evaluate which algorithm to use, an accuracy test should be done.
Let us create simple four models using Naïve Bayes, Decision Trees, Logistic Regression, and Neural Network algorithms for measuring Accuracy in Data Mining.
Setting up the Data Mining Project
First, as we did during the previous article, we need to create a connection to the database, AdventureWorksDW after creating an SSAS project using SQL Server Data Tools.
Next, we need to create the data source view and we need to add, vTargetMail view to the data source view.
Then, we will be creating a mining model choosing the Decision Tree algorithm and we will add the rest of the three algorithms later.
During the Data Mining project creation, Create a Testing Data Set is an important option for accuracy. This screen was ignored in the previous articles but it plays an important role during the Accuracy Measuring in data mining.
During the model building, we need two data sets. One is to train and the other is to test data set. The Train set will be used to build the model and the test data set will be used to evaluate the built model. This test data set will be used to measure the accuracy and other matrices.
In the following screenshot, allow selecting data volume to the test data set.
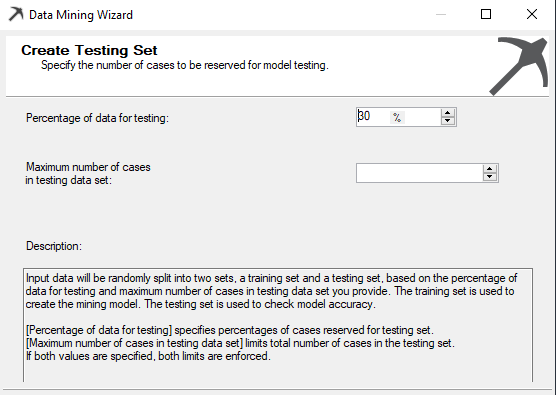
There are two options to create a test data set. The first option is to define the percentage value for the test data set. Apart from the percentage setting, there is an option to set the number of cases for the test data set. If both values are specified in the above screen, both limits are enforced.
Typically, this is set to 30% meaning that 70% of data will be used to build the model while 30% is used to evaluate the model.
After one model is built, the rest of the techniques are added to the data mining model and the final model can be viewed as the following screenshot.
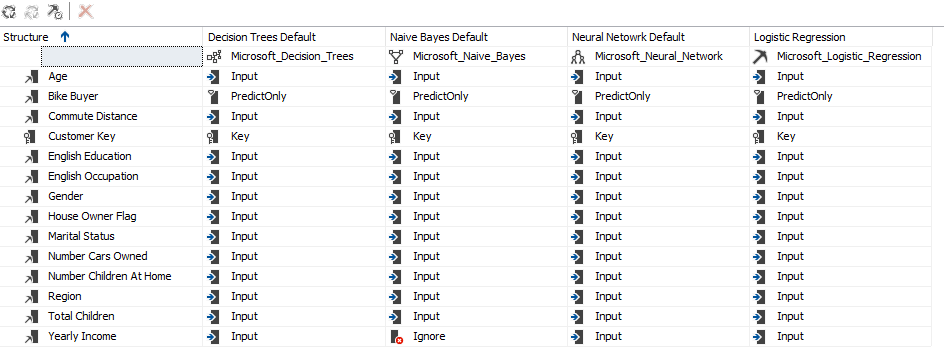
Since Yearly Income is a continuous variable, Microsoft Naïve Bayes has ignored that input variable as Microsoft naïve Bayes can have only discrete inputs. Apart from that ignored variable exception, everything else is the same across all the four algorithms.
Next, we will look at the Mining Accuracy Chart.
Mining Accuracy Chart
In the previous articles, we looked at Mining Structure, Mining Models, Mining Model Viewer and Mining Model Predictions tabs. The only tab we have not discussed so far is the Mining Accuracy Chart tab. With this article, we will discuss the Mining Accuracy Chart tab in detail as accuracy Measuring in Data Mining.
In the Input Selection, you can choose which models to evaluate. Since we used these models to predict Bike Buyer, Predictable Column Name is Bike Buyer and the Predict value is 1.
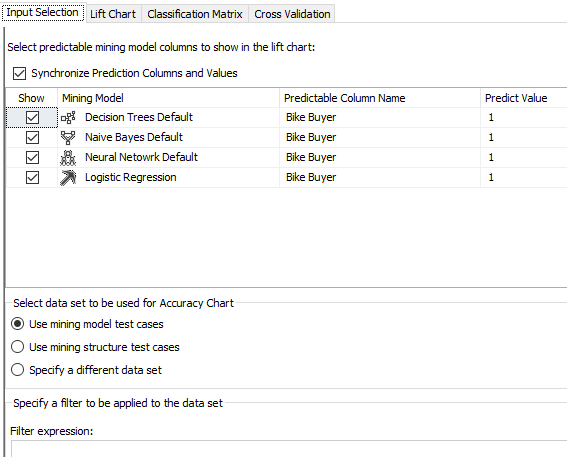
Next is to choose, test data for the Accuracy Chart. The first two options allow selecting the randomly selected test data set. However, you have the option of choosing a different data set for the evaluation purposes by using the Specify a different data set. In this option, you can create a filter expression as well. Let us assume that you need to test the built model for the customers with age over 40 years. You will not be able to do this by using any of the first two options. In the third option, you can select the data set and set the filter so that the evaluation is done only for the filtered data set.
Lift Chart
A life chart will be used to evaluate the effectiveness of different data mining models. Following are the lift charts for different four models, random model, and the ideal model.
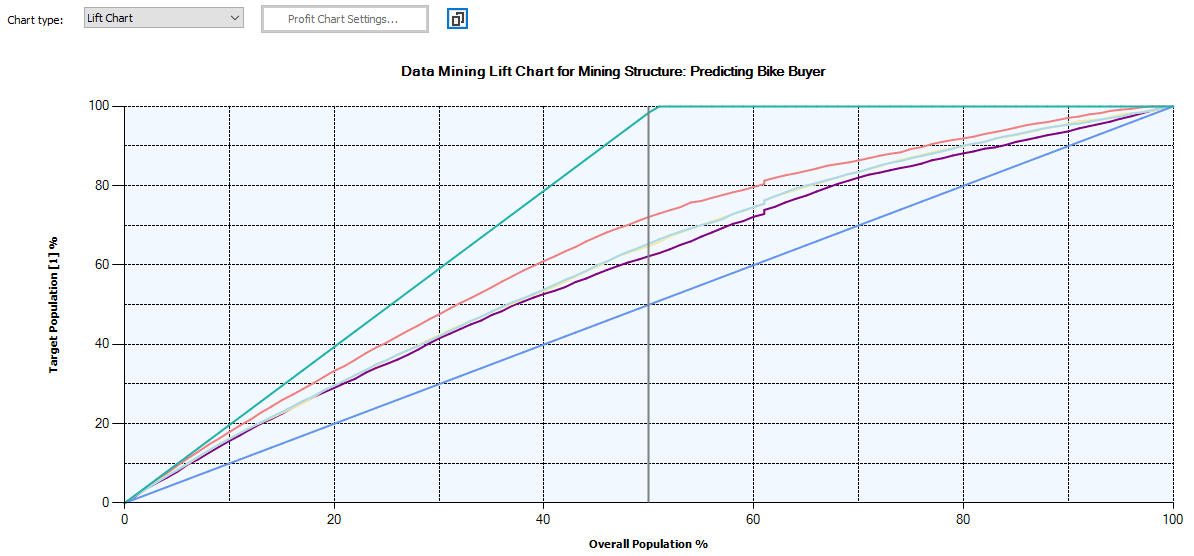
The following screenshot is the legend for the above chart.
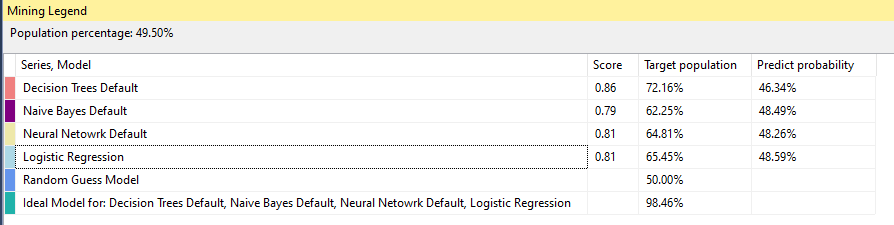
Since Neural Network and Logistic Regression have similar results, it is difficult to distinguish them in the chart.
The random model is 50% as we have two probable, buying a bike or not. If we do not use any data mining models, random is the model that will be automatically selected. Out of the four models, the best model is the model which is close to the Ideal model or the model which is away from the random models. This means that the best model for the above data set is Decision Trees. Logistic Regression, Neural Network and Naïve Bayes models are other models in the order of the effectiveness.
Profit Chart
The Profit chart is somewhat unique in Microsoft tools. We use data mining to maximize profit.
Let us assume, we are looking at a promotion to improve the bike buyers. For a marketing campaign, there are four parameters, population. Fixed Cost, Individual cost and the expected revenue. Those parameters can be entered in the following screen. This is available after the selection of the Profit Chart.
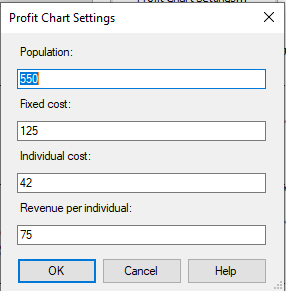
After the above data was entered, the following Profit chart can be observed.
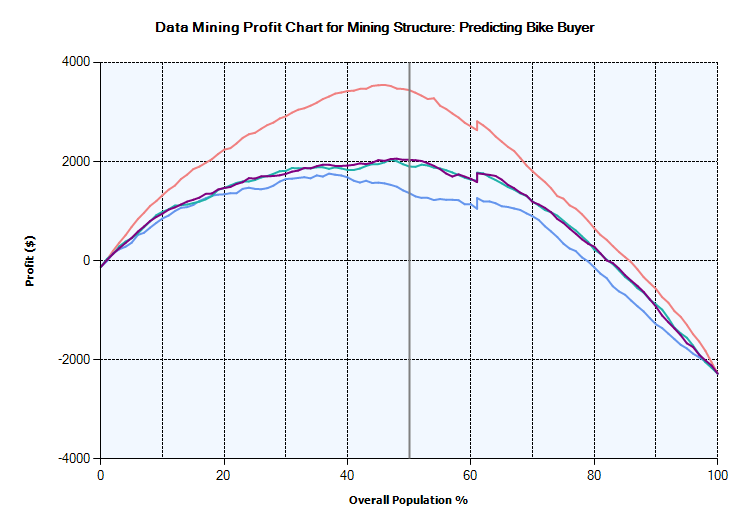
Even the profit chart indicates that the Decision Tree algorithm is better than other techniques. In the decision tree, 45% of the population would make the maximum profit of 3,500 $. This means it is better to target only 45% of possible buyers who have the highest probability of buying. It is important to choose the correct parameters for the profit chart.
Classification Matrix
Most of the time, the Classification Matrix is known as the Confusion Matrix. This is the most common matrix used to evaluate the effectiveness of the data mining models.
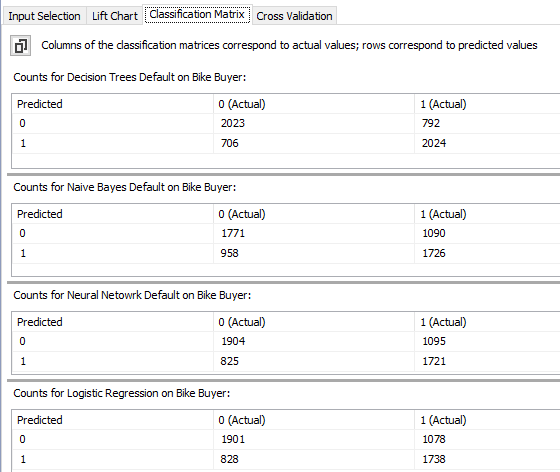
Let us look at the Decision tree classification matrix. In that model, there are 2023 cases where are actually not bike buyers and those are predicted as same. Similarly, there are 2024 actual bike buyers and which are predicted the same. Those are correct predictions. However, there are 706 cases which actually are not bike buyers but the decision tree model predicted them as possible bike buyers. 792 cases are another way around.
However, there are few other parameters that are derived from the above classification matrix. The above values are defined as follows.
|
Predicted |
0 (Actual) |
1 (Actual) |
|
0 |
True Negative (TN) |
False Negative (FN) |
|
1 |
False Positive (FP) |
True Positive (TP) |
The following are the basic measures that can be derived from the classification matrix.
|
Measure |
Formula |
Description |
|
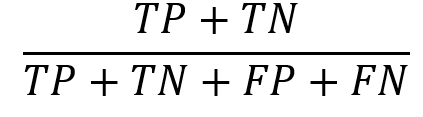
Accuracy |
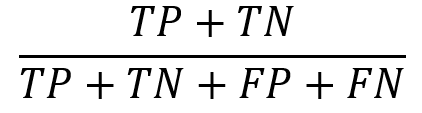
|
What is the percentage of correct predictions? |
|
Precision |
|
Percentage of the correct cases out of the selected cases |
|
Recall |
|
Percentage of the correct cases out of the actual correct cases. |
|
F1 Score |
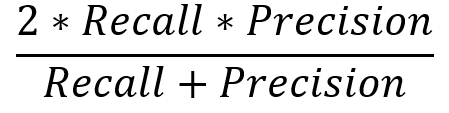
|
Harmonic means of Precision and Recall |
|
Matthews correlation coefficient (MCC) |
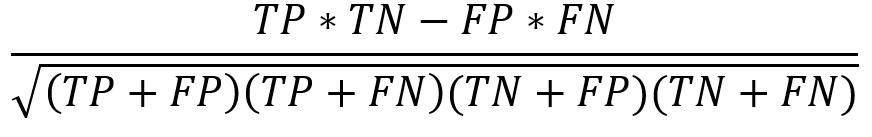
|
Balanced measure even if the class sizes are different. |
Let us look at different evaluation parameters for the different algorithms.
|
Accuracy |
Precision |
Recall |
F1 Score |
MCC |
|
|
Decision Tree |
72.98 |
74.14 |
71.88 |
72.99 |
45.30 |
|
Naïve Bayes |
63.07 |
64.31 |
61.29 |
62.76 |
25.58 |
|
Neural Network |
65.37 |
67.60 |
61.12 |
64.19 |
29.46 |
|
Logistic Regression |
65.63 |
67.73 |
61.72 |
64.59 |
30.03 |
In most of the tools such as Weka, Azure Machine learning has calculated most of these values but not in SQL Server.
After looking at the above values, from the classification matrices, the decision tree is the best algorithm from the available four. We discussed during our previous articles, that there are different mining model parameters relevant to different algorithms. To verify whether the parameters have improved the model, we can utilize the same techniques.
Conclusion
Measuring Accuracy in data mining is an important aspect of data Mining. Since there are a few options to choose the necessary algorithms, it is essential to choose what is the best algorithms. In this, a Lift chart can be used as a visual tool to find a better model. Further, the Profit chart will be helpful to find out what is the optimum number of cases that can be chosen. Classification Matrix or the confusion matrix is used to derive various classification accuracy matrices.
Table of contents

View all posts by Dinesh Asanka
- Testing Type 2 Slowly Changing Dimensions in a Data Warehouse - May 30, 2022
- Incremental Data Extraction for ETL using Database Snapshots - January 10, 2022
- Use Replication to improve the ETL process in SQL Server - November 4, 2021