In this 37th article for SQL Server Always On Availability Groups, we will explore useful dynamic management views for monitoring availability replicas and databases.
Introduction
In the previous article, Explore dynamic management views for monitoring SQL Server Always On Availability Groups, we explored the DMV’s for the Availability group for Windows Failover Clusters.
This article takes a further step and covers useful DMV related to availability replica and databases. Let’s start our journey with this article.
Monitoring Availability Replicas
sys.availability_replicas
We get information about the existing availability replicas for each SQL Server Always On Availability Groups. For example, in my lab environment, I have two availability groups – [demoag] and [SQLAGDemo]. Each availability group has two replicas therefore, we get four rows in the output.
|
1 2 3 |
select replica_server_name,endpoint_url, availability_mode_desc, failover_mode_desc,secondary_role_allow_connections_desc,create_date, backup_priority,read_only_routing_url,seeding_mode_desc,read_write_routing_url from sys.availability_replicas |
The useful columns for this DMV output are as below:
- endpoint_url: SQL Server Always On Availability groups use database mirroring endpoints for primary and secondary replica communications. SQL Server automatically configures an endpoint once we define an availability group. In this column, we get the endpoint URL
- availability_mode and availability_mode_desc: It specifies whether the AG is configured in the
synchronous or asynchronous mode
- 0: Asynchronous commit
- 1: Synchronous commit
- 4: Configurations only: In this mode, the primary replica does not send any data to the secondary replica. It only synchronizes the AG configuration metadata
- failover_mode and failover_mode_desc: Failover mode for an availability replica depends on the availability mode we use
- Synchronous mode: Automatic and Manual failover
- Asynchronous mode: Manual failover
- We get the following values for the failover mode in this DMV:
- 0: Automatic failover
- 1: Manual failover
- secondary_role_allow_connections: We can use the secondary replica for read-only workloads. You can see
the following values for this column
- 0: No connections
- 1: Read-Only
- 2: All connections for read-only access
- create_date: It is the created data of the AG replica
backup_priority: In the availability group configuration, we can configure the backup priority for the replicas. By default, each replica has 50 backup priority. It can use value 0 to 100
You can refer to the article, Understanding backups on Always On Availability Groups for more details
read_only_routing_url: If you have configured the read routing URL for your availability group, you get its URL in this column. In my case, I did not configure it; therefore, it shows NULL value
You can check out this article, How to Configure Read-Only Routing for an Availability Group in SQL Server 2016 for more details on Read-Only routing
- seeding_mode: For the direct seeding, it shows the value Automatic else you get manual seeding
read_write_routing_url: In SQL Server 2019, you can redirect connections from the secondary replica to the primary replica for all read-write connections. If any user connects to the secondary replica as well, it does not get any error message because the internally connection is rerouted to the primary replica
We haven’t configured any read-write URL. Therefore, it gives NULL value in the output
Consider referring to Microsoft docs for more details on it
sys.dm_hadr_availability_replica_cluster_nodess
It gives us information about the availability replica for AG in WSFC. You get the information about availability replica irrespective of the replica states.
In the output, we can see the replica server and instance name.

sys.dm_hadr_availability_replica_states
It is a useful DMV to get the details of local replica, remote replica and their synchronization states. Here are the important columns for this DMV.

- role and role_desc: In these columns, we get the replica role in SQL Server
Always On Availability Groups
- 0= Resolving – In the resolving state, the Windows Server failover cluster might be in mid of the failover or failed status. If the WSFC does not have a quorum, then also AG shows in resolving the state
- 1: Primary ( AG primary replica)
- 2: Secondary( AG secondary replica)
- Operational_state and Operational_state_desc: In this column, you get the current operational
state of the replica. You can have the following values in these columns
- 0- Pending failover
- 1- Pending:
- 2- Online
- 3- Offline
- 4-Failed
- 5- failed due to No Quorum
- We can have the following values for primary and secondary replicas depending upon the replica role:
- Primary: Online, Pending, Failed
- Secondary: Online, Failed and NULL
- Resolving: Offline, Pending_failover, failed and failed with No quorum
- recovery_health and recovery_health_desc: You get the ONLINE_IN_PROGRESS and ONLINE values for this DMV. It is the rollup for the database_state column in DMV sys.dm_hadr_database_replica_states
- synchronization_health and synchronization_health_desc: We get the synchronization status of all
availability group database in the synchronous or asynchronous commit. The possible values for these columns
are as below
- 0: Not healthy
- 1: Partially healthy
- 2: Healthy
Monitoring Availability databases
In this category, we will explore dynamic management views related to availability databases in SQL Server Always On Availability Groups.
sys.dm_hadr_auto_page_repair
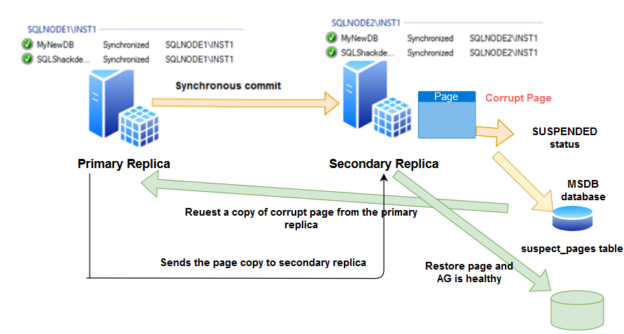
SQL Server Always On Availability Group provides automatic page repair functionality. In the case of any corrupt page, it receives the page from another replica as shown in the below image.
- You can refer to the article Automatic Page Repair in SQL Server Always On Availability Groups for more details

sys.dm_hadr_database_replica_states
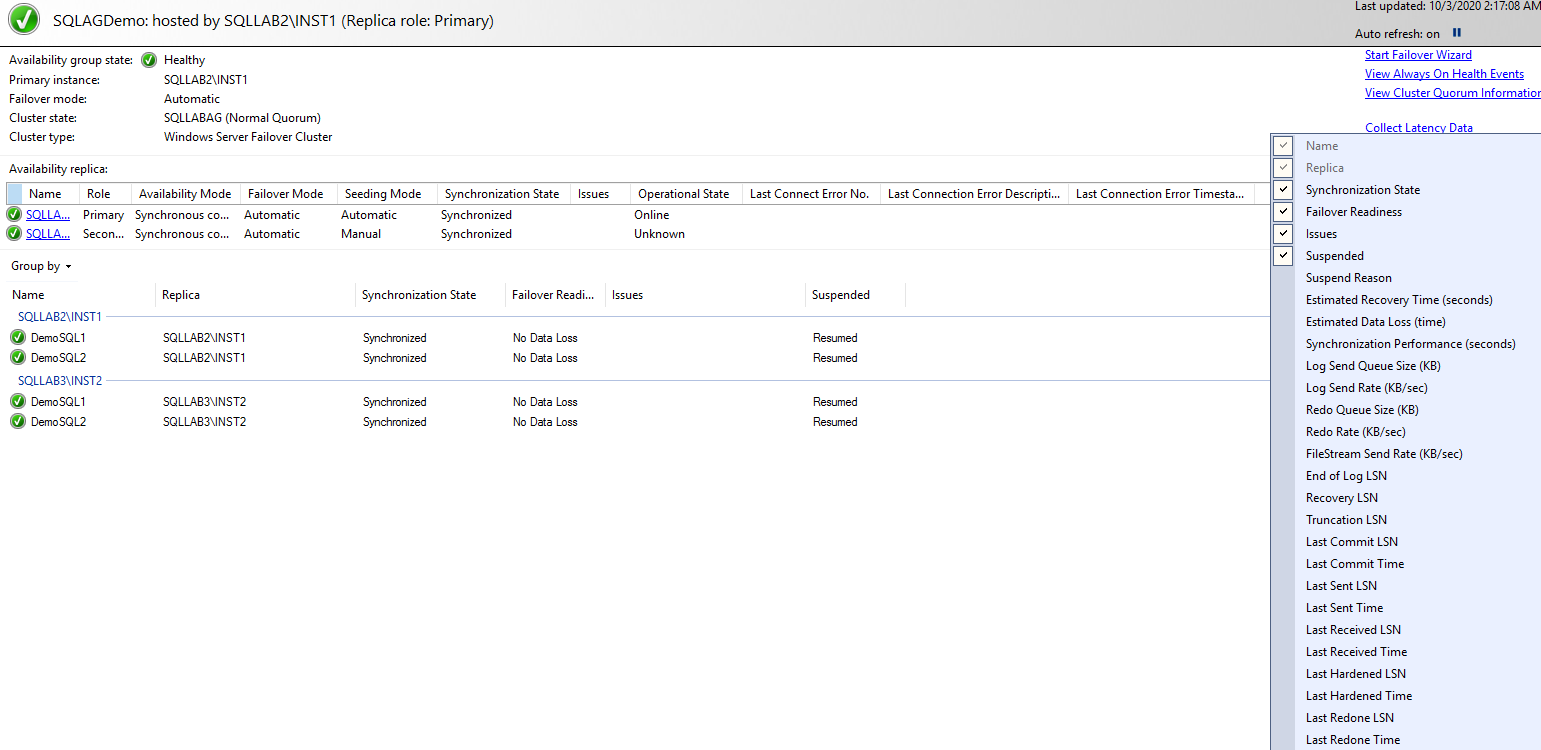
It is again a useful DMV to get information about primary and secondary replica synchronizations, Log sequence numbers, database state, suspend\resume. In the AG dashboard, we see the information about the primary, secondary replica states. The dashboard fetches information from this DMV and displays it in a graphical format.
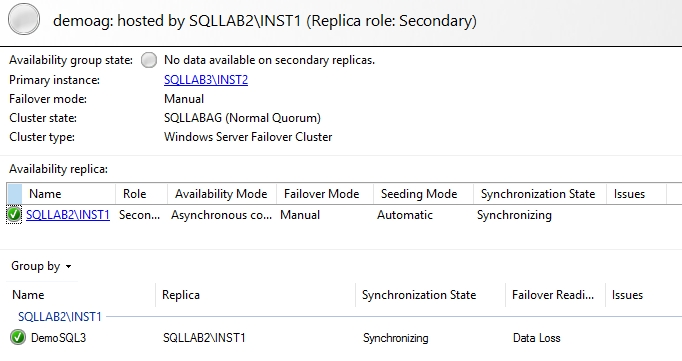
As we can run the AG dashboard on both primary and secondary replica. The AG dashboard from the primary replica shows information about all replicas; however, if you launch it from the secondary replica, you get information only for the connected secondary replica.
In the below images, we can see the AG dashboard and DMV output.
|
1 2 3 4 |
select db_name(database_id) as [Database],is_primary_replica, synchronization_state_desc,database_state_desc,is_suspended,suspend_reason_desc, recovery_lsn,truncation_lsn,last_sent_lsn,last_sent_time,last_received_lsn,last_received_time,last_hardened_lsn,log_send_queue_size,log_send_rate,redo_queue_size, redo_rate,end_of_log_lsn,last_commit_lsn,last_commit_time,secondary_lag_seconds from sys.dm_hadr_database_replica_states |
- database_id: It is the database id of the AG database; we can use the db_name() function to get the database name
- is_primary_replica: It returns value 1 for the primary replica and 0 for a secondary replica
- synchronization_state and synchronization_state_desc: It depicts data movement states for AG databases
- 0: Not synchronizing- If the primary replica does not send the transactions to the corresponding secondary replica, it shows the state as Not Synchronizing. It might be due to the connection issue, suspended data movement, failover
- 1: Synchronizing – In asynchronous data commit, we get the status of the AG database as Synchronizing
- 2: Synchronized: If both primary and secondary replica is in sync for the synchronous data commit, we get the Synchronized value
- 3: Reverting: It shows that the secondary database is in the Redo phase of recovery
- 4: Initializing: It indicates the Undo phase of recovery for the secondary database
- database_state_desc: In this column, we get the status of the database similar to the sys.databases. It
can have the following values
- Online
- Restoring
- Recovering
- Recovery Pending
- Suspect
- Emergency
- Offline
- NULL
- is_suspended: If the database movement suspends between primary and its connected secondary replica, it changes the flag to 1
- 0: Resumed
- 1: Suspended
- Suspend_reason: Here, it updates the reason for suspending data movement. It might be
user-initiated or due to a forced failover scenario
- 0: User-initiated suspend activity (SUSPEND_FROM_USER)
- 1: Due to forced failover(SUSPEND_FROM_PARTNER)
- 2: Redo: Due to error in the Redo phase (SUSPEND_FROM_REDO)
- 3: Capture: Due to error in the primary replica log capture process.
- 4:Apply: Due to error in writing log (SUSPEND_FROM_APPLY)
- 5: Restart: Due to database restart(SUSPEND_FROM_RESTART)
- 6:Undo: Due to error in the Undo phase (SUSPEND_FROM_ Undo)
- 7:Revalidation: Due to mismatch in log change (SUSPEND_FROM_REVALIDATION)
- 8: Error: Due to error in secondary replica LNS point (SUSPEND_FROM_XRF_UPDATE)
secondary_lag_seconds: You can check the lag between the primary and secondary replica using this column
You can refer to the article, Measuring Availability Group synchronization lag that uses the DMV’s to calculate the synchronization lag
Apart from this, it gives you LSN information for each phase of data transfer between the primary and secondary replica similar to the AG dashboard. It is useful to troubleshoot the synchronization issues between the replicas.
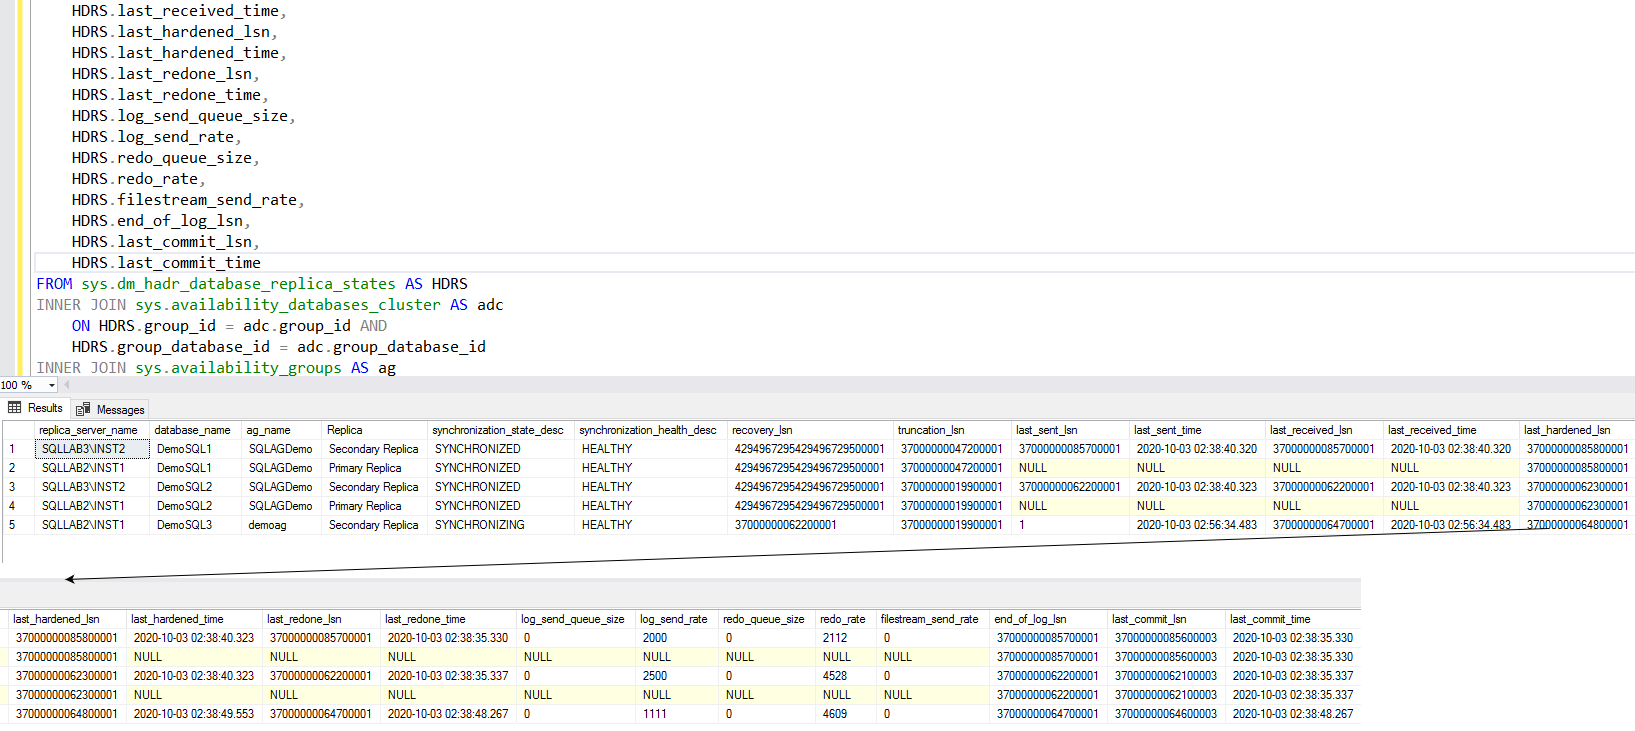
We can combine multiple DMV’s to get sufficient information for monitoring SQL Server Always On Availability Groups.
The below query joins the following DMV’s.
- sys.dm_hadr_database_replica_states,
- sys.availability_databases_cluster
- sys.availability_groups
- sys.availability_groups
- sys.availability_replicas
|
1 2 3 4 5 6 7 8 9 10 11 12 13 14 15 16 17 18 19 20 21 22 23 24 25 26 27 28 29 30 31 32 33 34 35 36 37 |
SELECT ar.replica_server_name, adc.database_name, ag.name AS ag_name, case HDRS.is_primary_replica when 1 then 'Primary Replica' else 'Secondary Replica' end as Replica, HDRS.synchronization_state_desc, HDRS.synchronization_health_desc, HDRS.recovery_lsn, HDRS.truncation_lsn, HDRS.last_sent_lsn, HDRS.last_sent_time, HDRS.last_received_lsn, HDRS.last_received_time, HDRS.last_hardened_lsn, HDRS.last_hardened_time, HDRS.last_redone_lsn, HDRS.last_redone_time, HDRS.log_send_queue_size, HDRS.log_send_rate, HDRS.redo_queue_size, HDRS.redo_rate, HDRS.filestream_send_rate, HDRS.end_of_log_lsn, HDRS.last_commit_lsn, HDRS.last_commit_time FROM sys.dm_hadr_database_replica_states AS HDRS INNER JOIN sys.availability_databases_cluster AS adc ON HDRS.group_id = adc.group_id AND HDRS.group_database_id = adc.group_database_id INNER JOIN sys.availability_groups AS ag ON ag.group_id = HDRS.group_id INNER JOIN sys.availability_replicas AS ar ON HDRS.group_id = ar.group_id AND HDRS.replica_id = ar.replica_id |
Conclusion
In this article, we explored useful dynamic management views for monitoring SQL Server Always On Availability Groups. You should be aware of the DMV’s, their usage. You can use the queries to run on multiple replicas, automation, monitoring.
Table of contents
- Understanding PostgreSQL SUBSTRING function - September 21, 2024
- How to install PostgreSQL on Ubuntu - July 13, 2023
- How to use the CROSSTAB function in PostgreSQL - February 17, 2023


