Steve Simon

Steve Simon

Reporting in SQL Server – Using calculated Expressions within reports

December 19, 2016 by

Introduction

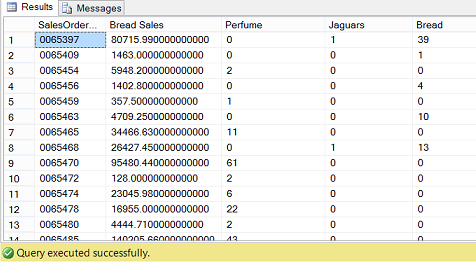
Late in October, I received an unusual request from the head of sales within one of my client sites. Sales sells three articles: bread, perfume, and Jaguar motor cars. Now the reader will note that one of these items is a staple and the other two are for those folks with considerable disposable income. Management within the firm had increased the salesmen’s bonuses for those folks that managed to sell perfume and/or Jaguars along with the standard loaves of bread. The summary report may be seen below showing the final bonus rate for each sales order booked during the month.

Read more »

How to use Expressions within SQL Server Reporting Services to create efficient reports

December 9, 2016 by

Introduction

As many of you by now know, I am a fan of utilizing expressions within Reporting Services reports to add additional flexibility. Recently I received a client request to create a stacked bar report which in turn would provide access to the underlying data the made up the bars on the chart. My client sells two articles: “Whigs” and “Tories”. Many people like to “buy” them.The idea is to display the aggregated data as may be seen below (gray black and turquoise) and depending on which bar and color is selected( clicked upon), to drill down and to display the underlying detailed data (see below).

Read more »

How to use SQL Server Data Quality Services to ensure the correct aggregation of data

November 9, 2016 by

Introduction

An interesting opportunity arose at a client site during early October which provided a phenomenal opportunity to do a Data Quality Services implementation. My client (a grocer) had been requested to produce summary reports detailing the amount of funds spent during 2016 (YTD) with the myriad of manufacturers from whom the chain purchases their inventory. All “accounts payable” entries are done manually and as such are prone to errors.

Read more »

How to create an image cataloging system using SQL Server Reporting Services

November 2, 2016 by

Introduction

With Christmas just around the corner, in today’s “get together” I thought that we would have some fun by cataloging a collection of ‘your favorite items’. Whether it be a coin collection, a china plate collection or a stamp collection, the process is the same and certainly something that you will enjoy creating and maintaining. For today’s example, we are going to construct a “Postage Stamp” cataloging system. We are going to see how we are able to get from this…

Read more »

How to effectively extract data from an OLAP cube by relying upon T-SQL

October 19, 2016 by

Introduction

Last month I ran two Business Intelligence pre-conferences in South Africa. A interesting request arose during the course of the preconference in Cape Town. The individual wanted an approach to extracting data from an OLAP cube that would avoid intensive utilization of MDX and more reliance upon T-SQL. His main concern was with filtering the data at run time, via the report front end.

In this “fire side chat” we shall do just that, utilizing the cube that comes with the new Microsoft database “WideWorldImporters” and we shall learn how we can get from this

Read more »

Reporting in SQL Server – Customize the visual appearance of your reports

October 3, 2016 by

Introduction

As we are nearing the end of the North American summer, I thought that we would take a lighter look at nifty ways of reporting information. In today’s “fireside chat” we have a look at a unique way of displaying our information using charts and line graphs all in one single chart (see below). We shall take things one step further and work with the color fill of the vertical bars to reflect the values that they represent.

Read more »

Reporting in SQL Server – Combine three reports into one using SQL Server Data Tools

August 4, 2016 by

Introduction

In our last “fireside chat” we discussed a few of the challenges that the HR Manager of a major hardware chain was experiencing. Mary Smith, the HR manager has since approached us to modify her existing reports to function more efficiently and effectively by utilizing her existing data, yet reduce the total number of reports.

Read more »

Reporting in SQL Server – Combine T-SQL and DAX queries to produce effective reports

July 27, 2016 by

Introduction

With today’s challenging economic times it has become more and more important to manage and rectify changing sales patterns and trends.

In today’s “get together” we shall be expanding our outlook by creating efficient and effective reports utilizing SQL Server Reporting Service 2016 and T-SQL, together with the DAX code that we created in our last “fire side chat”.

Read more »

SQL Server and BI – How to document your Tabular model with Reporting Services 2016

July 20, 2016 by

Introduction

A few weeks back I had been working on an interesting proof of concept for a client within the food/grocery industry. The objectives were to be able to provide the client with information on sales patterns, seasonal trends and location profitability. In our previous “get-together” we discussed how to create a tabular model project and how to create efficient and effective reports utilizing Excel.

Read more »

SQL Server and BI – How to document your Tabular model with Excel

July 12, 2016 by

Introduction

A few weeks back I had been working on an interesting proof of concept for a client within the food / grocery industry. The objectives were to be able to provide the client with information on sales patterns, seasonal trends and location profitability. The client was an accountant and was therefore comfortable utilizing spreadsheets. This said, I felt that this was a super opportunity to build our proof of concept utilizing a SQL Server Tabular Solution and by exploiting the capabilities of Excel and Power Reporting for the front end.

Read more »

SQL Server data mining – How to turn the data into valuable information

June 10, 2015 by

Introduction

In a past chat back in January 2015, we started looking at the fantastic suite of data mining tools that Microsoft has to offer. At that time, we discussed the concept of a data mining model, creating the model, testing the data and running an ad-hoc DMX query. For those folks that may have missed this article, the link may be found immediately below;

Read more »

SQL Server and BI – Creating a query for the revenue projection

June 5, 2015 by

A few days ago I received an interesting challenge from one of our clients. The lady was attempting to estimate her potential monthly revenue recognition for the fiscal year beginning January 1, 2015, through December 31, 2015. The lady named Linda sells goods and services (each class yielding differing sales margins).

In the first portion of this two-part discussion, we shall be looking at the revenue projections for goods.

Read more »

Using the “Row_Number” function and a WHILE loop to create the rolling average report

May 27, 2015 by

Introduction

A few days ago I received an email from a gentleman in the healthcare industry. He had read an article that I had previously published a few years back on a well known SQL Server website. Based on the original article, he requested a few ideas on how to expand the sample code to do a rolling three-month revenue summary, in addition to a rolling three-month revenue average.

In today’s get together, we shall be looking at doing just this!

Read more »

How to import data into SQL Server databases using the OData source for SQL Server Integration Services

April 6, 2015 by

Introduction

A few days back I was looking at ways to access raw data from within Microsoft Dynamics CRM in an effort to extract the raw data and to place it in our data warehouse. I started to explore utilizing OData and SSIS to pull the necessary data from the cloud to our local warehouse.

Whilst there are known authentication issues between Dynamics CRM and the Microsoft OData SSIS data source (and thus we could not utilize this access method), I thought it to be so very powerful, that I began looking for other constructive manners in which to utilize the OData Source.

Read more »

How to automate SQL Server database restores

March 30, 2015 by

Introduction

A few days back I encountered an interesting challenge. The client wanted to have copies of the nightly backups of the transactional databases restored on a warehouse server, to be utilized to update the warehouse.

The over all process

Prior to the pushing the daily backup to the warehouse server, the previous days restore is deleted. The important point being that the “SQLShackFinancial” database is no longer present on the warehouse server. Having been deleted, downloading of the backup file begins and the restore of the current backup version begins. Normal warehouse processing then ensues and so the cycle continues.

Read more »

Which Reporting Services dataset fields are being utilized by the reports?

March 18, 2015 by

Introduction

Have you ever felt like pulling your hair out, trying to ascertain exactly which fields in your existing Reporting Services datasets are being utilized by your reports. This happened to me recently during a corporate conversion and cleanup exercise for a database migration to the cloud.

The “aha moment came after having presented a paper at the PASS SQL Server Nordic Rally (March 2015), when one attendee came up to me and asked if I knew of a method to do this. As they say ‘necessity is the mother of invention’ and spiking my interest, I played around until I came up with the solution that we are going to chat about today. The end solution may be seen below

Read more »

How to convert data format into a valuable dataset using SQL Server Reporting Services

March 16, 2015 by

Introduction

Oft times we are forced into situations where we must clearly think outside of the box. In today’s “get together”, we are going to discuss a challenge that I encountered during the last week of February of this year. The client had been charting weekly business calls placed by his sales reps. Our client had been tracking these results within an Excel spreadsheet (see the screen dump below) and he would be using this spreadsheet to report the sales reps progress going forward. My task was to source this data for the corporate reports in Reporting Services, from this spreadsheet and do so on a weekly basis. The client, being resistant to change, was not willing to change the format of the spreadsheet to something more conducive to be utilized by the chart that he wished to produce (see immediately below).

Read more »

Reporting in SQL Server – create a matrix based sub-report called by the previously created main report

March 4, 2015 by

Introduction

As you will remember from our last “get together” we created an application that permitted us to report upon financial data based upon an unorthodox financial year. In fact, our fiscal year started in July and ended in June. We created a chart to display the data.

In today’s “get together” we are going to push our application a bit further and build in a subreport which will bring up the underlying data when the end user clicks upon the chart for any particular month. Thus should the user click on February 2015, then all of February’s data (for the selected funds) is shown in a matrix. If the user chooses March, then March’s data is shown.

Read more »

Reporting in SQL Server – create a chart based on the data extracted for a given date range

February 27, 2015 by

Introduction

I recently heard from a lady from overseas who wanted to find a quick and dirty mechanism of extracting data for a given date range (based upon a fiscal year that started July 1st and ended June 30th). The idea interested me and as always, I had to try it out.

In today’s “get together”, we are going to have a look at how this may be achieved.

Read more »

Using a cursor to correctly extract SQL Server data and place it in a Reporting Services matrix

February 23, 2015 by

Introduction

In our last two chats, we discussed enterprises that have had financial years that began in July and ended at the end of June. One of our clients works with this fiscal calendar and their financial folks are Excel “Fundi’s” (Fundisa is a Nguni word for “expert”). Many of their reports contain the current month’s sales, in addition, carrying running totals from the beginning of the fiscal year to date. Read more »

Using Master Data Services in SQL Server to quickly create a GUI that may be maintained by the end user

February 20, 2015 by

Introduction

Oft times we are forced into situations where we clearly need to think outside of the box. A case at hand arose early in 2014 where one of our client’s required a “quick and dirty” front end to modify data within a table that reflected the outstanding balances (of their clients) and the attempts that they had made to recover these funds. Master Data Services seemed to be the way to go!

Read more »