Overview
Slow running queries are one of the most common problems in every organization dealing with huge amounts of data. And the most challenging problem, in almost all the clients, I work with, is how to find the queries running slow and figuring out what is the actual cause behind the performance problem. Thankfully, the solution, in most cases, is simple.
I always suggest spending most of the time on figuring out the actual cause behind the problem, not on thinking about the potential solutions which might exist.
Fortunately, there are some tools and techniques which a Developer or DBA should always use (at least) to have a fair idea about the queries running slow.
Before going into the details, I would like to mention here that the tools and techniques I will mention here will be for SQL Developers who do not have expert knowledge of database administration and for Database Administrators who are at the start of their career.
Note: I will be using SQL Server 2016 for my test cases in this article. If you have any prior version, then the Query Store is not available for you but all the other tools will still work.
Tools & techniques
Like every kind of work in the world, there are special tools required. The process of identifying slow running queries is no different. In this article, I will only mention tools that already exist on your system or you can download them free. I would not say that commercial tools do not help, in fact, in large organizations, I would strongly recommend those to save time performing deep dives into each server for highlighting slow running queries. But for the purposes of this article, we want to roll up our sleeves and learn the fundamentals using the existing tools we already have at our disposal.
The first tool which I will mention here is abuilt-in tool for SQL Server Management Studio;“Activity Monitor”. You can view this by Right Clicking on Instance Name in SQL Server Management Studio and selecting “Activity Monitor”.
Activity monitor tells you what the current and recent activities are in your SQL Server Instance.
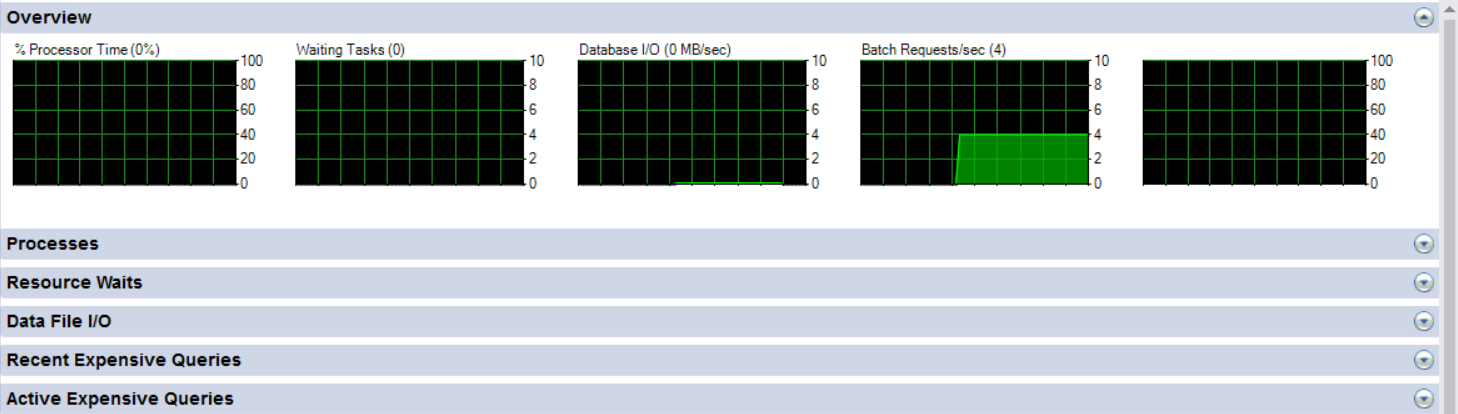
The above screenshot displays an overview window for the Activity Monitor. This screen will show you the graphs for Processor Times, Waiting Tasks, and Batch Requests. Generally, the lower the number of counts the better the performance. In large organizations with huge load there might be huge number of batch requests with high processor times but that does not necessarily indicate a performance problem.
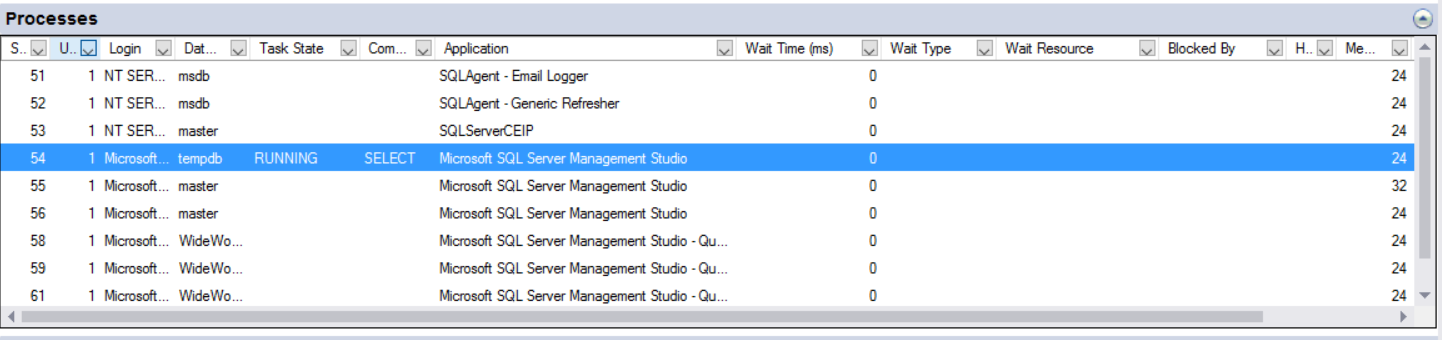
After the overview, you need to focus on Processes which gives you the access to view all the processes running in your instance and having a deeper look for how many processes are waiting, blocking or blocked. This way you can get the idea if you have queries running slow because of any specific wait or if the queries taking time are being blocked by other processes. In this view, you can Right Click on any process and click on Details to view the actual TSQL running for that session.
The queries which are being blocked are those which are actually suspended because of any other process working on the resources the process depends upon. So, if you find queries which are being blocked by other processes then simply check for the root blocker which is causing all the blocking by looking at the Blocked By column. Try to consider just that query, not all the processes which are blocked.
And the queries which are waiting for any specific resource, gives you information about the Wait Resource so you can check for the Wait Type and try to figure out the solution for that problem. Some of the most common wait stats are listed in a comprehensive SQL Shack’s SQL Server wait types section. Go through that in details for further actions.
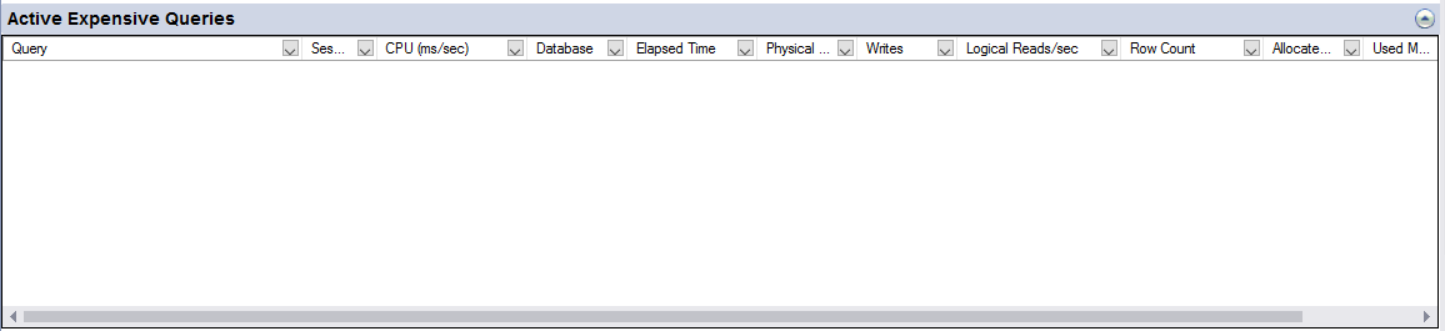
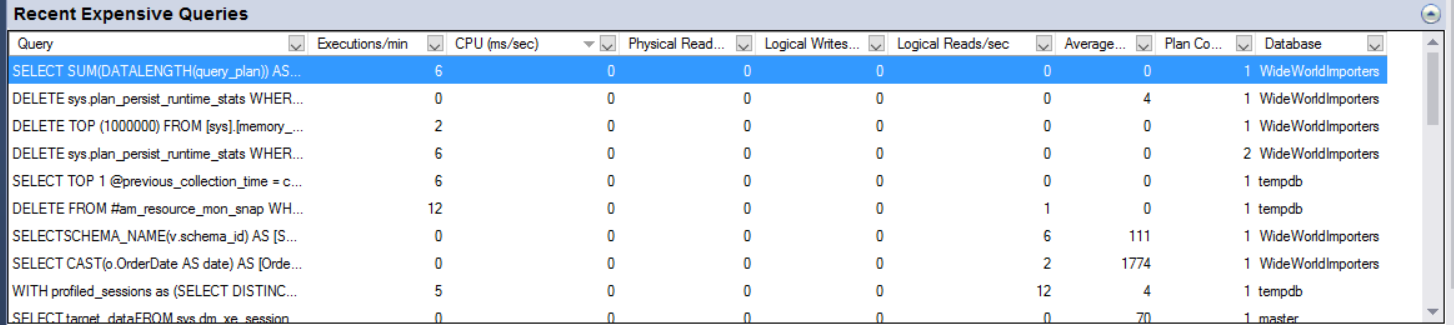
The Active Expensive and Recent Expensive queries will give you information about the queries which have high CPU, Logical Reads or High Elapsed time.
You can go to each section for Current or Recent expensive queries. Sort them by Elapsed time, Logical Read and CPU Time one by one and check the execution plan. In the execution plan you will be able to find out why these expensive queries were taking an inordinate amount of time so that you can take appropriate actions to resolve them. I will let you know how to go through the SQL Server Query Execution Plan later in this article so stay tuned.
The next tool is the “Query Store”. This is helpful and could save your life in situation where you were called in the middle of the night to check why SQL Server was slow 1 hour earlier.
Generally, prior to SQL Server 2016, without any third-party application or custom solutions, you are not able to look at the history of query execution. So, the Query Store provides a great deal of value added functionality in this regard. Ed Pollack wrote about Query Store here so do check this article as it’s a great resource to deep dive into query store.
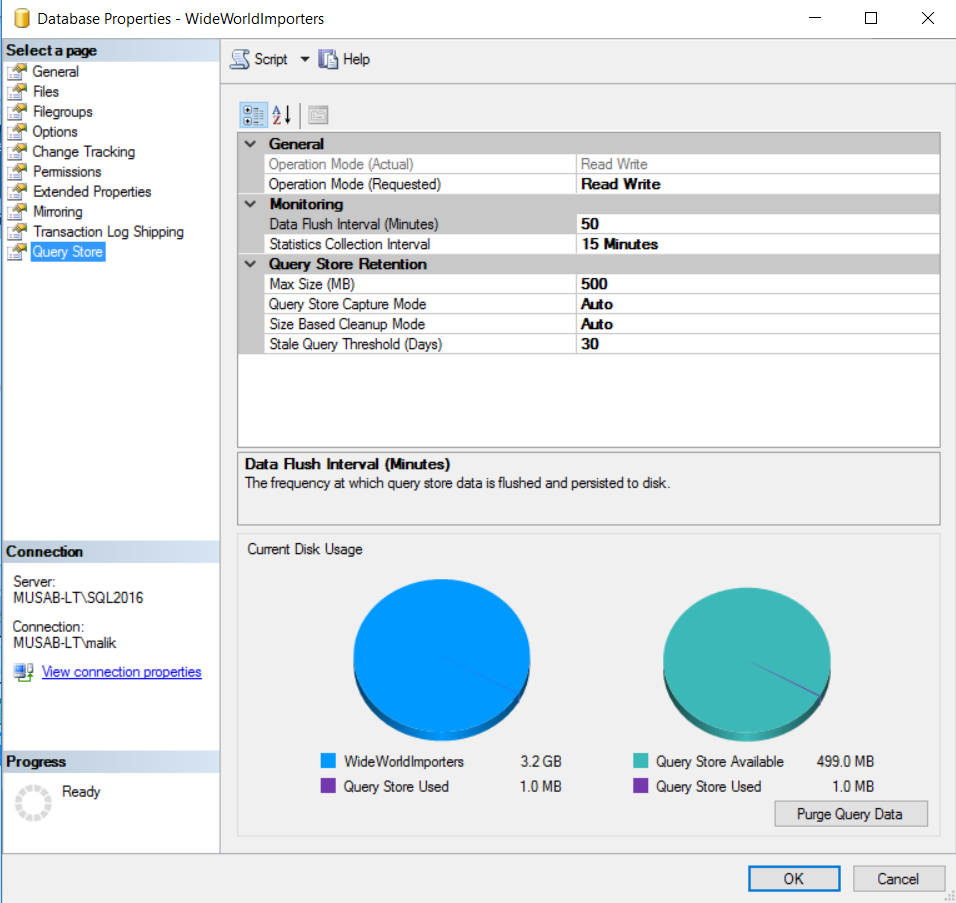
If you have SQL Server 2016 or higher so first you need to enable it in your database properties. After enabling the Query Store, you will have the properties of your database as shown in the screenshot below:
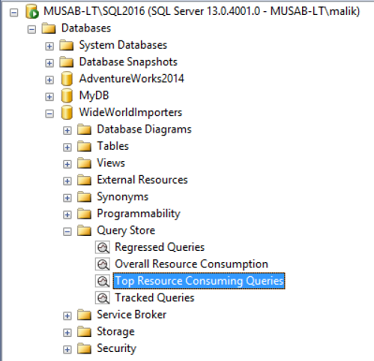
After you have enabled the Query Store you can expand the database objects and go to the “Top Resource Consuming Queries” as shown in the below screenshot:
Note: Give the Query Store a day or two to capture the production load so that you can easily work on it with real load.
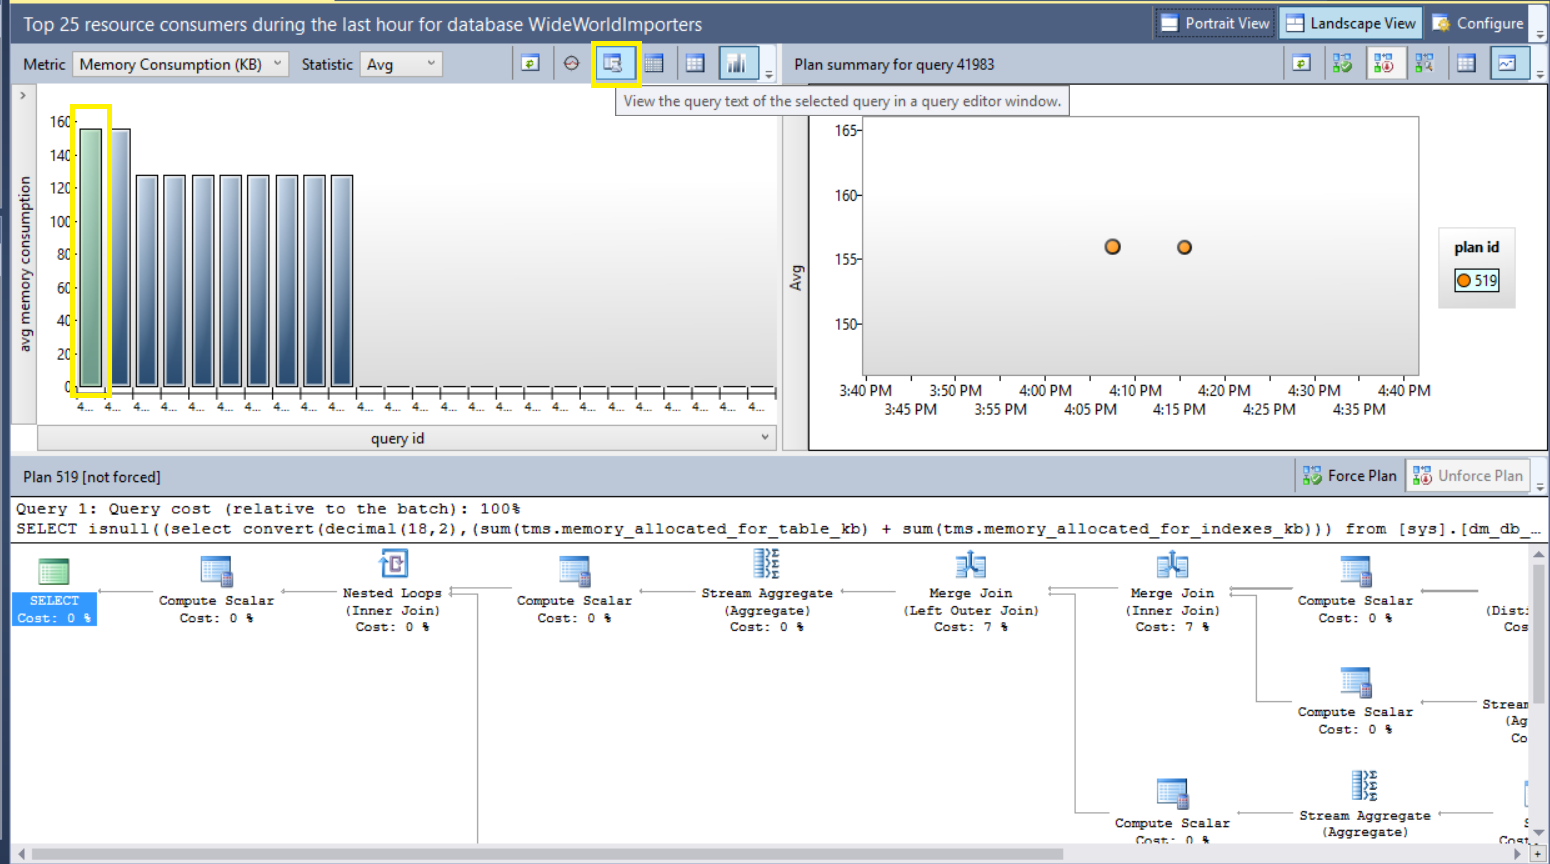
Right Click on Top Resource Consuming Queries and select “View Top Resource Consuming Queries”, you will be taken to the window showing these high resource consuming queries. You can customize the view by selecting an appropriate “metric” like Duration, CPU Time, Logical Read or Memory Consumption. The second thing you need to change is “Statistic”. You can change it to Min, Max or Avg. I would recommend to use Average Statistic with all metrics mentioned above to get queries.
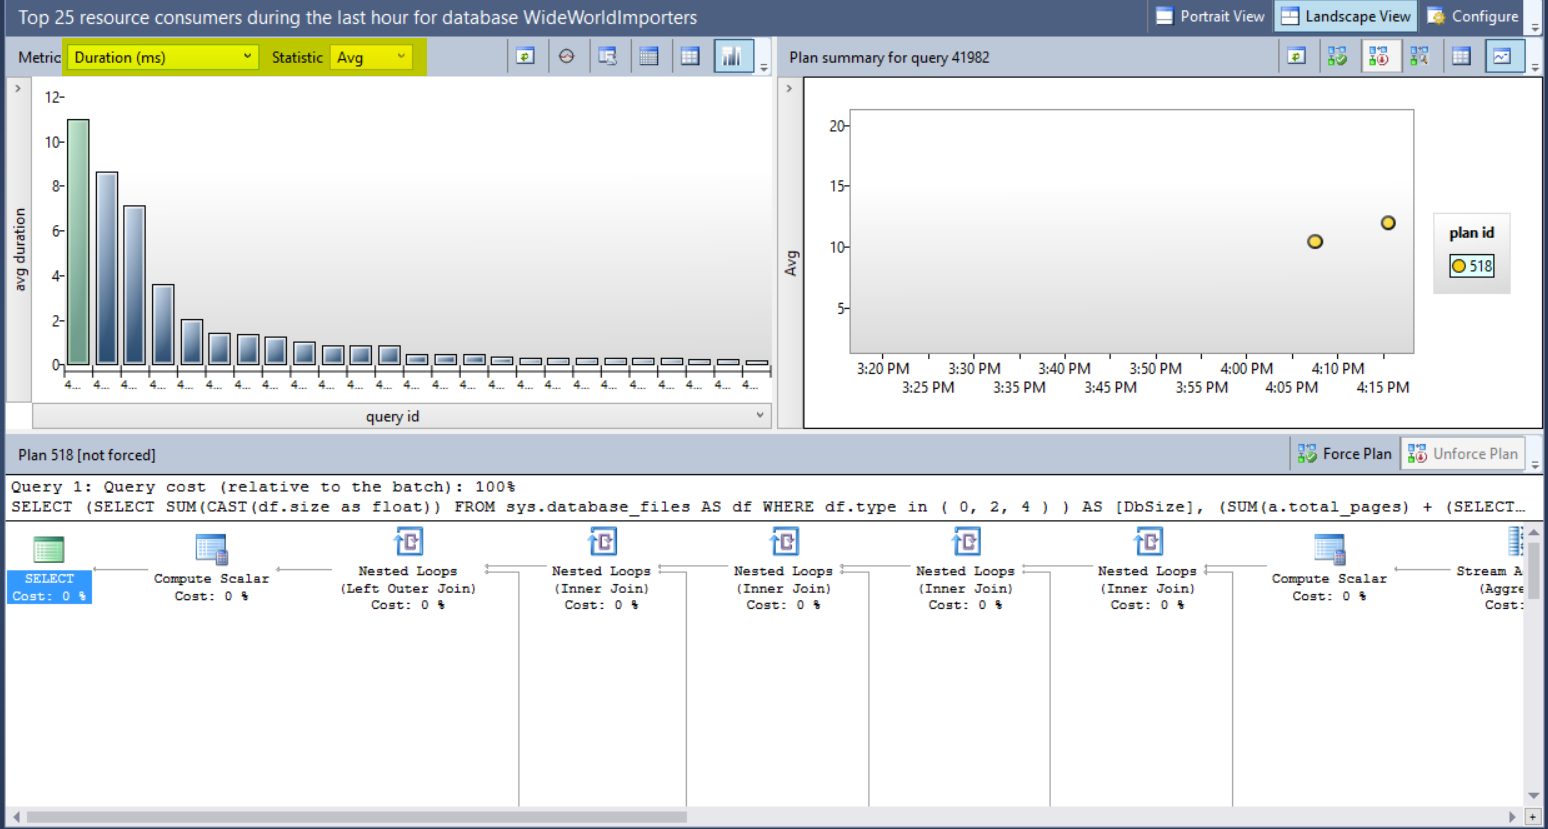
The next step is to highlight the queries which are consuming high resources. After highlighting the graph value in the left-hand side window (as highlighted in the screenshot below) you will get the query execution plan in the bottom window.
You can click on the mentioned below highlighted button in the Query Store window to get the actual Query Text for further analysis.
So, as of now, you have multiple ways to get High Resource usage queries. Now we will see how we can check why the queries are running slow and which part of the query needs to be fixed (if required).
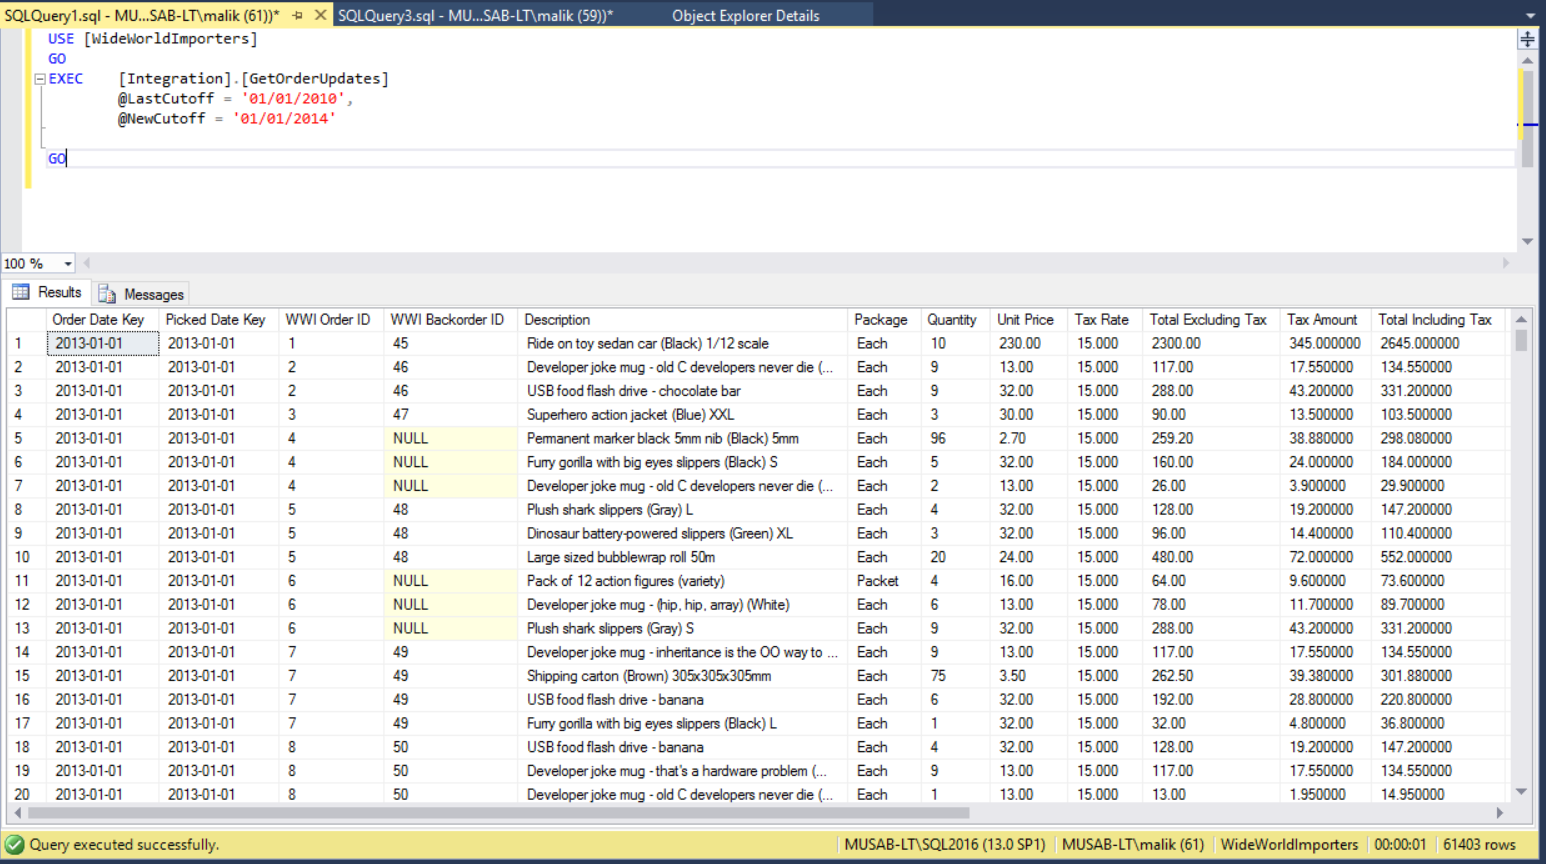
So, here I will take the example of a query used in Microsoft sample database “WideWorldImporters”. The TSQL executes a stored procedure “[Integration].[GetOrderUpdates]”.
The call of this Stored Procedure takes around a second and I will not be optimizing it. This is just to give you an example that how may know, how this second was spent. We also want to know which part of the query is taking most time as well as on which table we must focus.
Below is the stored procedure call and results.
So now we have the call and we will dig deeper into this.
First, we need to enable the Query Statistics for this session. We will enable CPU and IO statistics for this query session by issuing the TSQL “SET STATISTICS TIME, IO ON”.
After executing the mentioned above TSQL for enabling Statistics, we will get IO for each table and Total CPU cost for the queries running inside the stored procedure in Messages tab as shown in below screenshot.
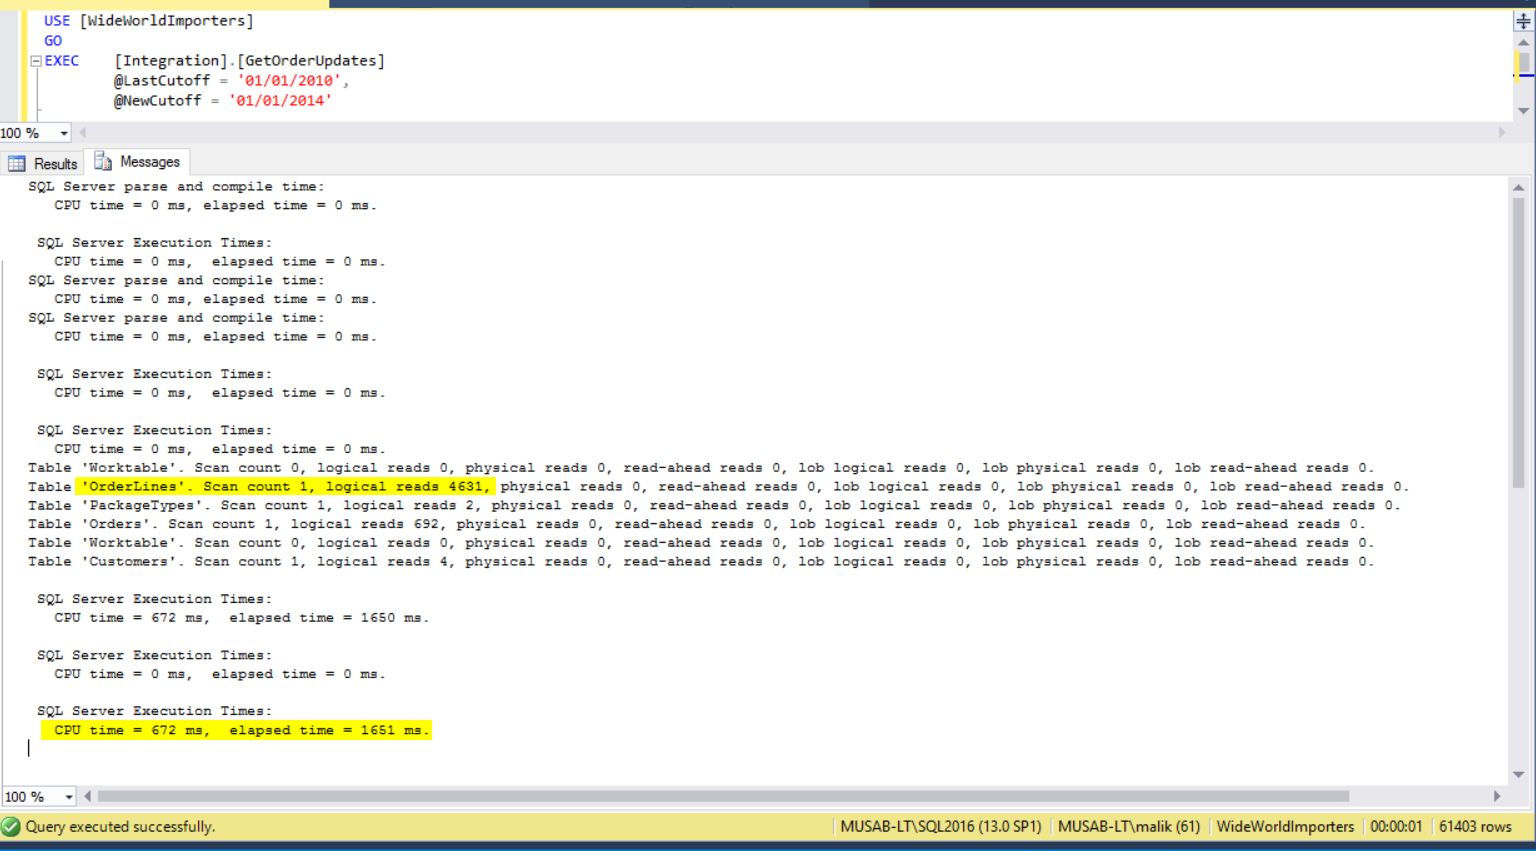
In the above screenshot, we can see that the most IO is taken by OrderLines table and there is only one query which is executing inside the Stored Procedure which is taking 672 ms CPU time (1650 ms Elapsed time).
Note: There might be multiple queries running inside a stored procedure so keep in mind that Statistics will give you time for each query as well as the total for all the queries at the end. So, in case of Stored Procedures for total CPU time only consider the last CPU time and for each query consider its CPU time only and exclude the last CPU time as it’s only a total for all.
As of now, we know that the OrderLines table is taking most of the Logical Reads.
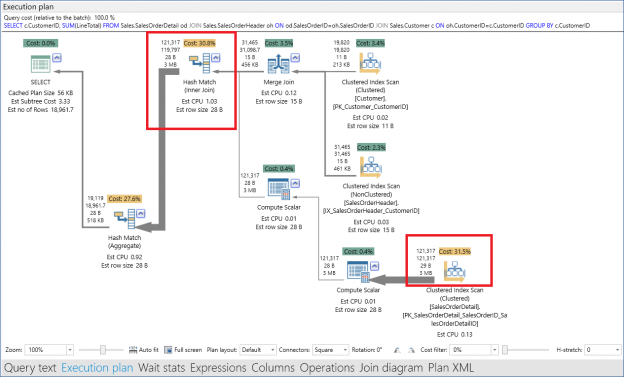
Next, we will enable the Actual Execution Plan for the query by clicking the icon  (Ctrl +M) in SQL Server Management Studio and will try to answer the question of why this table was taking this IO and which component of the execution plan is taking most of the time.
After including the Actual Execution Plan, we will re-execute the query and view the execution plan.
Though, we can obtain much detailed information about Query Execution Plan inside SQL Server Management Studio but there is another great tool out on web which can be used to explore Query Execution Plan in much more intuitive way that is ApexSQL Plan.
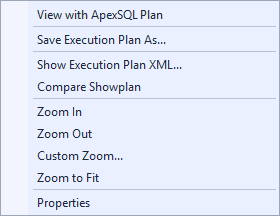
After installing this tool, you might need to restart the SQL Server Management Studio so install it and then re-execute the query to get an Execution Plan. A screenshot tour for this tool is provided here. After executing the query, Right Click on the Execution Plan and you will have the option of “View with ApexSQL Plan”.
After viewing the Execution Plan in ApexSQL Plan, you can see the highlighted items in mentioned below screenshot which will be opened in the ApexSQL Plan.

Couple of points and tips here to look at
- If the table is using Key Lookup, then try to remove that lookup by adding those columns in the index which is used by the table.
- If number of rows returned by the query is way off as compared to number of rows returned by table operators (as highlighted in the lower section of the query plan), then try to re-write the query which filters the data using more columns to reduce the number of rows.
- If estimated rows and actual rows have huge difference, then try to update the Statistics of under lying tables.
- If there are missing indexes indicated by the query, then try to evaluate the index and if that index is helping you query then add it to the corresponding table.
Finally, if your queries are performing well in single execution and only have problem while running in production load so you can easily fake the production load for a single query by using Adam Machanic’s SQL Stress Tool which is available to download from the link here. Then you can capture that slow running query from the techniques mentioned above and tune it up accordingly.
Summary
Mentioned above tools, techniques and tips are the most common solutions for troubleshooting slow running queries. These are common, generic and mostly queries do benefit from them.
Keep in mind there is no pet rule for performance optimization and troubleshooting the slow running queries and this topic is way too big to cover in some articles so I have tried to sum up in a single article some of the most important and common tools and techniques so that the basic trouble shooting should be made easy.
He has 9+ Years of Database Development & Administration experience with Medical Billing, Startup & Financial Companies. He is a Microsoft Certified Expert for Data Platform (SQL Server 2012/2014).
Currently, performing duties as Senior SQL Server Consultant at multiple Saudi Private and Governmental Organizations.
View all posts by Musab Umair
- How to identify slow running queries in SQL Server - May 31, 2017
- Adaptive Query Processing in SQL Server 2017 - April 28, 2017
- What is the SQL Server Virtual Log file and how to monitor it - April 26, 2017