
Introduction
As you will remember from our last “get together” we created an application that permitted us to report upon financial data based upon an unorthodox financial year. In fact, our fiscal year started in July and ended in June. We created a chart to display the data.
In today’s “get together” we are going to push our application a bit further and build in a subreport which will bring up the underlying data when the end user clicks upon the chart for any particular month. Thus should the user click on February 2015, then all of February’s data (for the selected funds) is shown in a matrix. If the user chooses March, then March’s data is shown.
Without further ado, let’s get started!
Getting Started
We begin by opening SQL Server Data Tools and opening the project that we created in the article entitled “Setting run dates on the fly”.
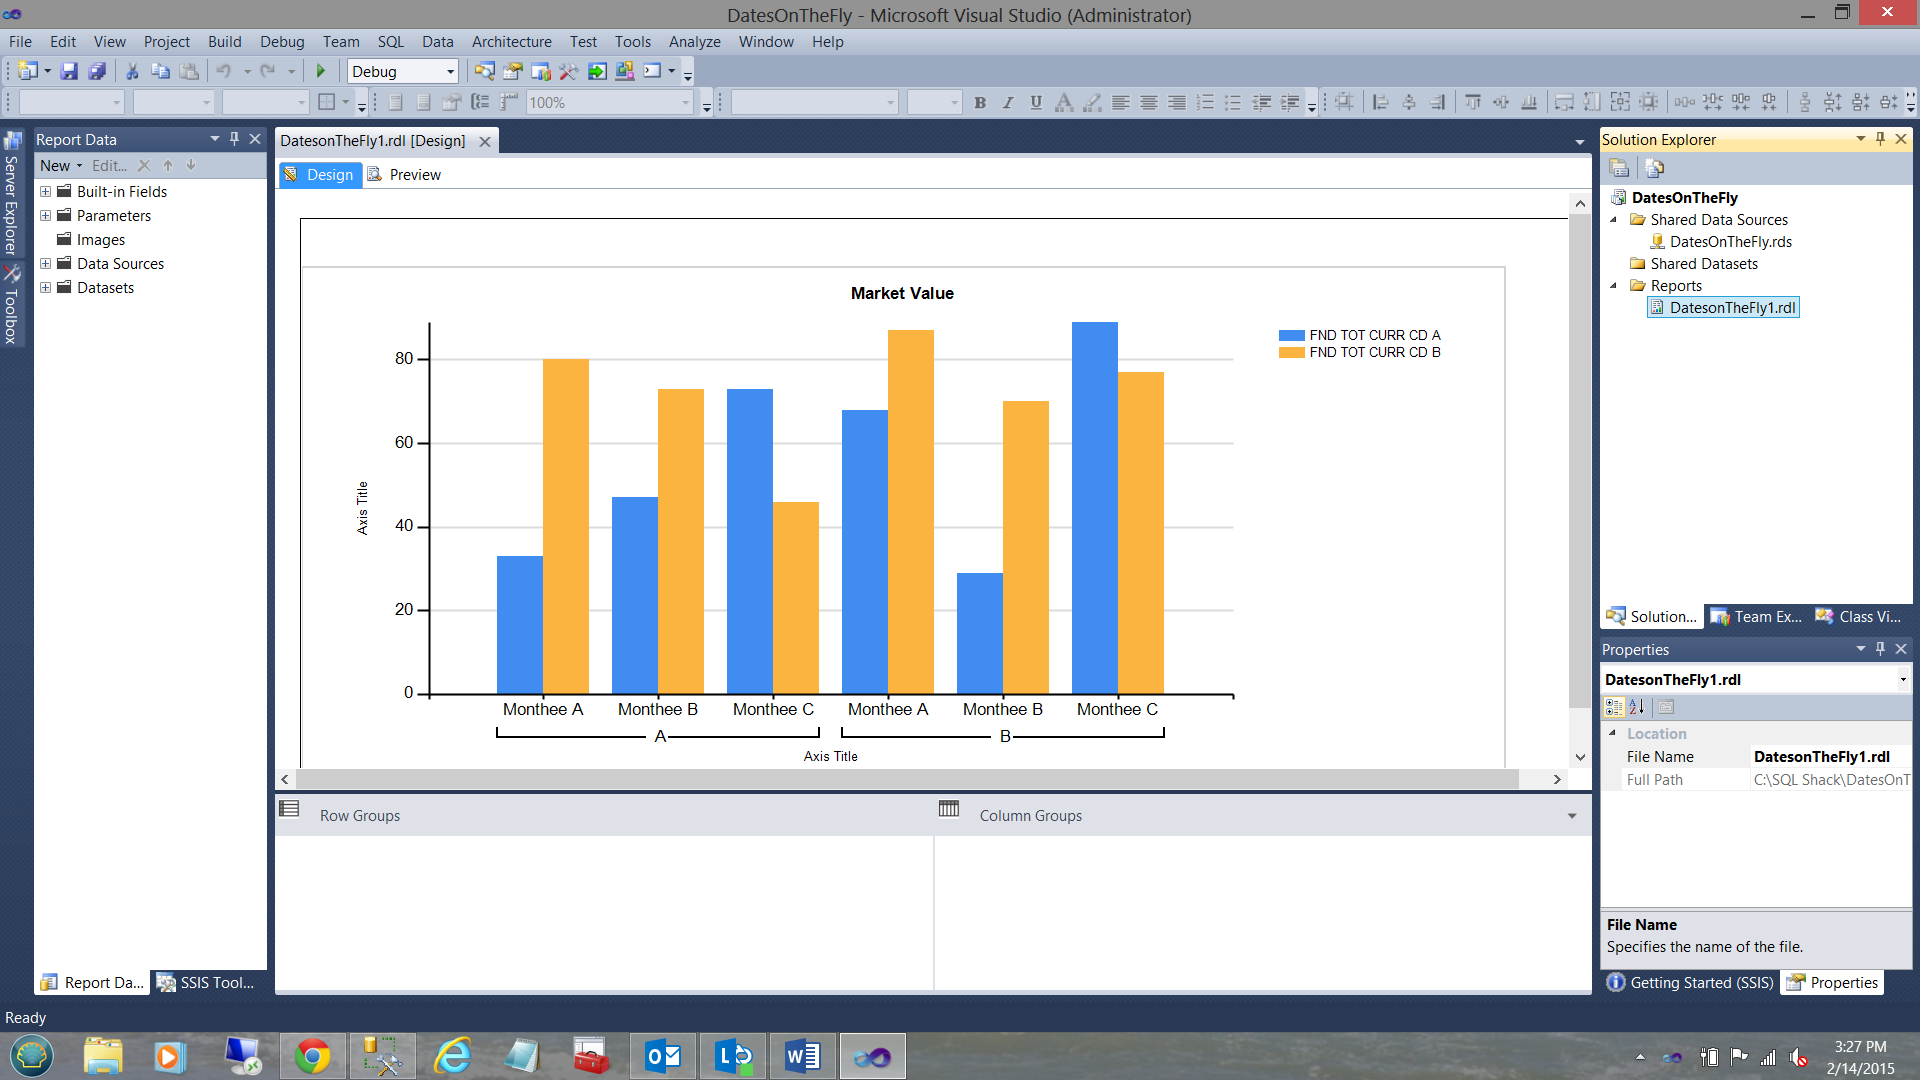
Our report surface is brought into view. We note that at this stage in the game, that all we have is the chart.
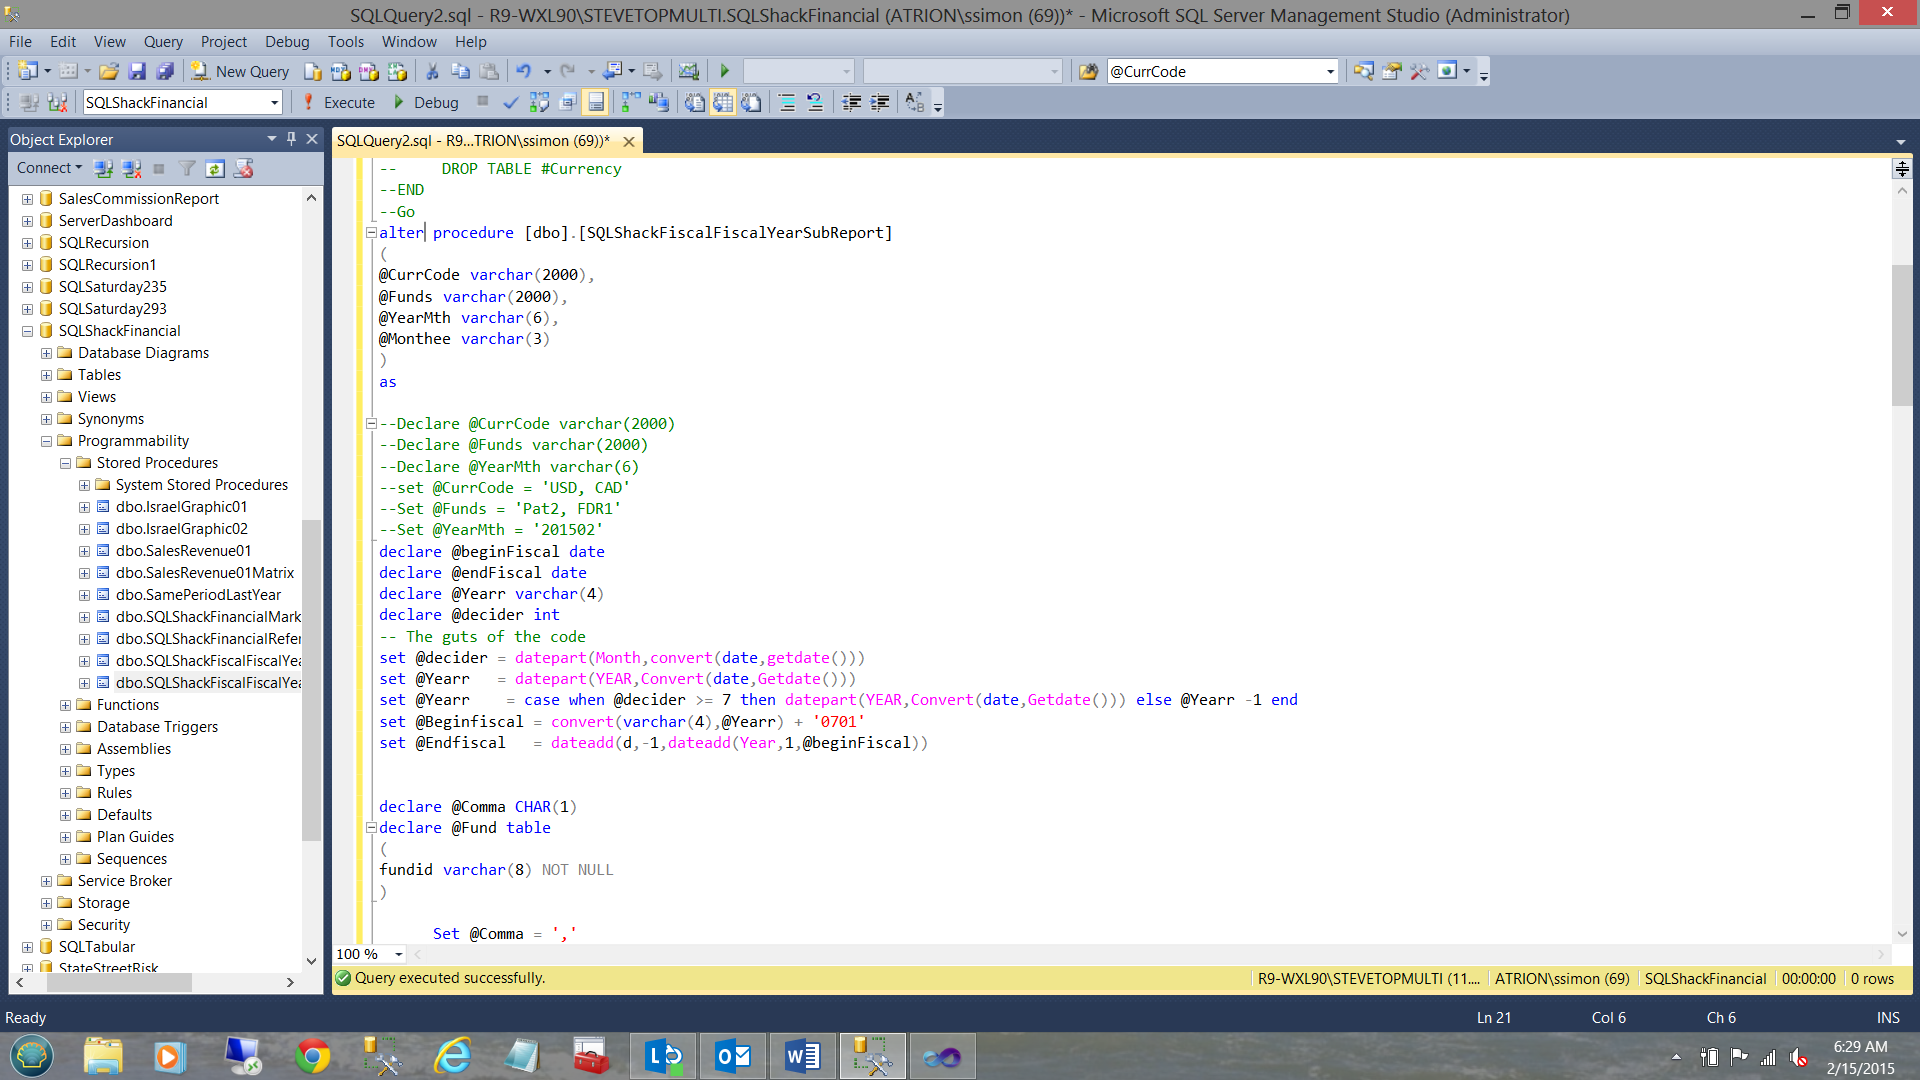
In SQL Server Management Studio, we open the stored procedure that we created for this chart.
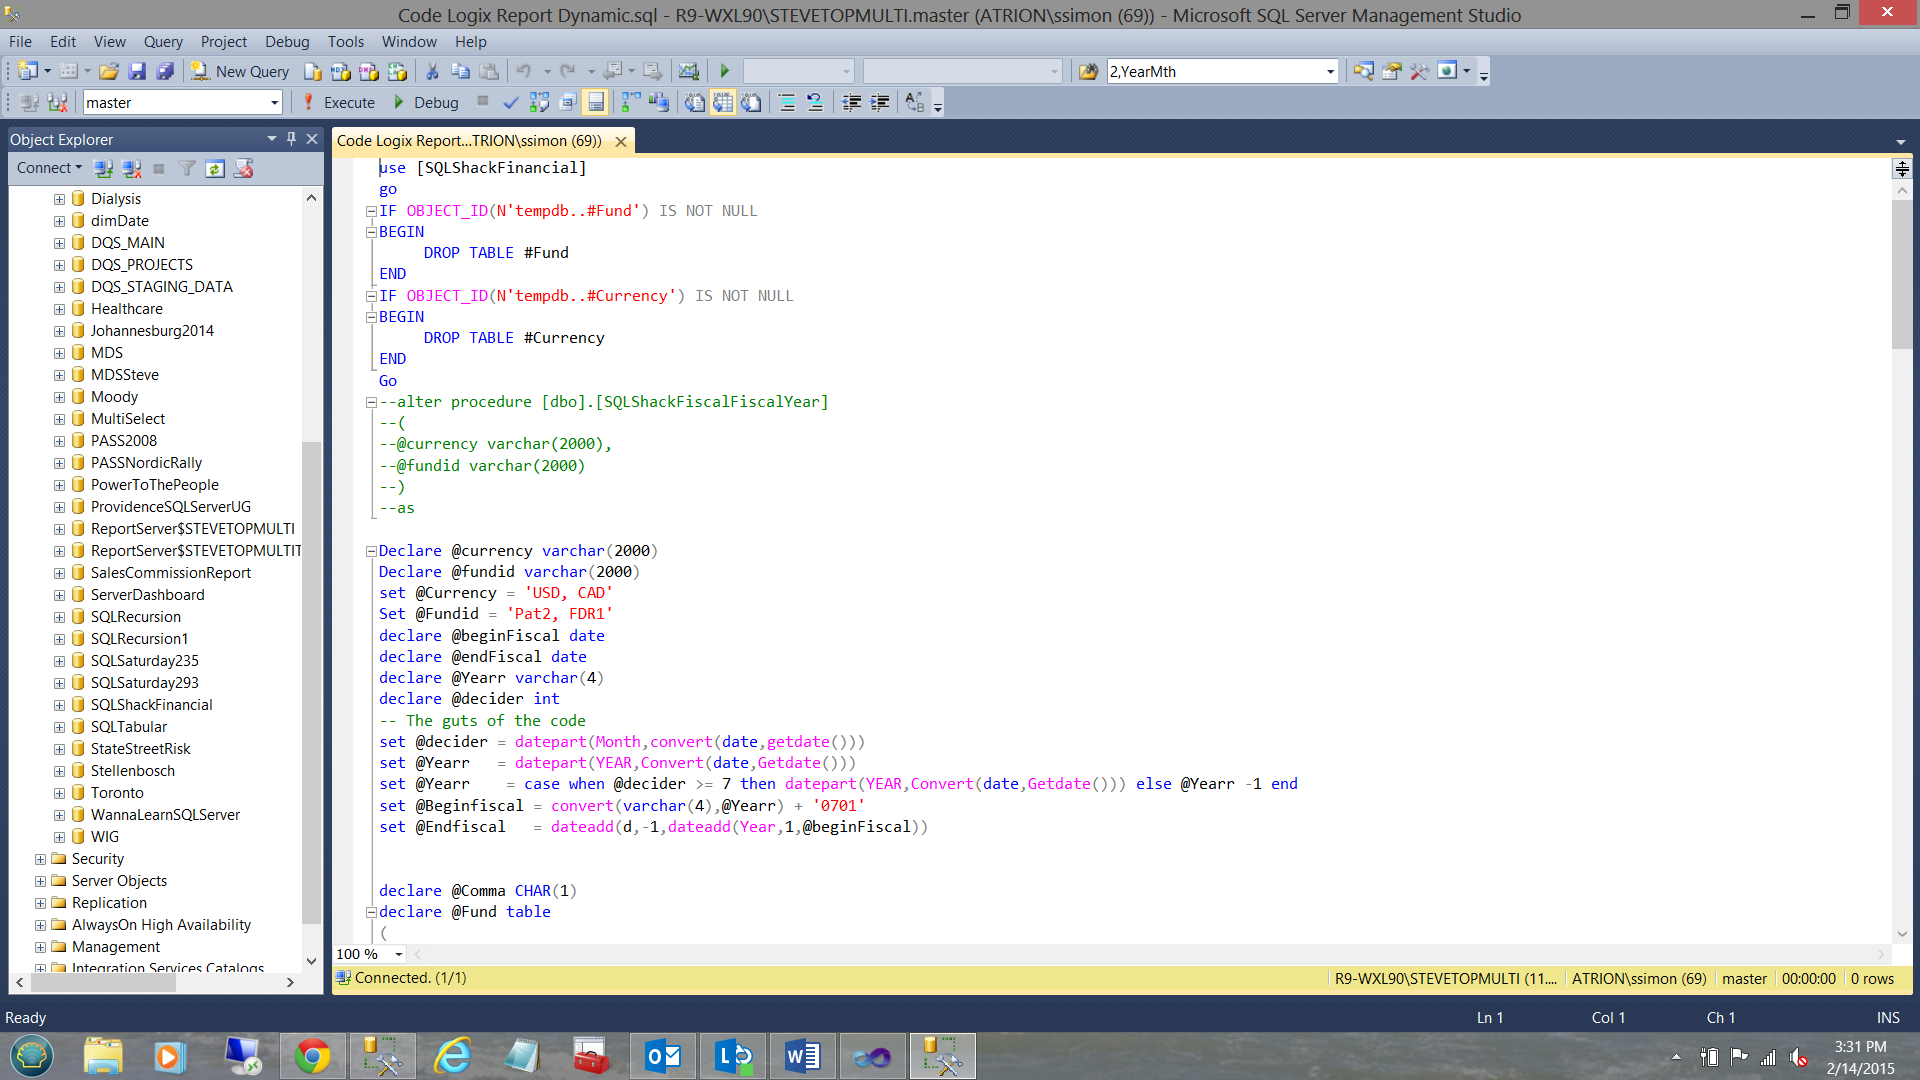
We are now going to clone an additional stored procedure that will utilize an additional parameter and render the raw data behind the graph; the contents of which will be dependent upon which value of year month that is passed through via the main report. The code listing may be seen in Addenda 1.
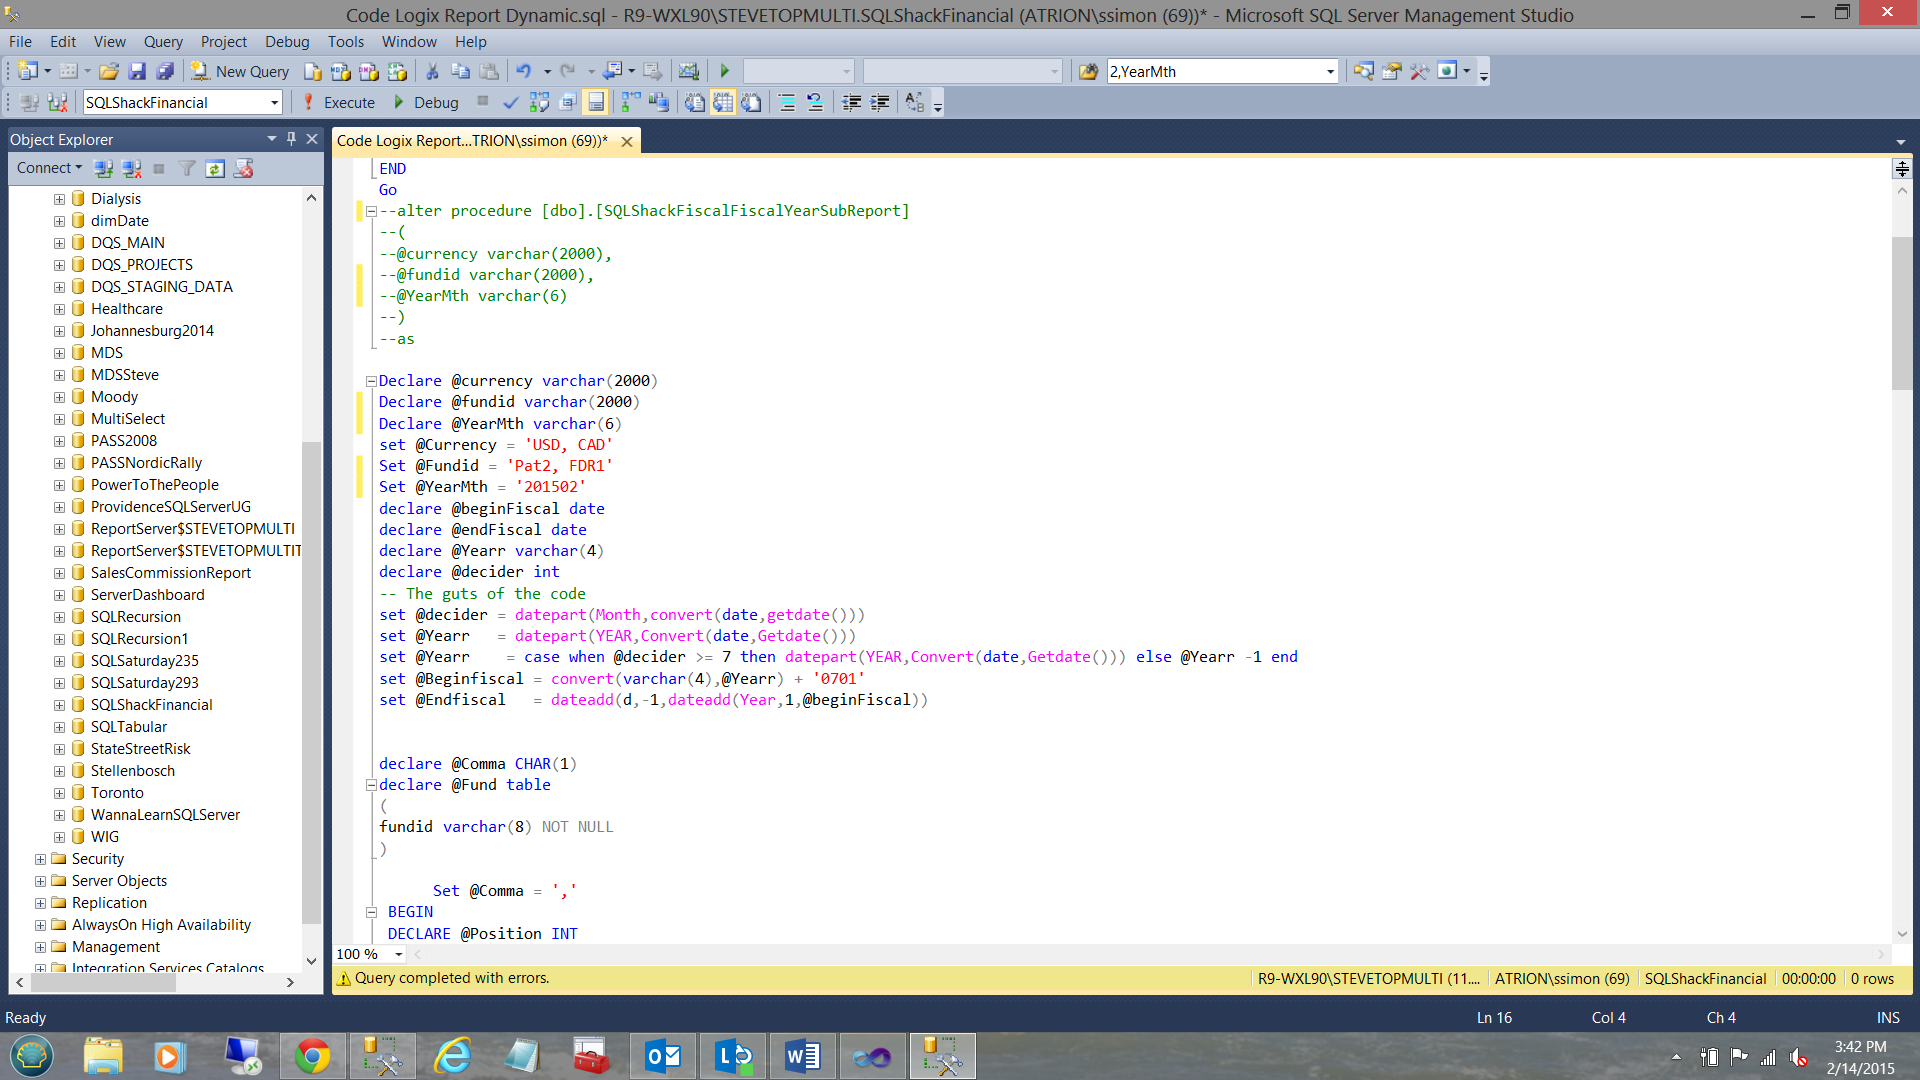
The reader will note that we have added the parameter @YearMth to the stored procedure header (see above). Additionally, we have declared a variable @YearMth and set this variable to ‘201502’. This will be commented out once we are ready to create the new stored procedure.
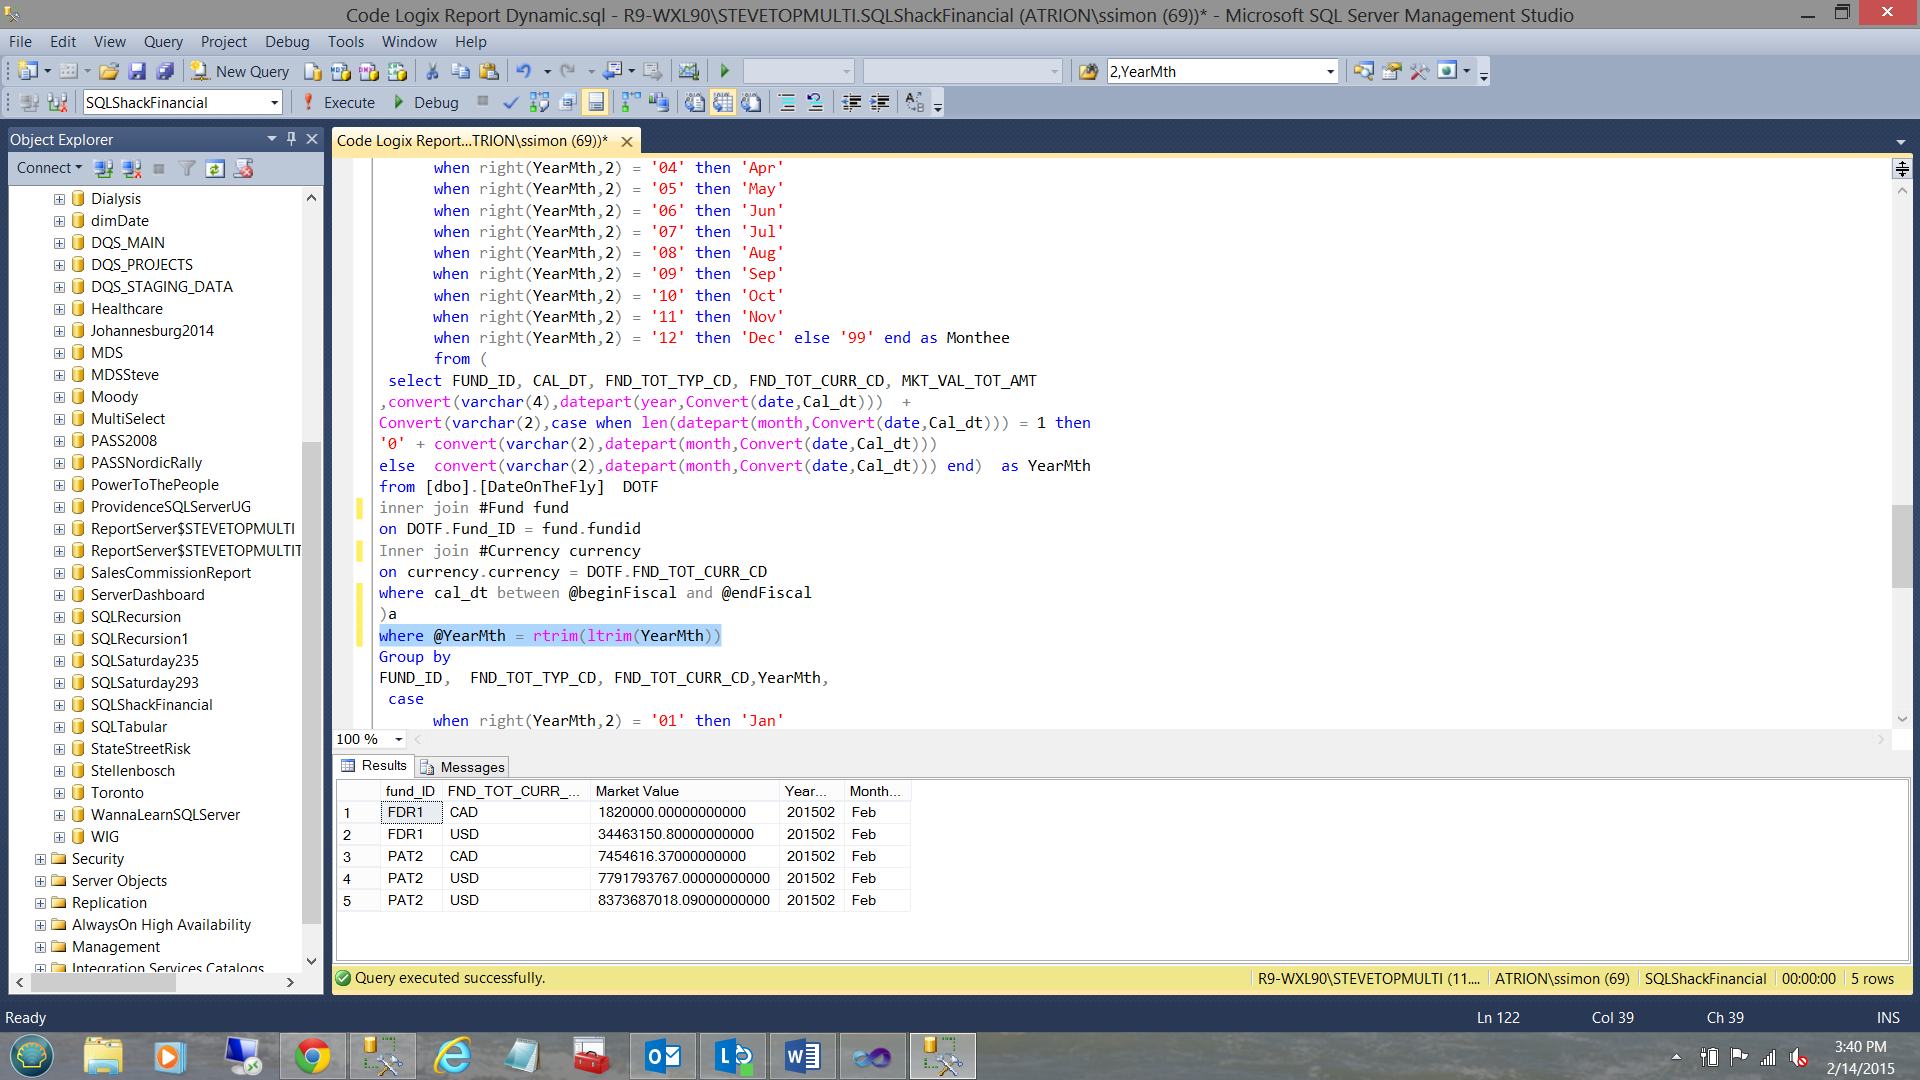
In the screen dump above, we are able to view the result set generated by the query.
Back in Reporting Services
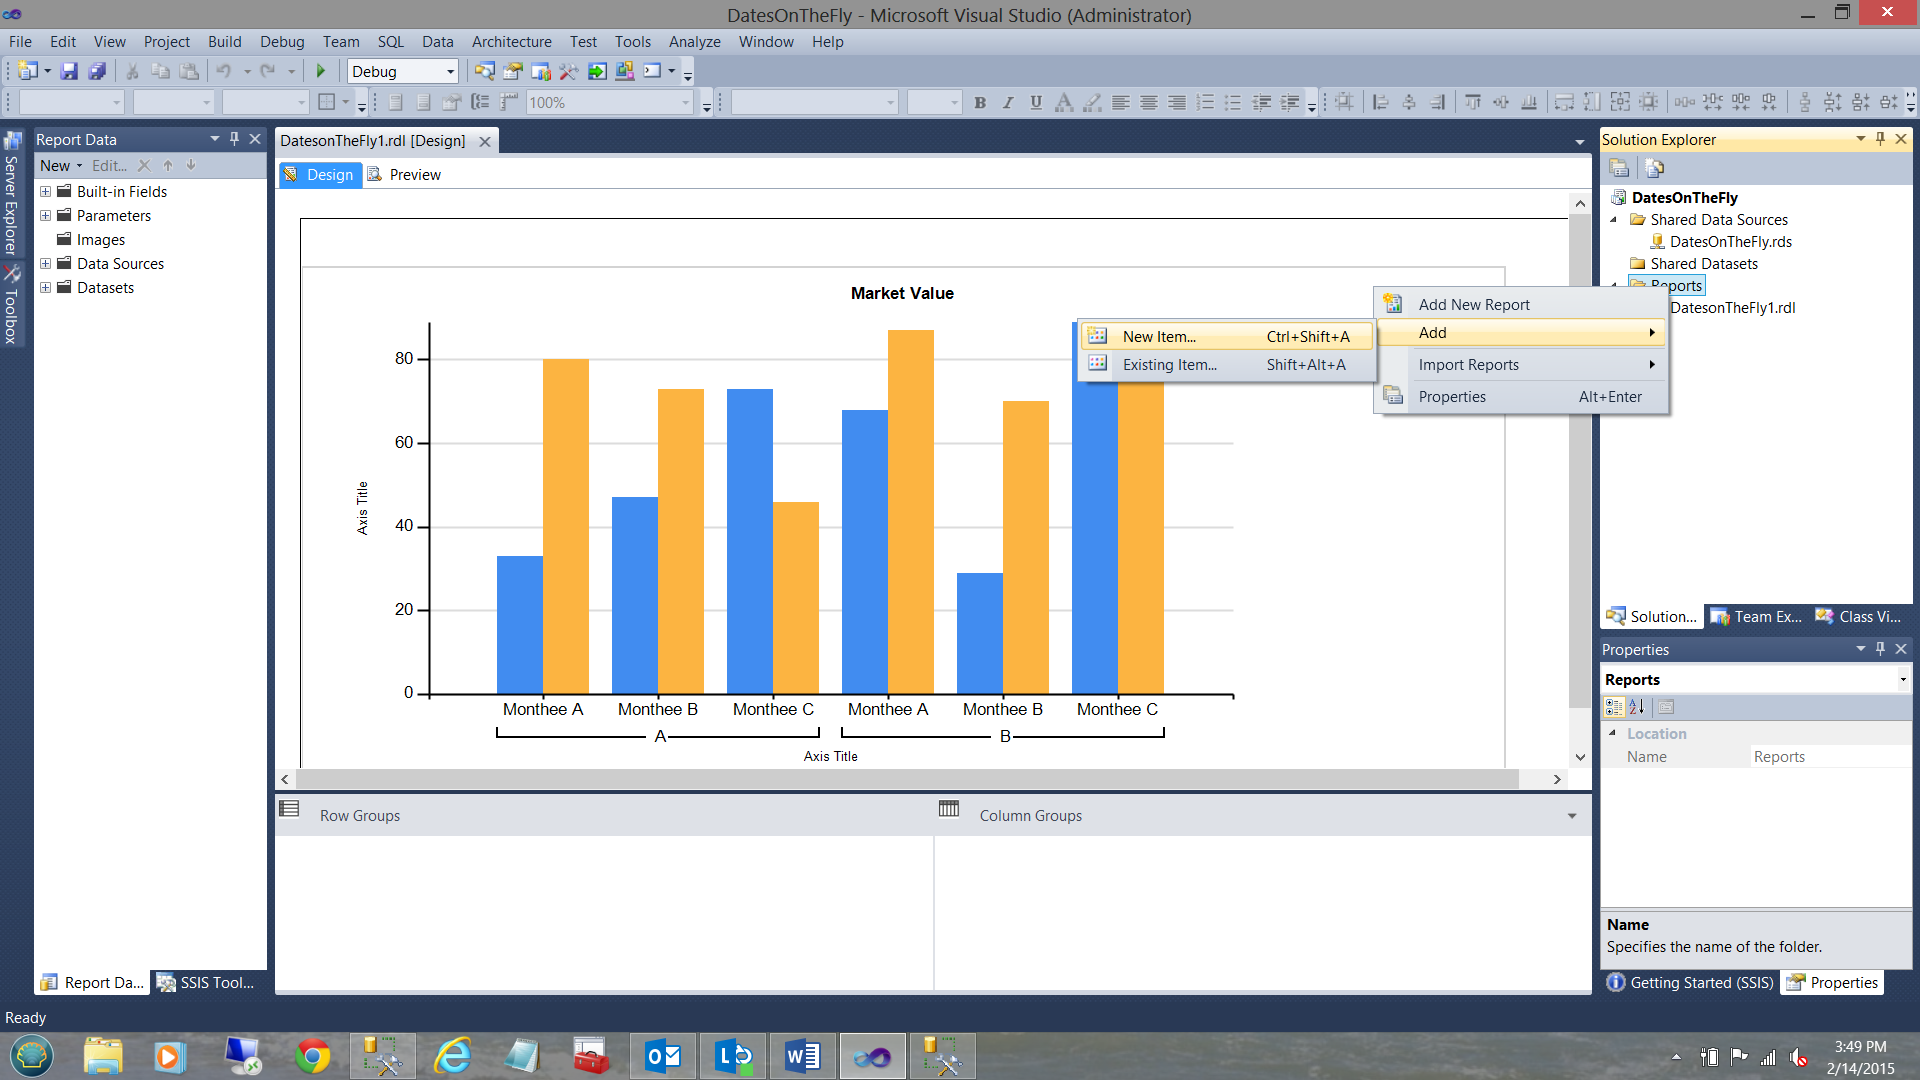
We right click upon the “Reports” folder and select “Add” and “New Item”.
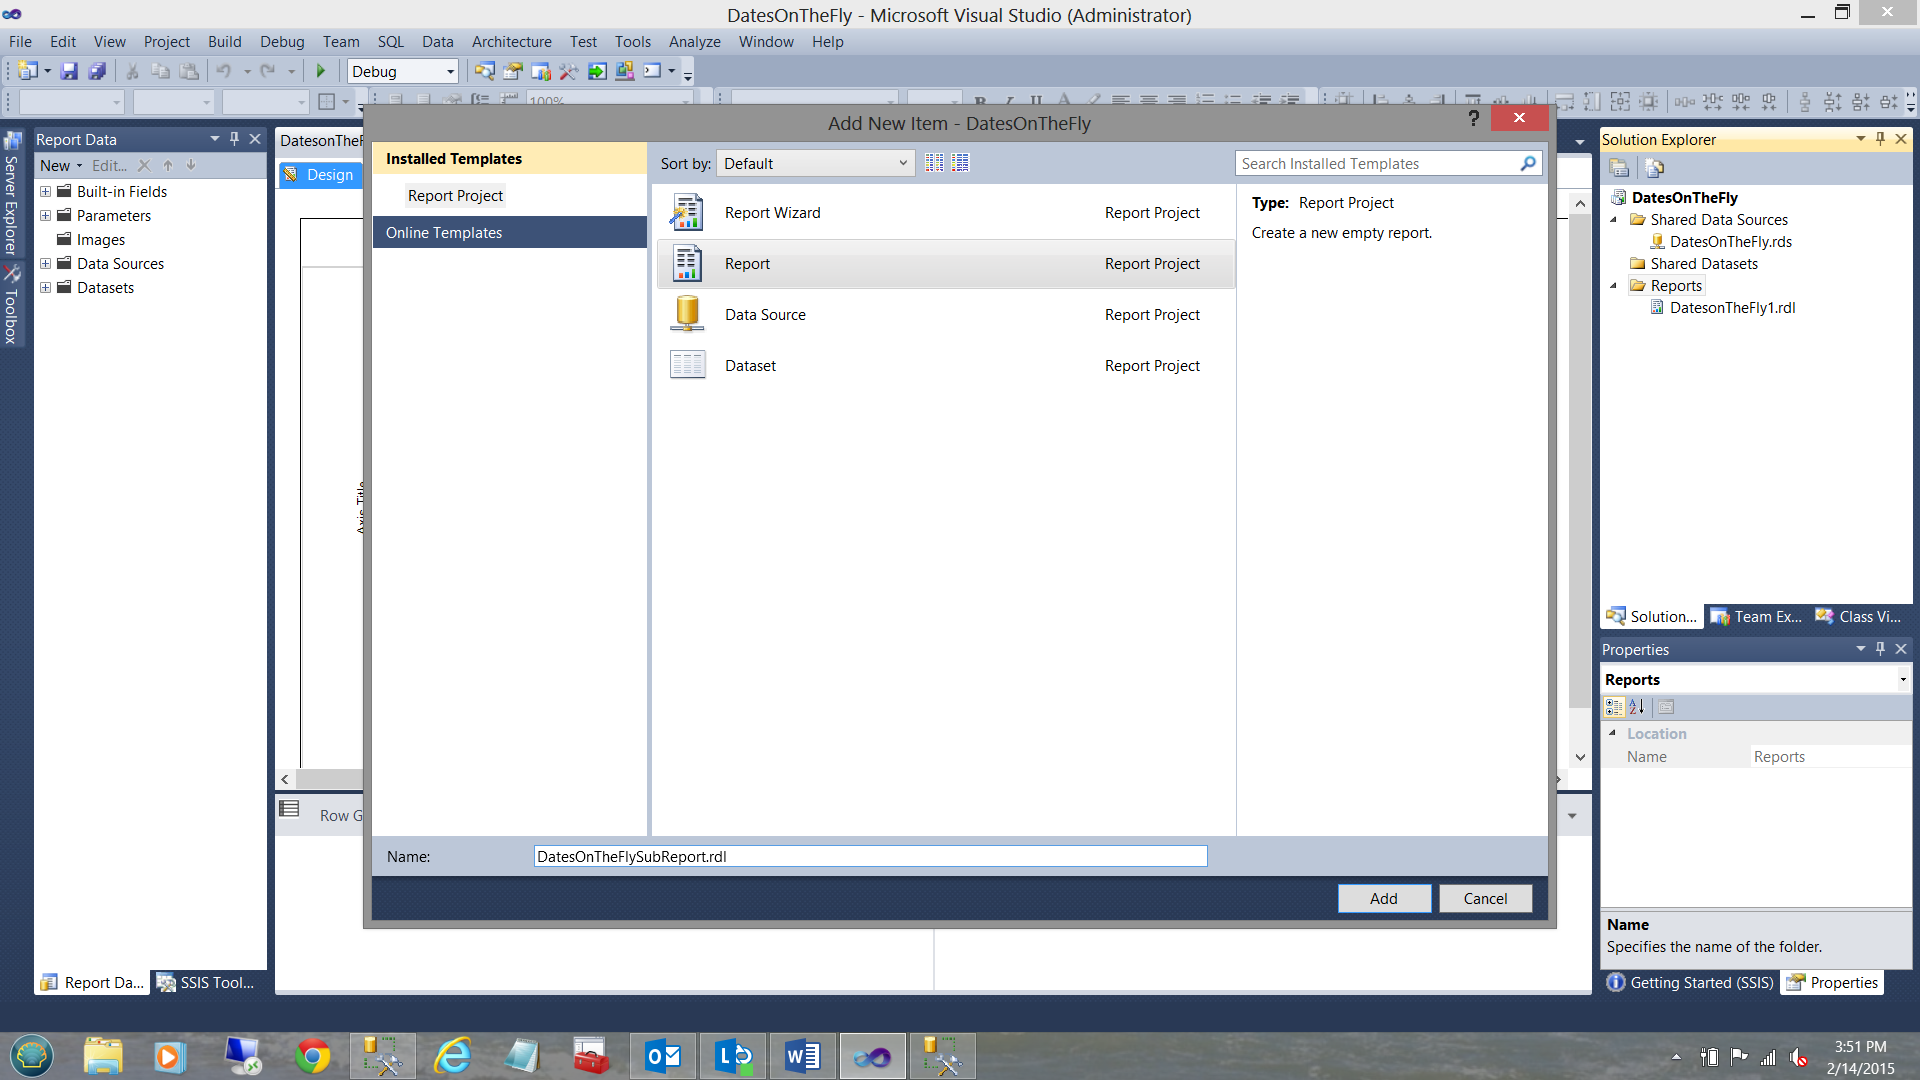
We select “Report” and give our report a name “DatesOnTheFlySubReport”. We click “Add” and we are brought into the “DatesOnTheFlySubReport” subreport drawing surface (see below).
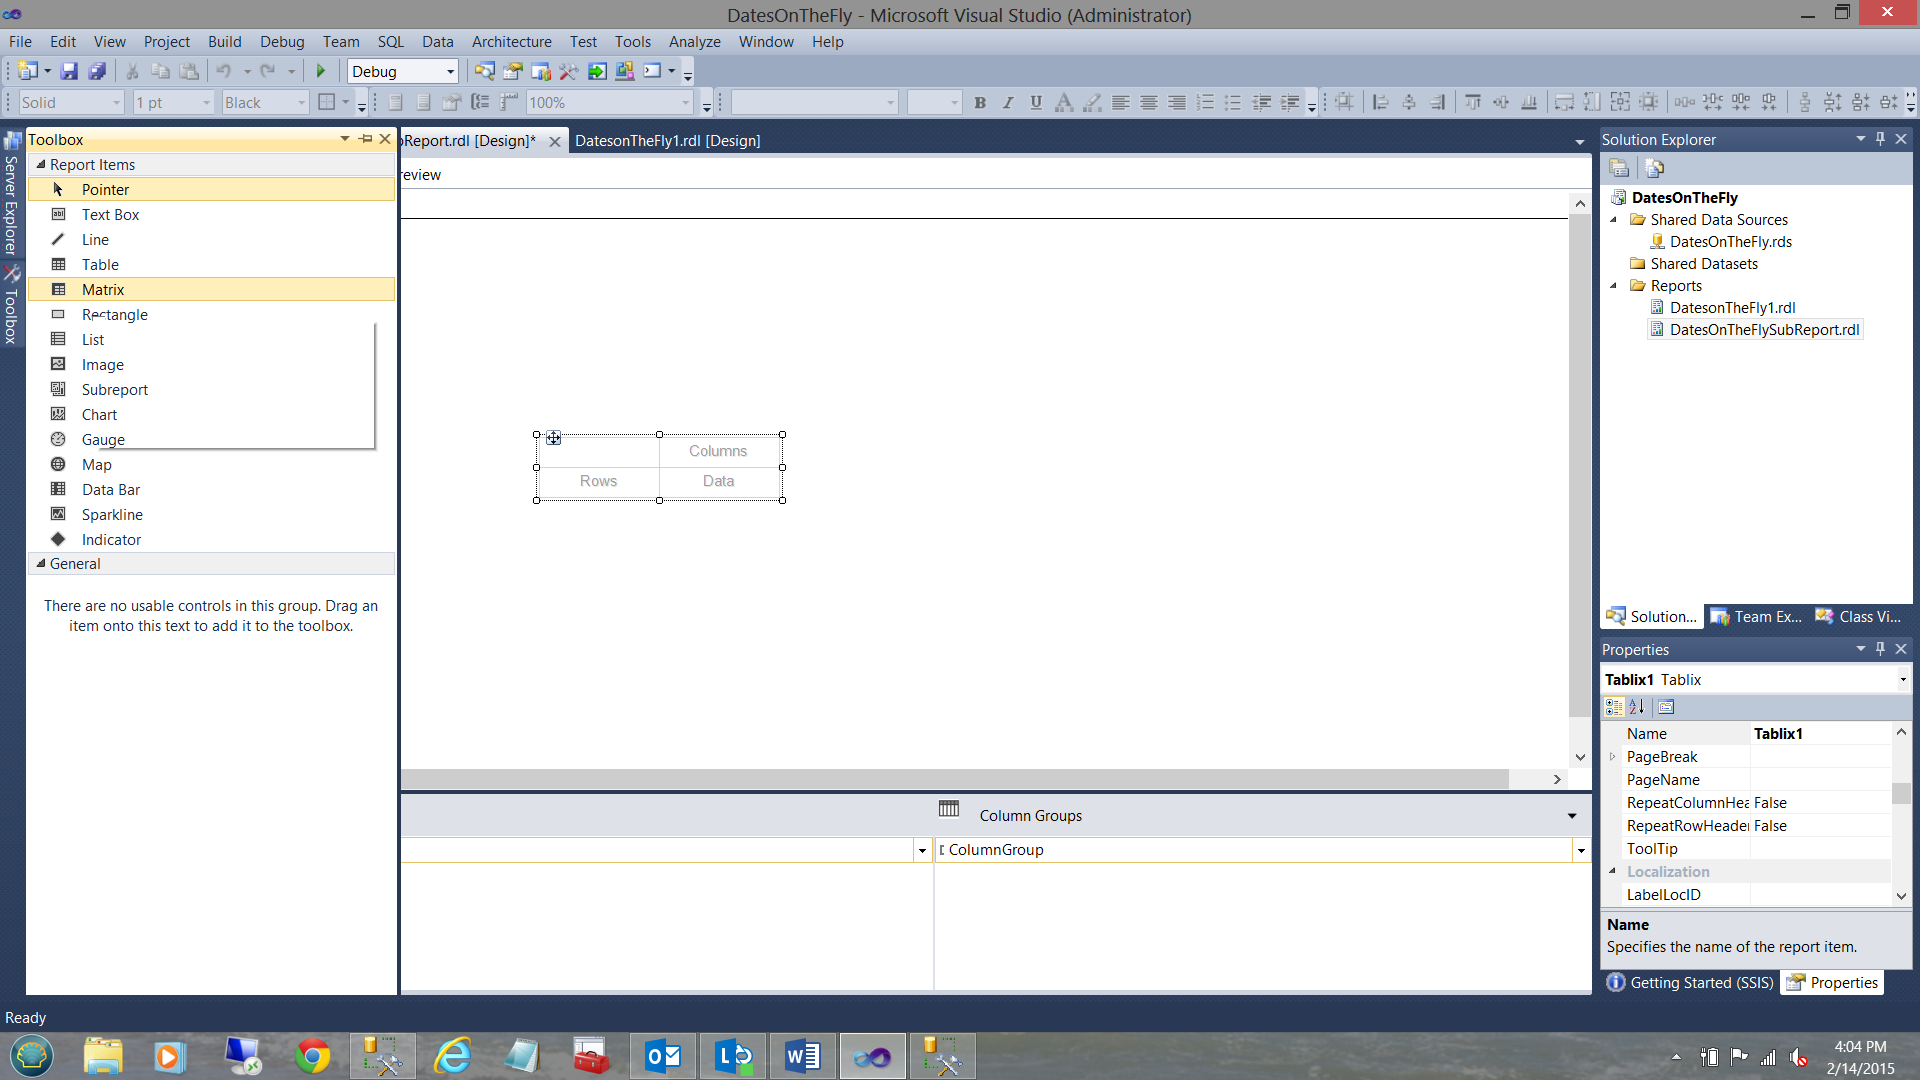
We add a “Matrix” report item from the tool box (see above).
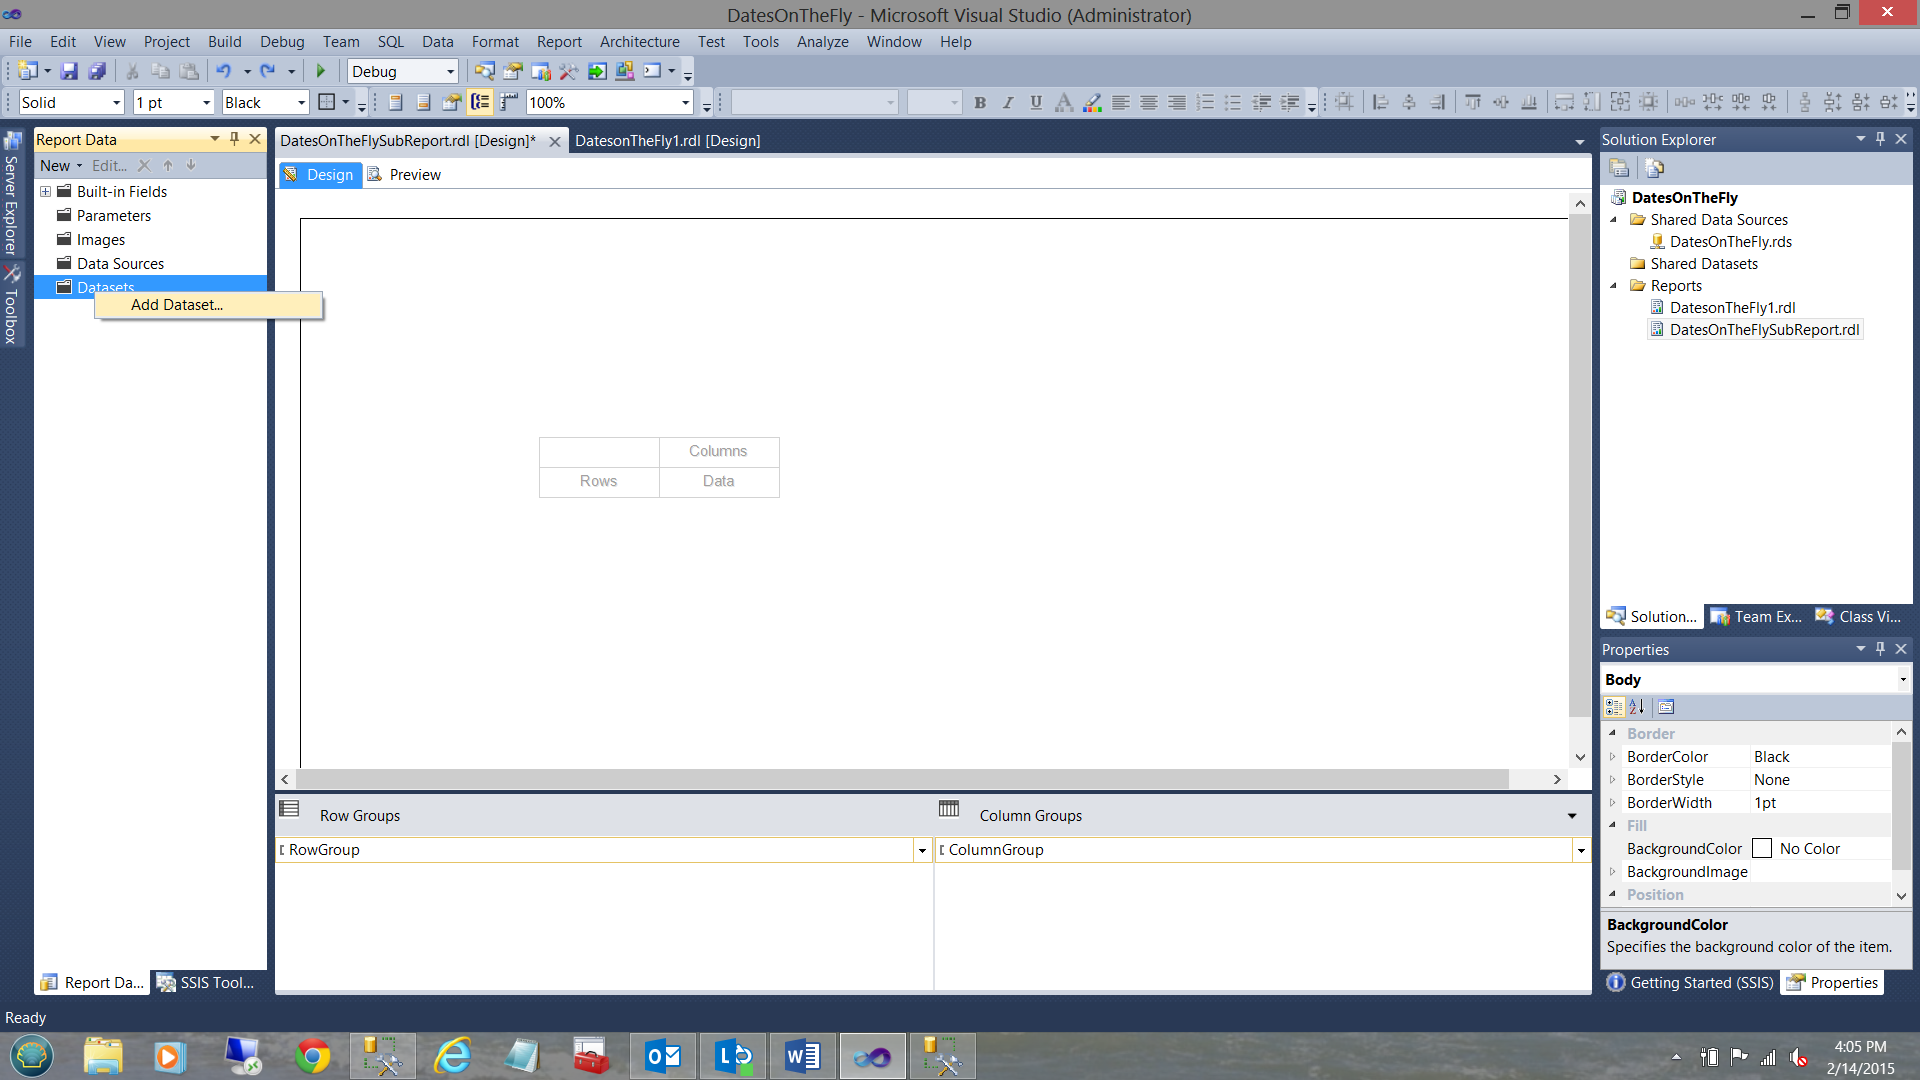
We now must create dataset. Should you be unfamiliar with the concept of “data sources” and “data sets” please do yourself a favour and have a look at my SQL Shack article entitled “Now you see it, now you don’t”.
By right-clicking on the “Dataset” folder, we bring up the context menu. We click “Add Dataset” (see above).
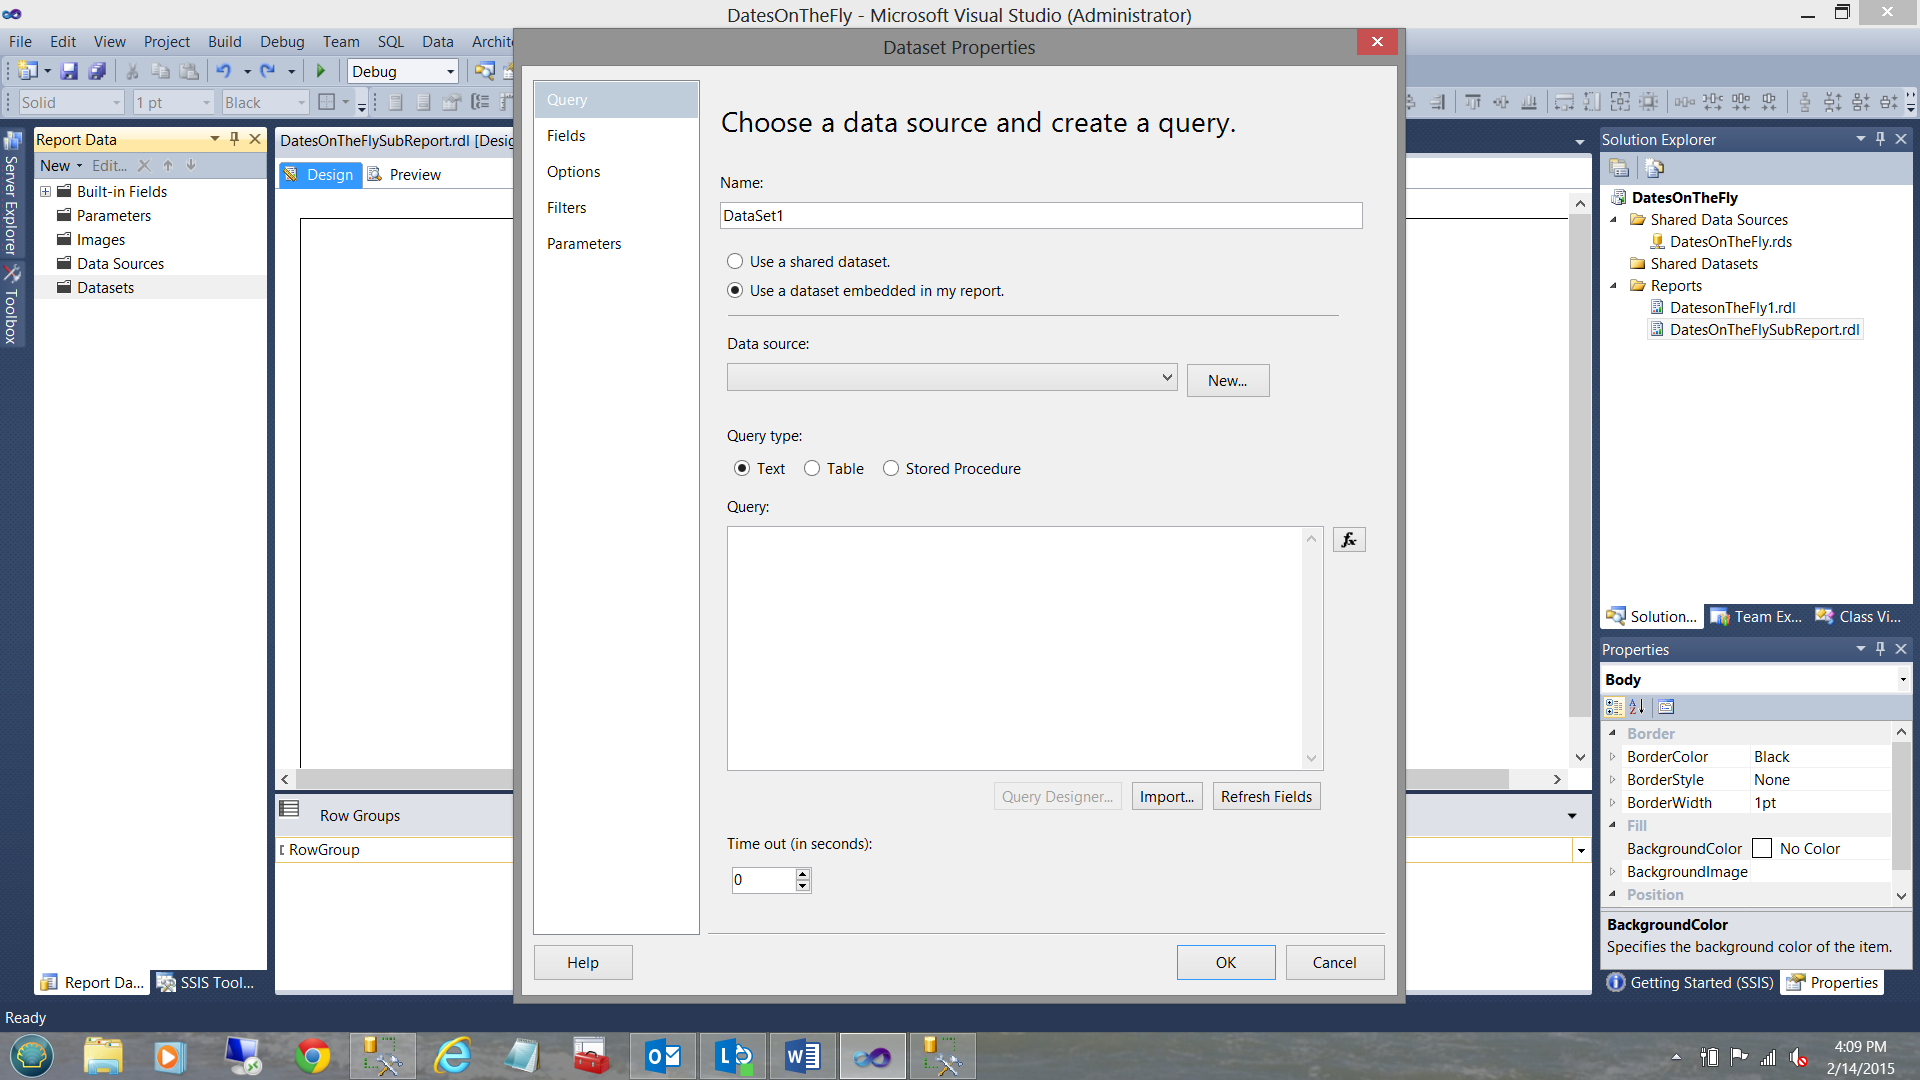
The “Dataset Properties” dialog box is brought up. We click the “Use a dataset embedded in my report” option. The thing that is still missing is a local or embedded data source. To create one, we click the “New” button (see above).

The “Data Source Properties” dialogue box is brought up (see above).
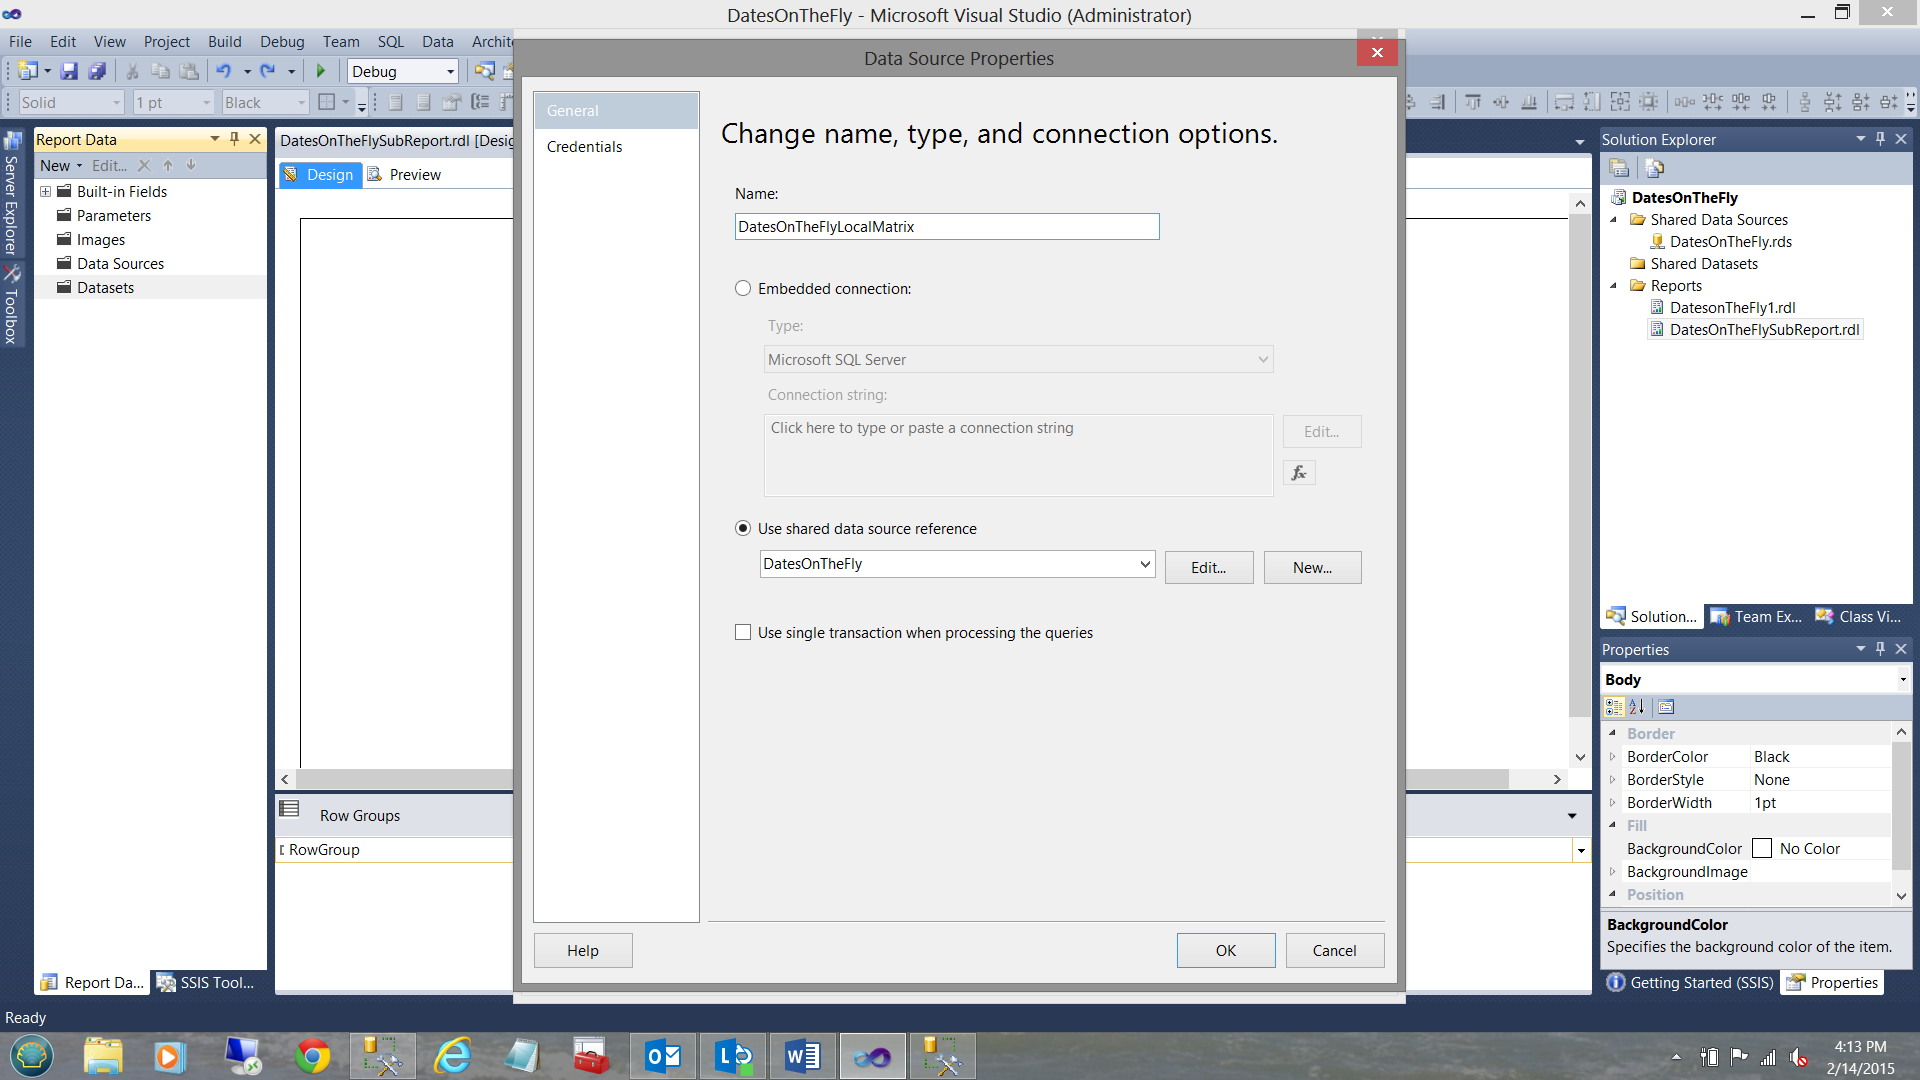
We give our local data source a name “DatesOnTheFlyMatrix” and link it to the “DatesOnTheFly” shared data source which was created at our last “get together”. We click OK to create this local data source.
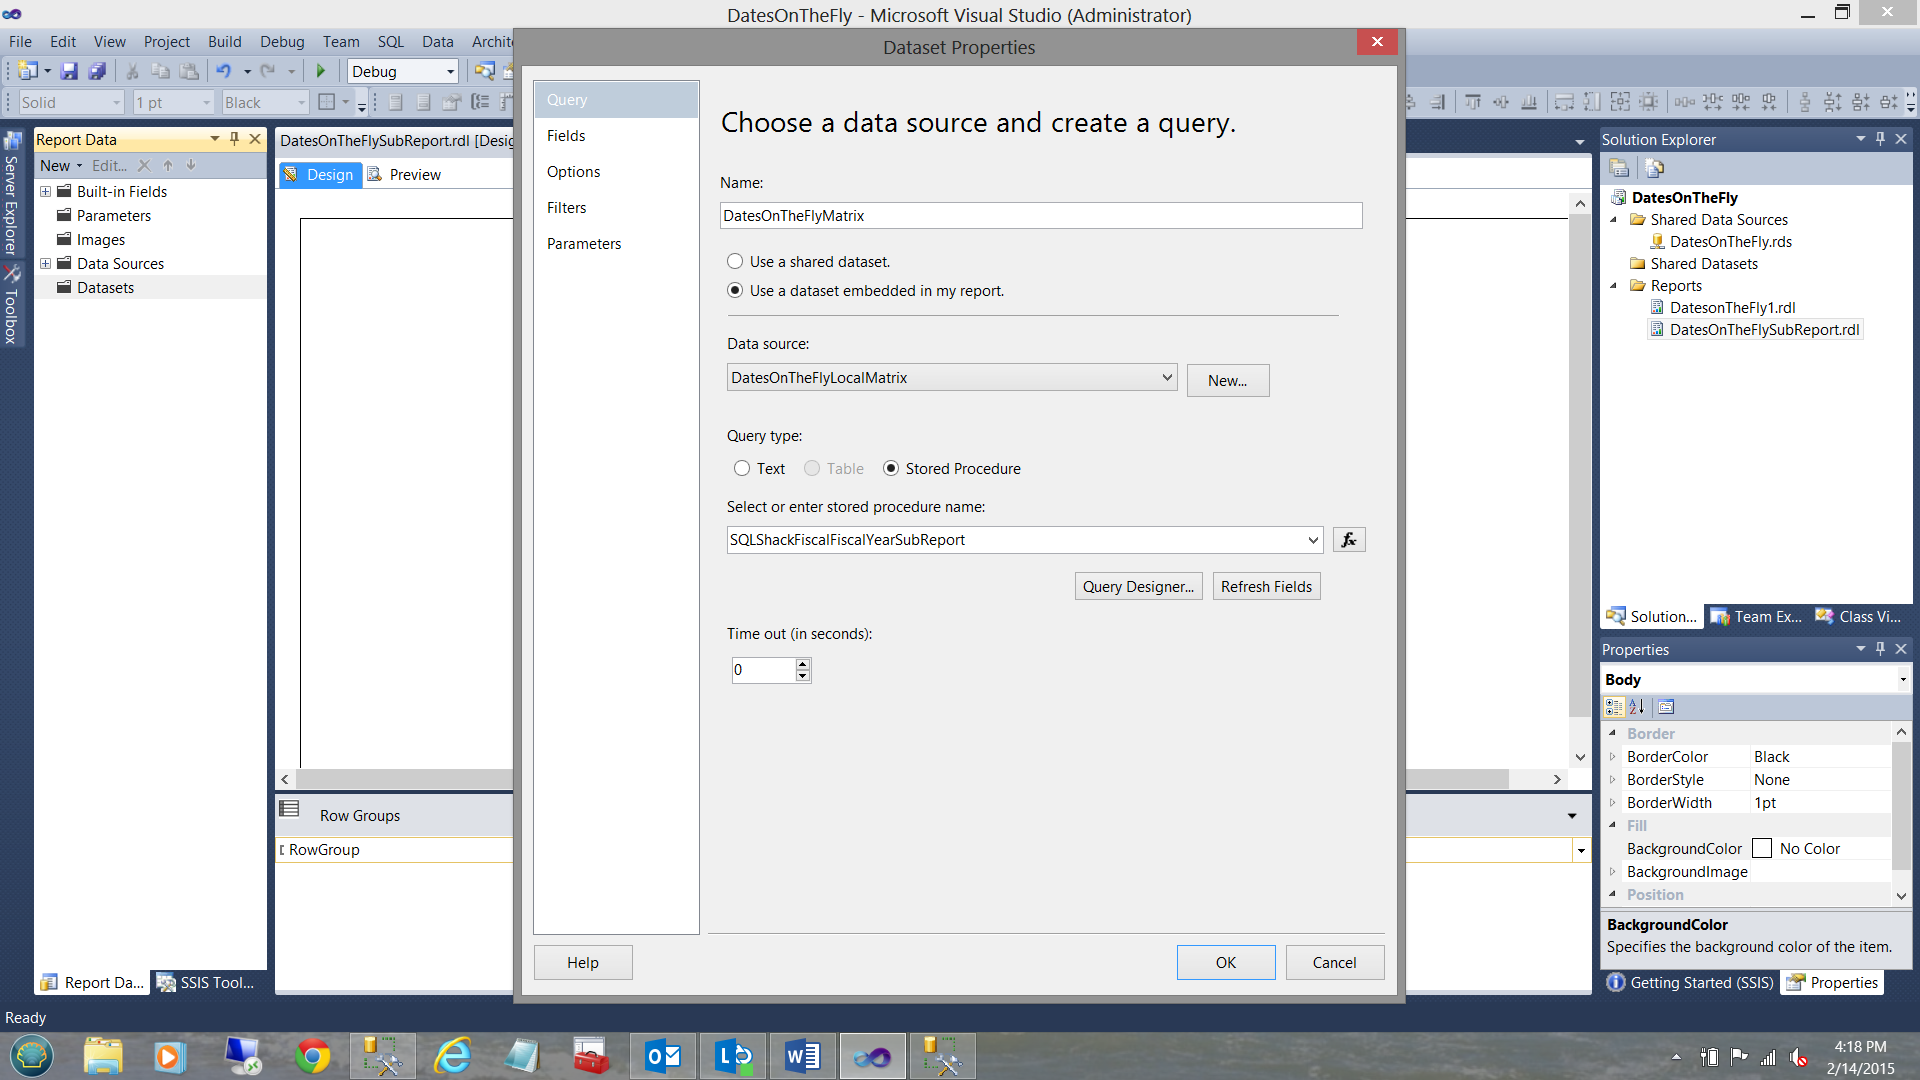
We are brought back to the “Dataset Properties” page. We give our dataset a name “DatesOnTheFlyMatrix”. We also select the “SQLShackFiscalFiscalYearSubReport” stored procedure to pull our data from the table to the report.
Clicking on the “Fields” tab (see below and to the left) we see the fields that will be pulled.
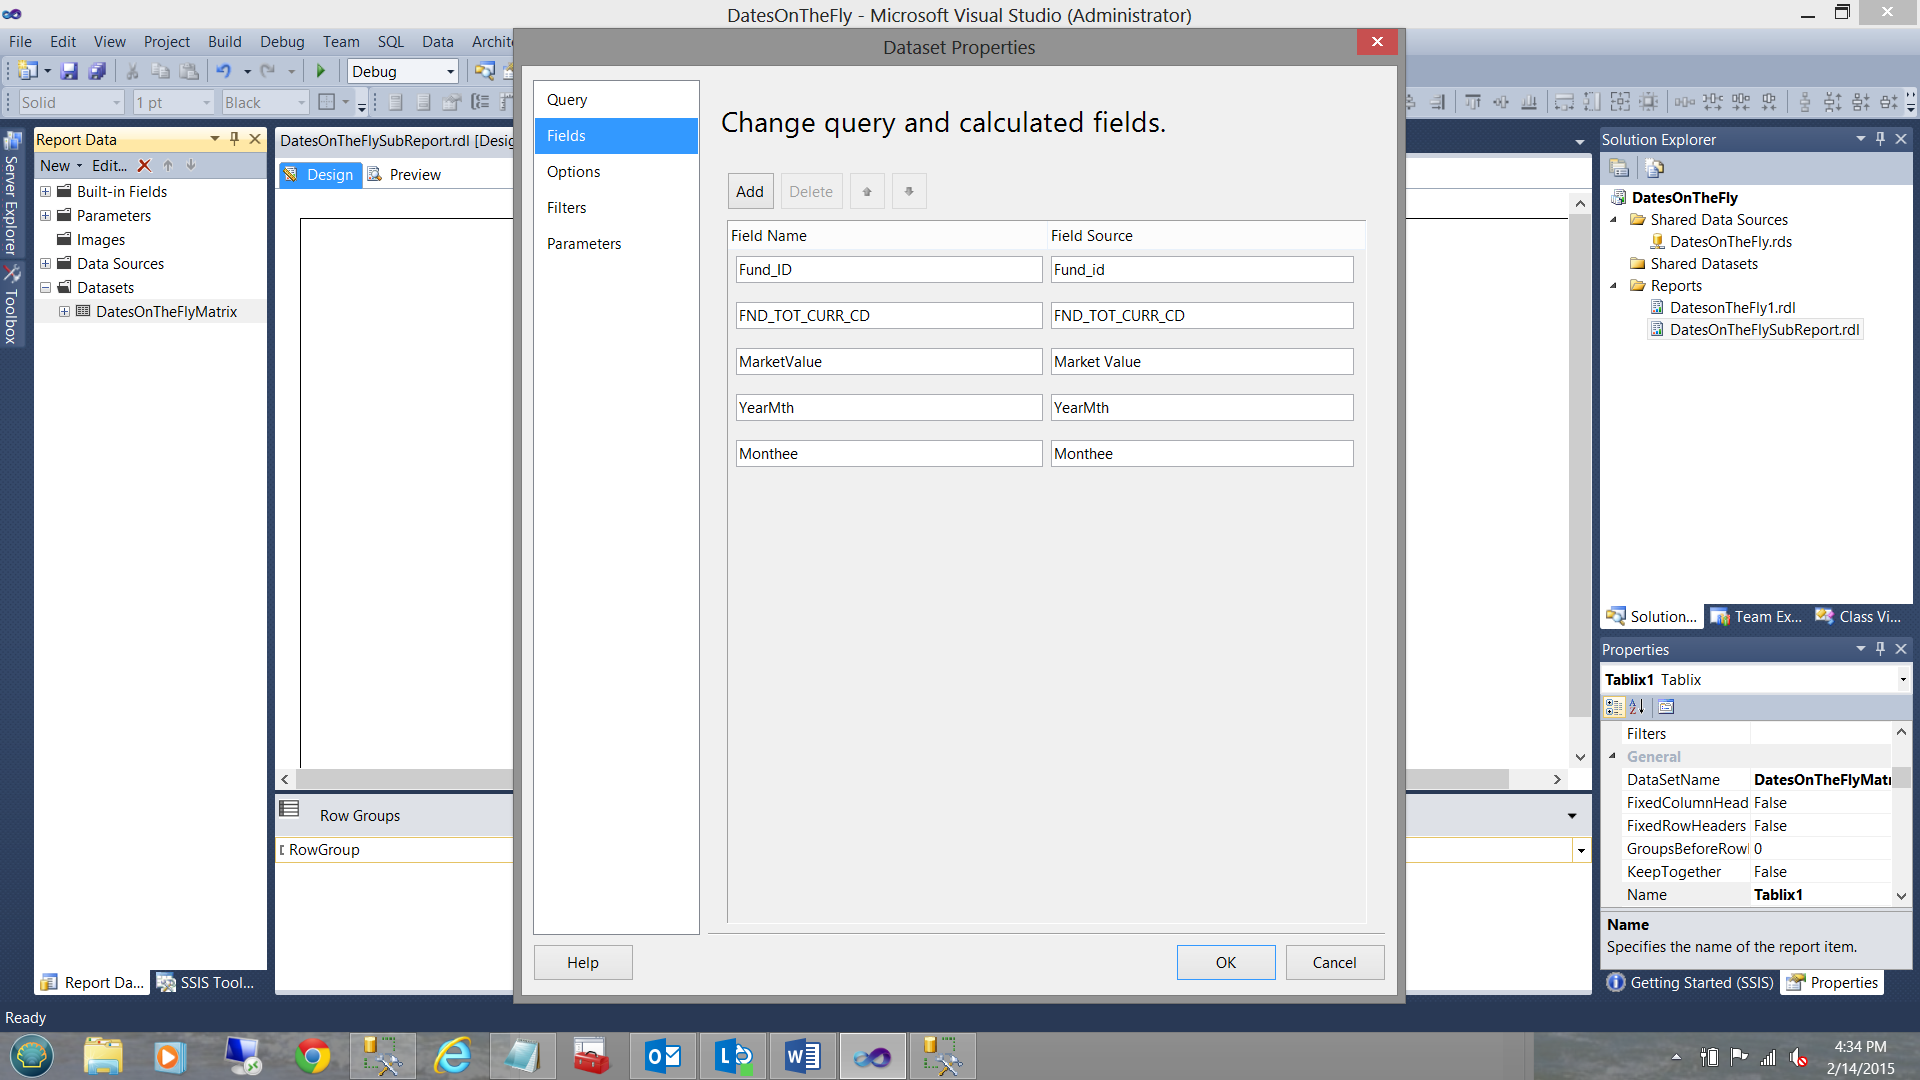
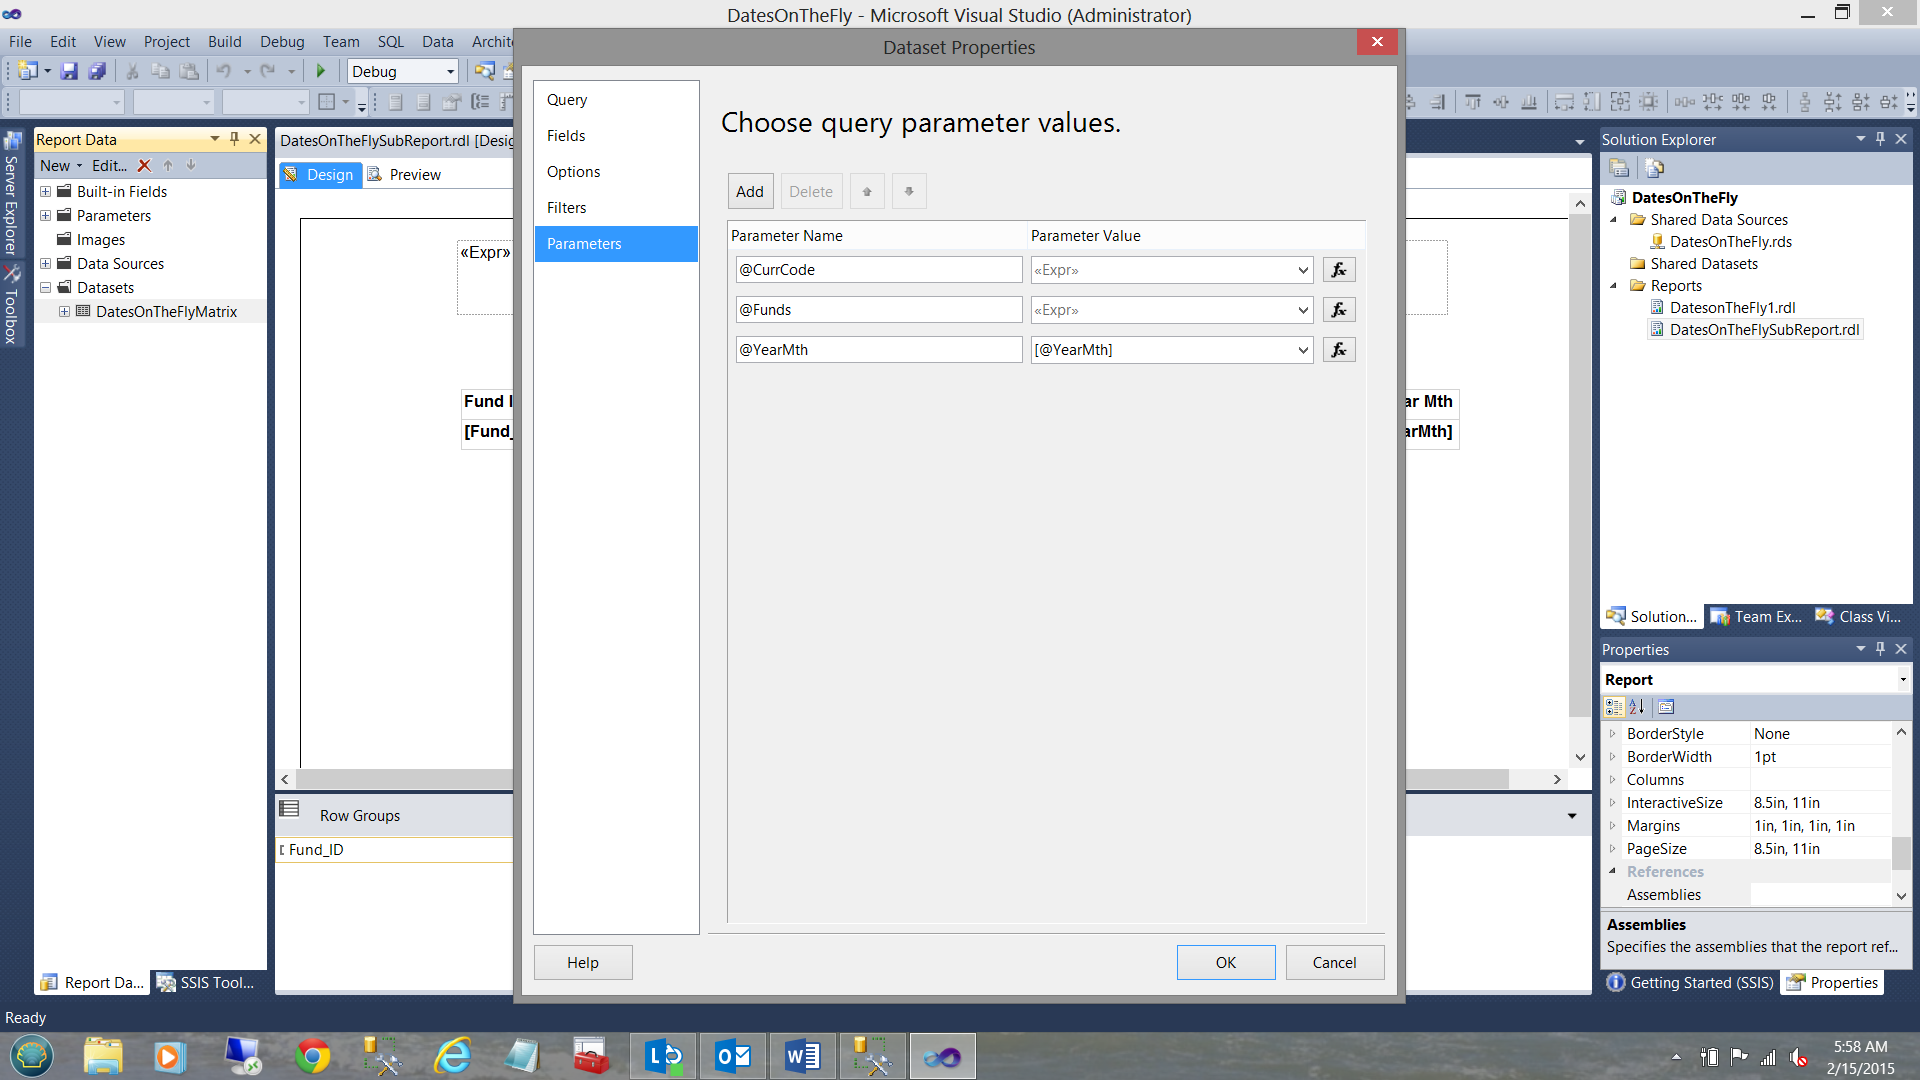
This looks fine. Our last task is to configure our parameters.
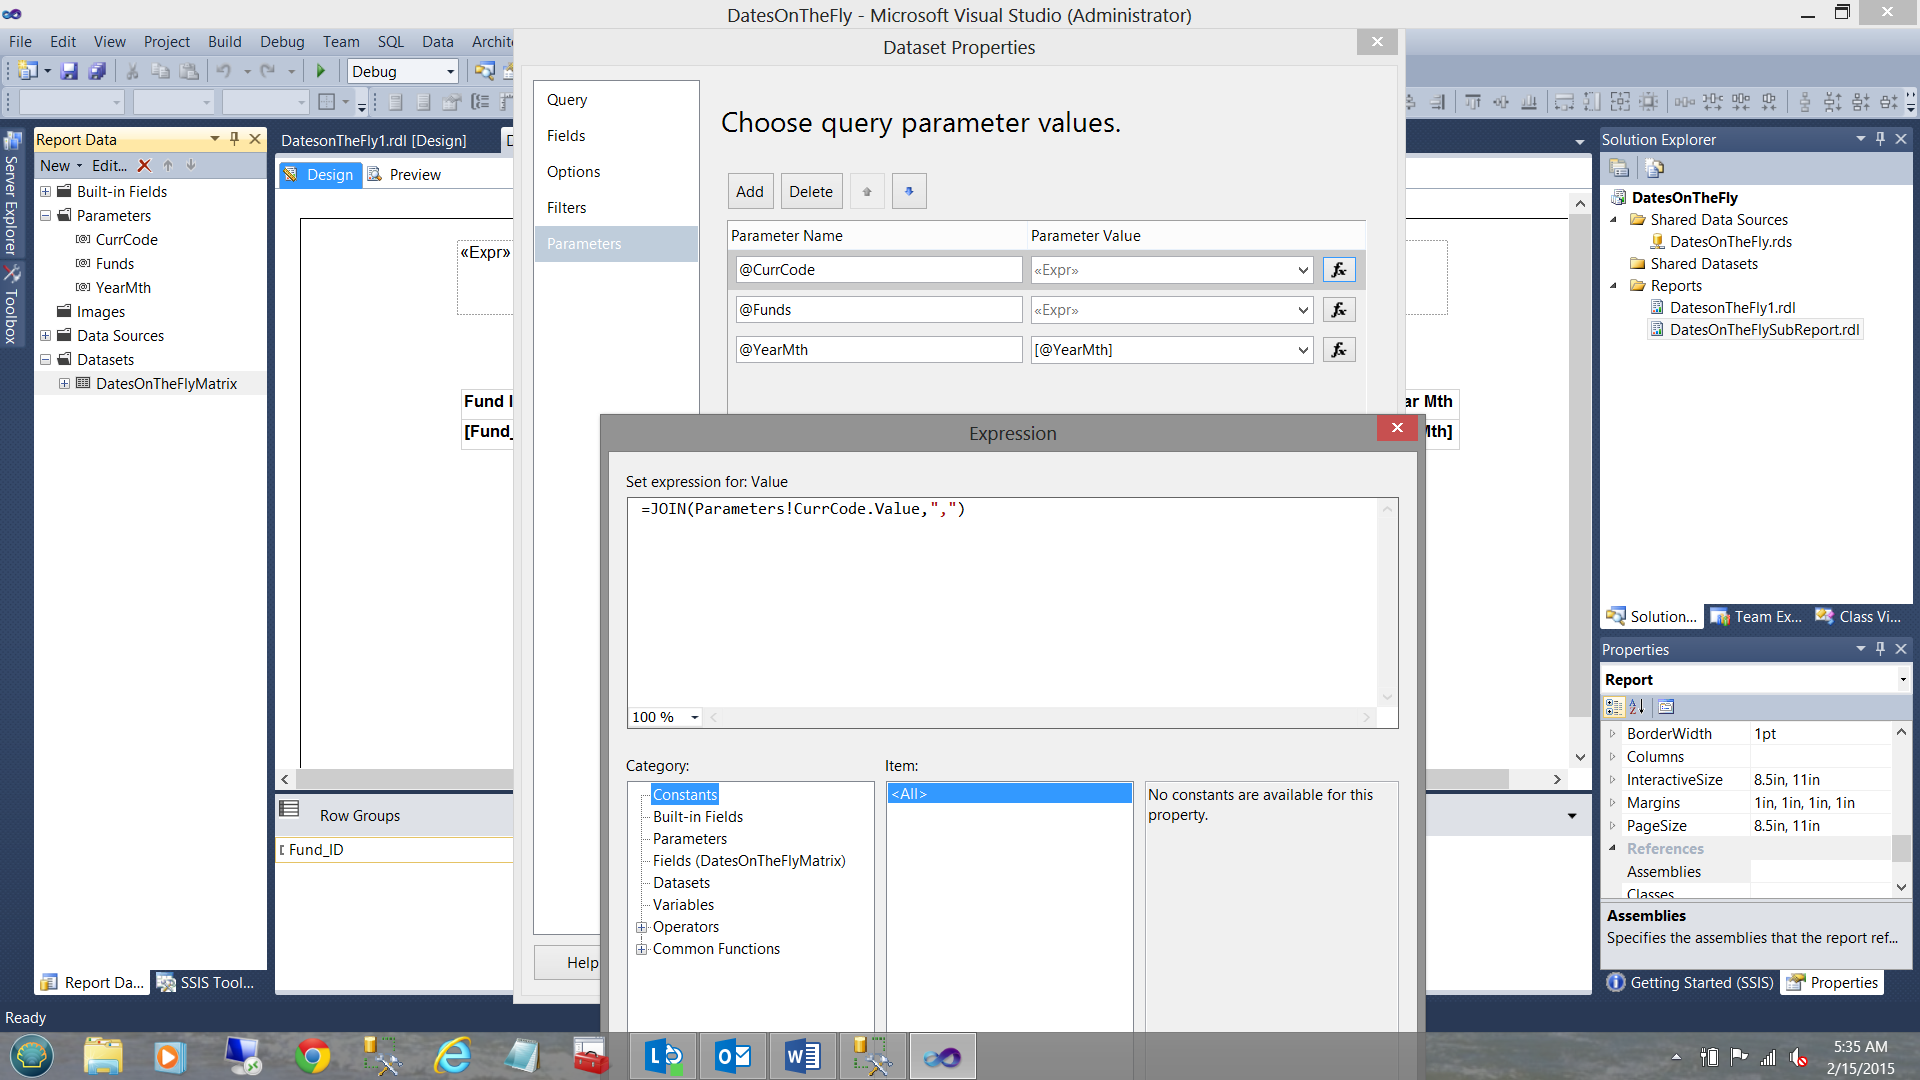
As we recall from our previous discussion, as the currency codes and funds have been configured for multi-select, we cannot utilize the normal “=Parameters!CurrCode.Value” declaration. If we recall correctly, what is passed to the stored procedure is a comma delimited string.
This implies that we must once again utilize “=JOIN(Parameters!CurrCode.Value,",")” (see above).
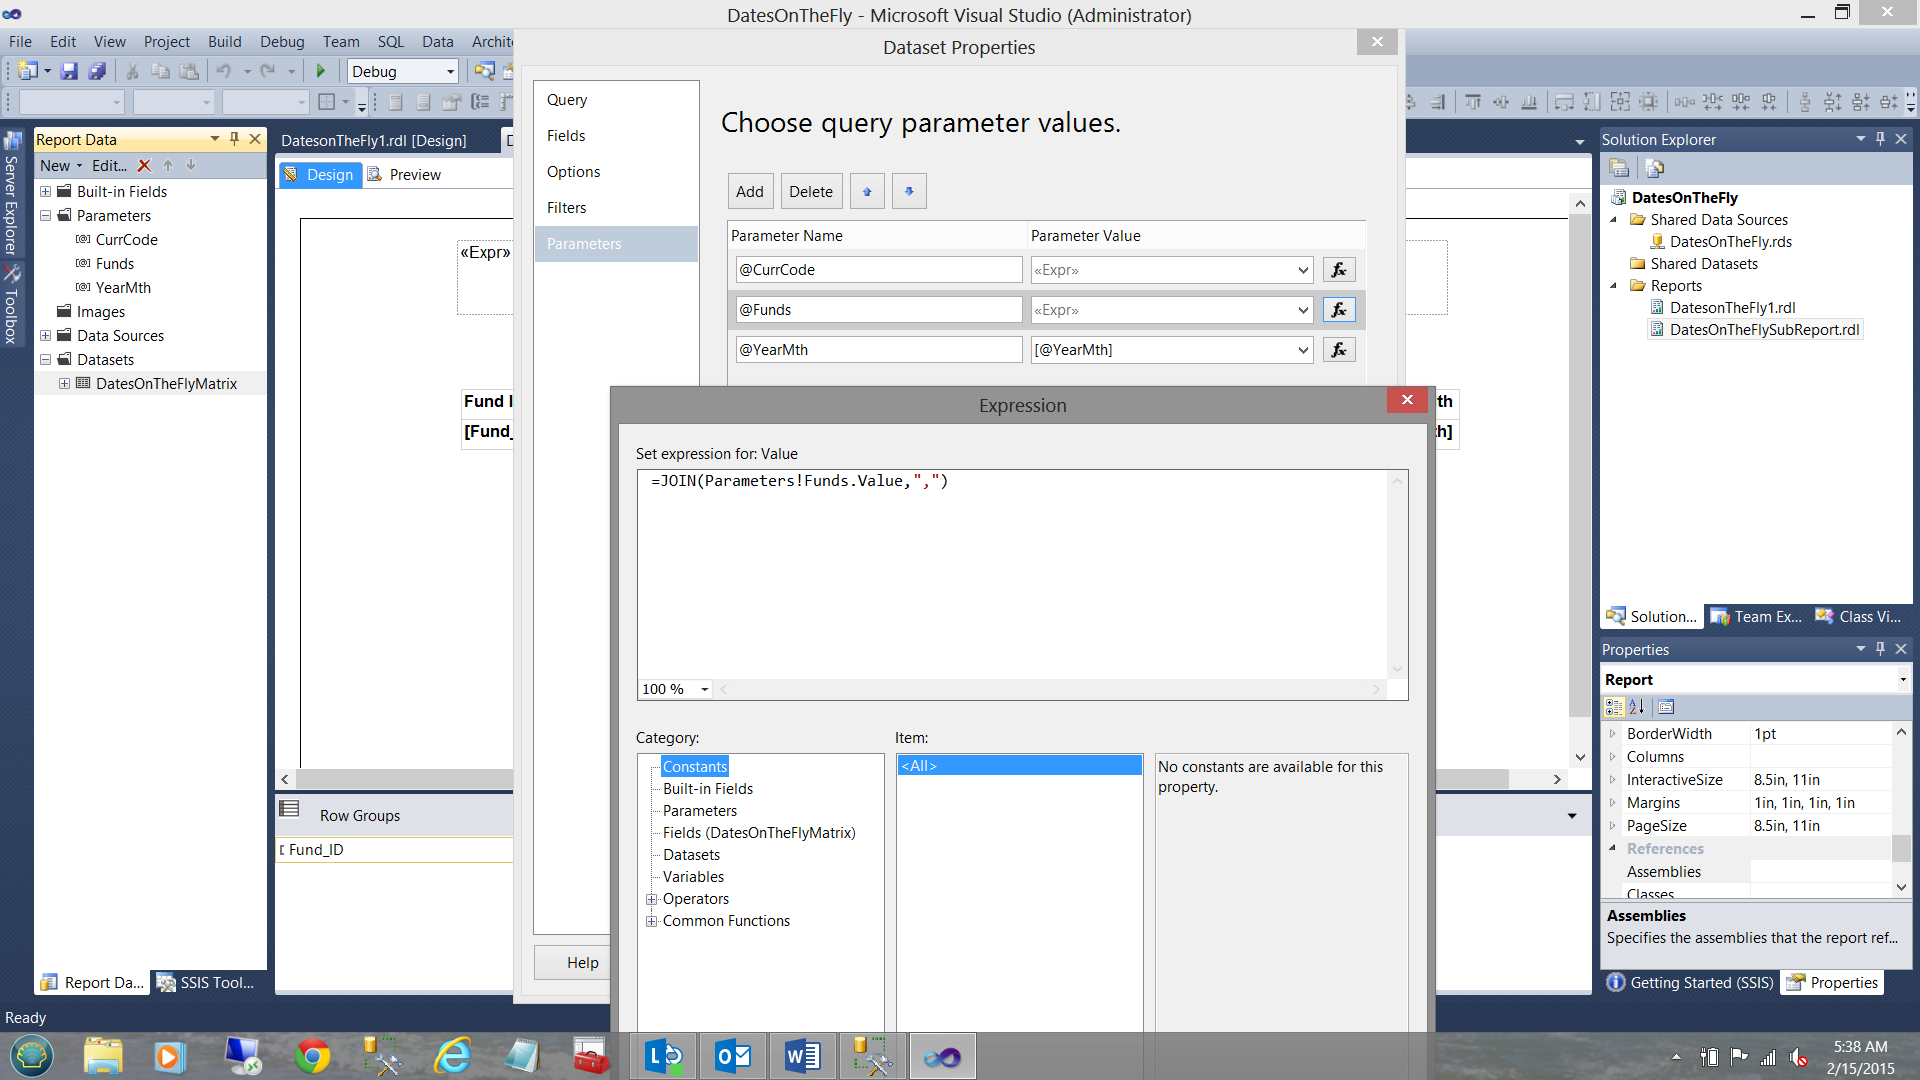
We do the same for the fund list (see below).
The remaining Parameter “YearMth” may remain as is for the sole reason that only one particular value of “YearMth” is being passed to the stored procedure.

We click OK to leave the “Dataset Properties” dialog box and find ourselves (once again) on our drawing surface.
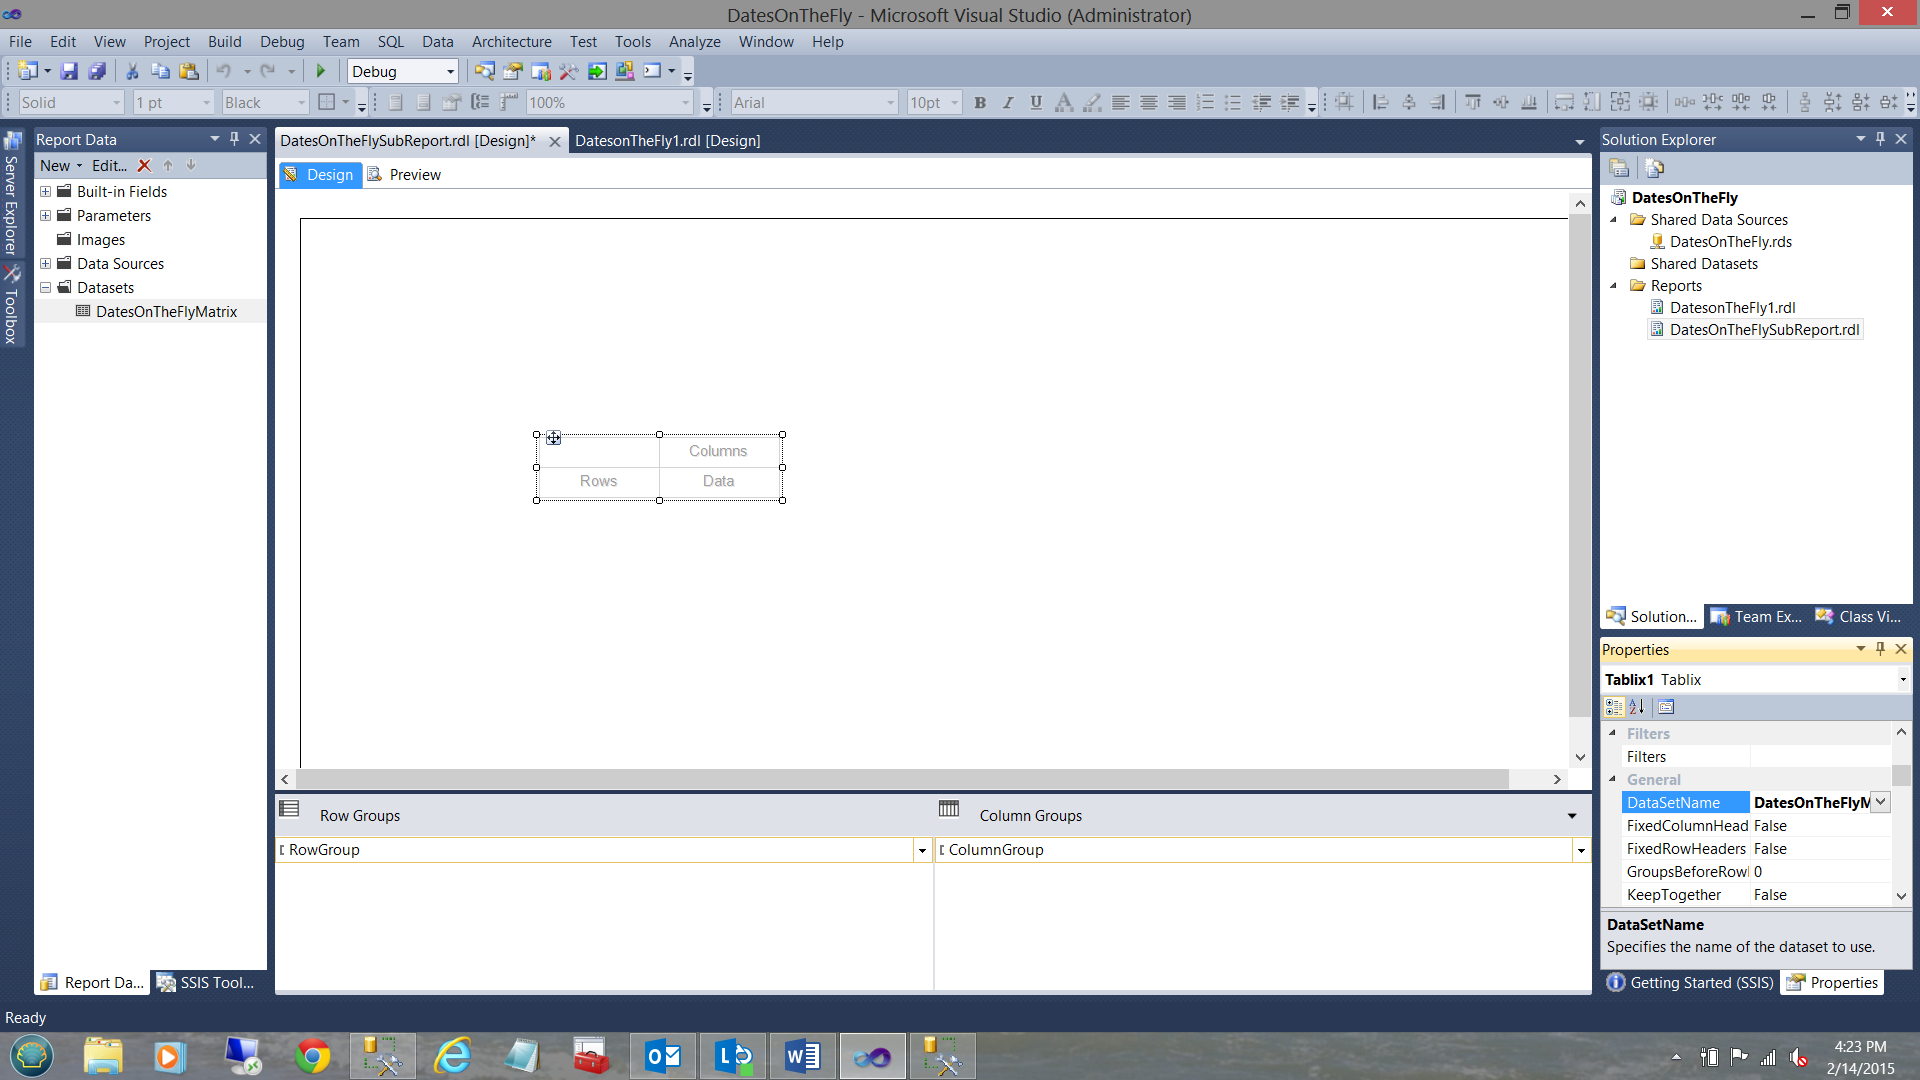
This achieved, we now link the dataset (that we just created) to the “DataSetName” property of the Matrix (see above and to the bottom right).
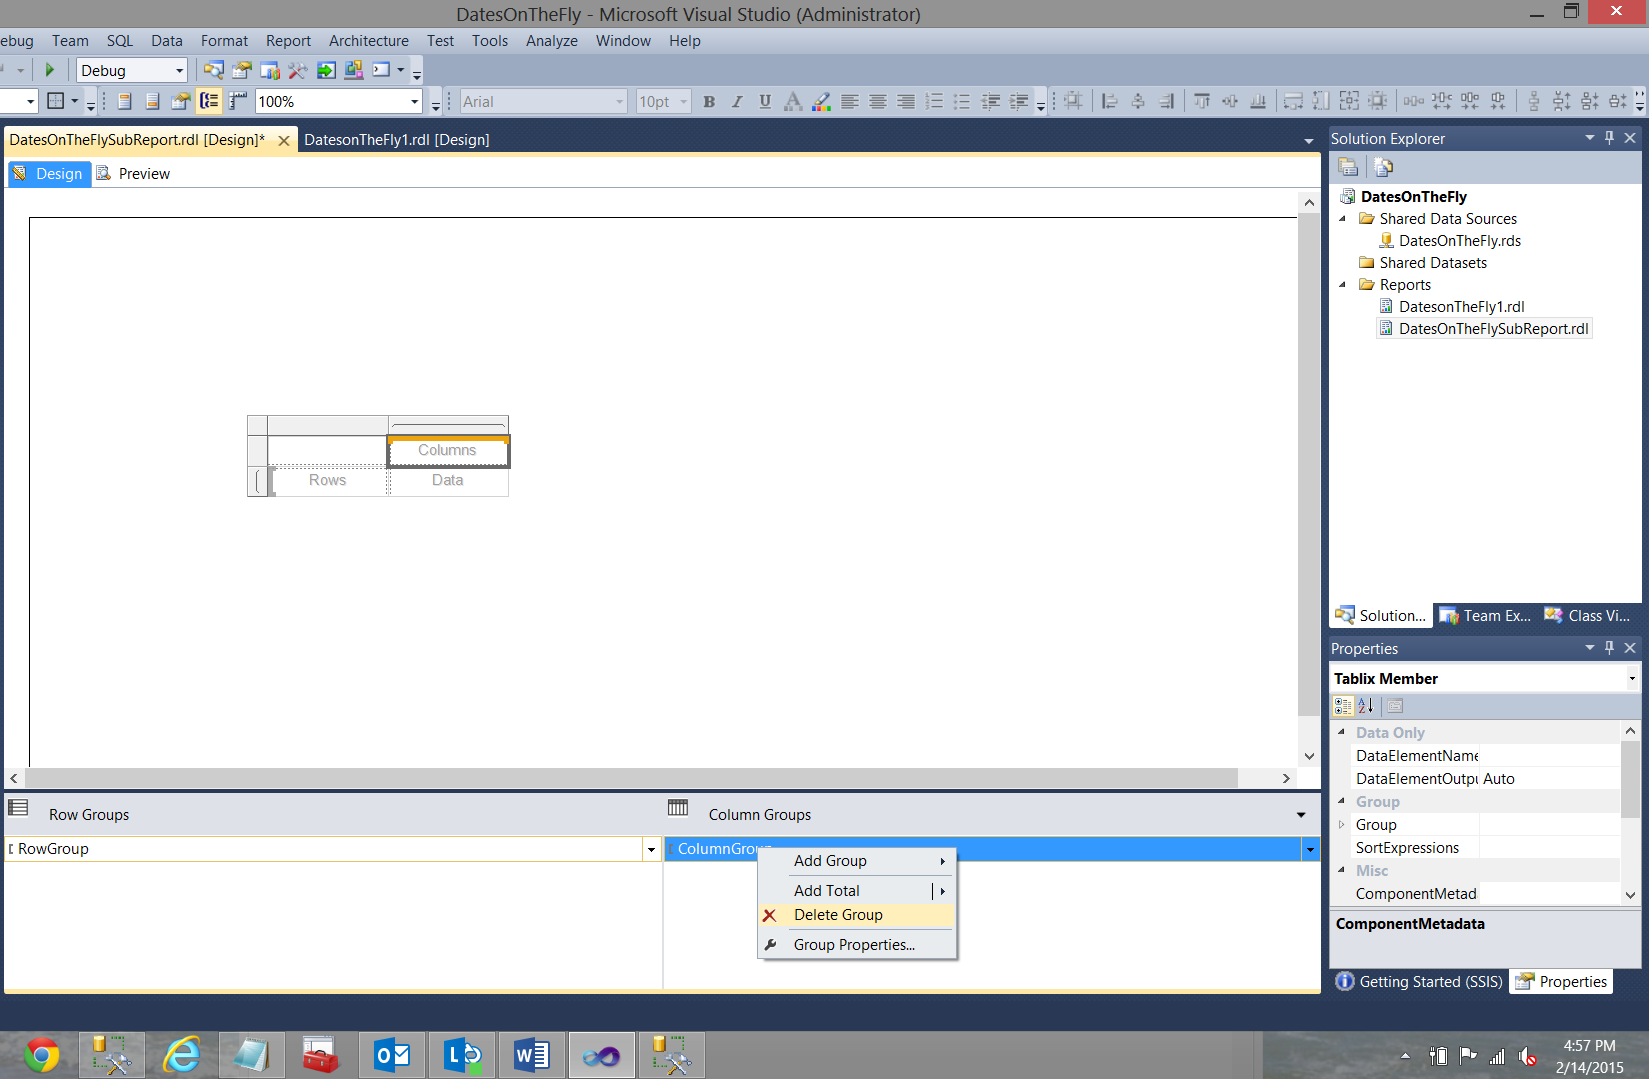
As we do not require the “ColumnGroups” we are going to delete them. We right-click on the “ColumnGroups” and from the context menu, we select “Delete Group”.
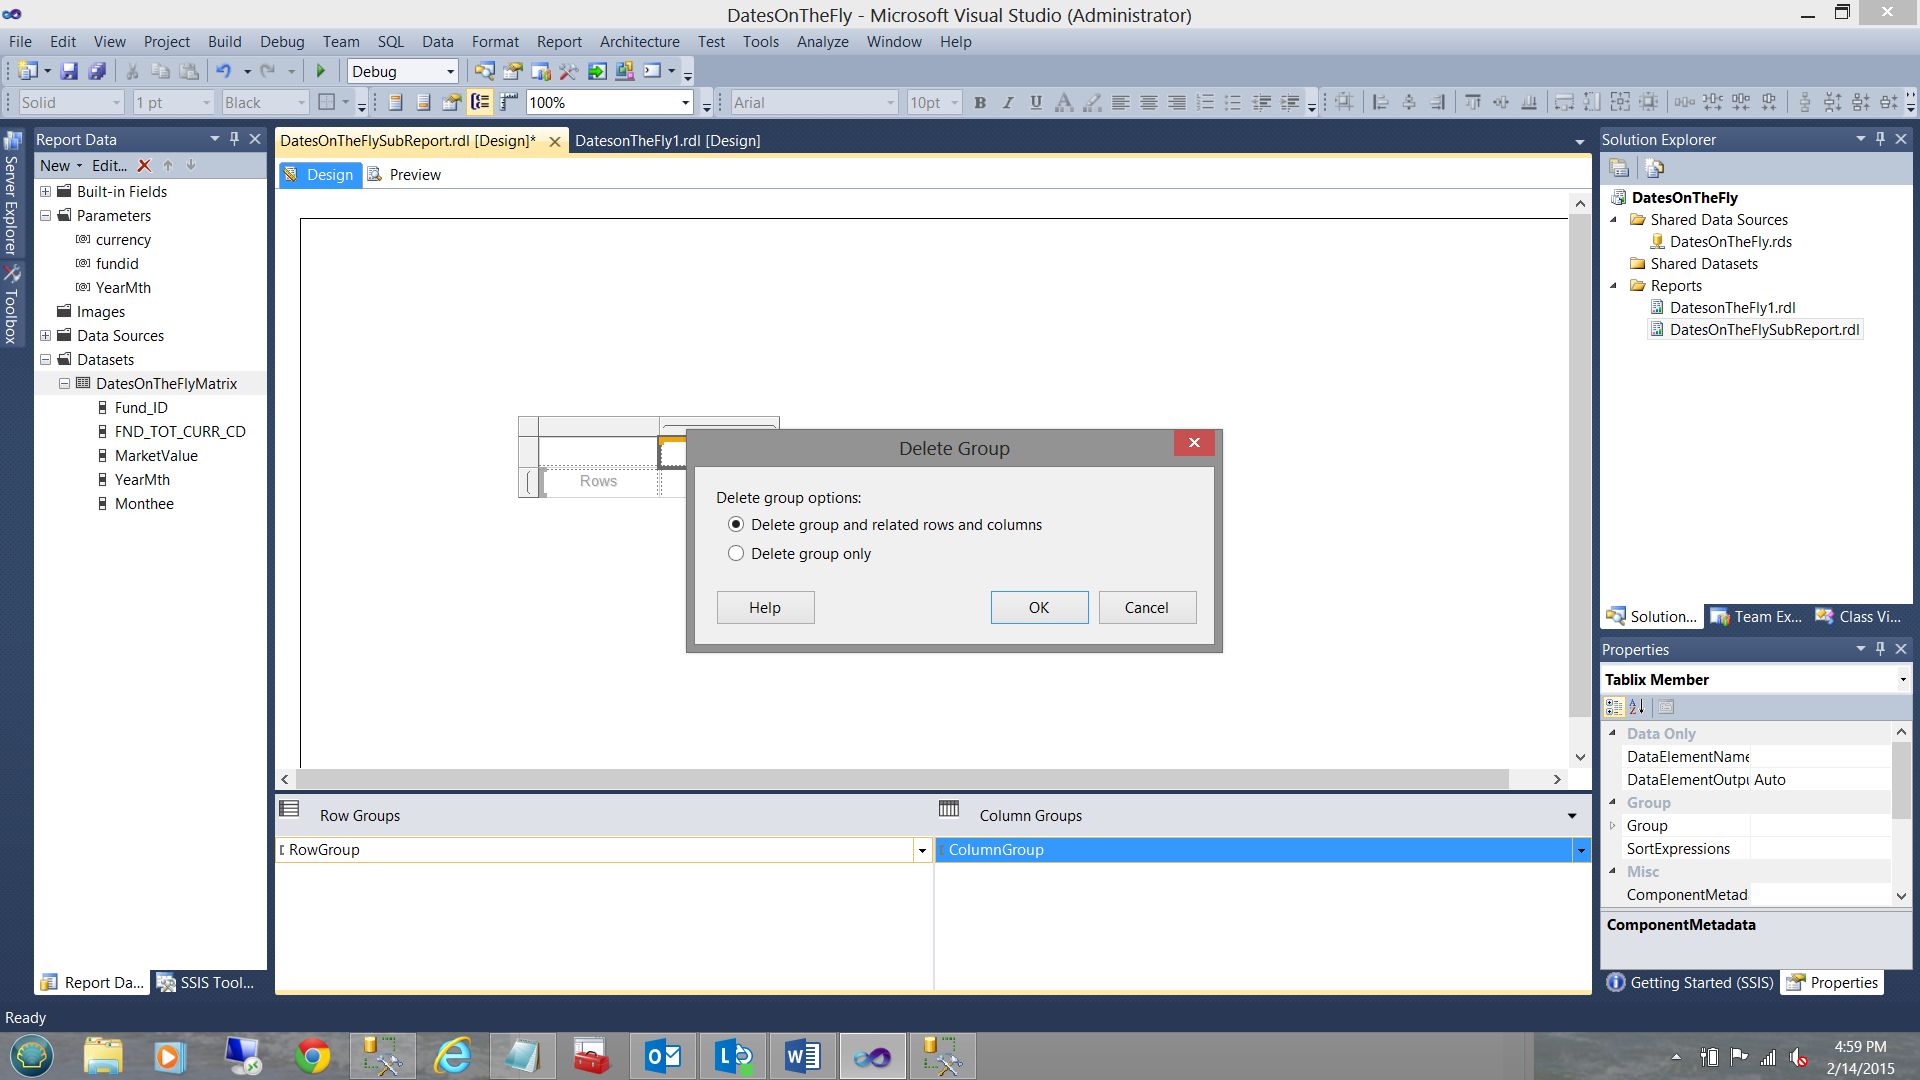
We are asked if we wish to “Delete group and related row and columns” OR “Delete group only”. We select “Delete group only”.
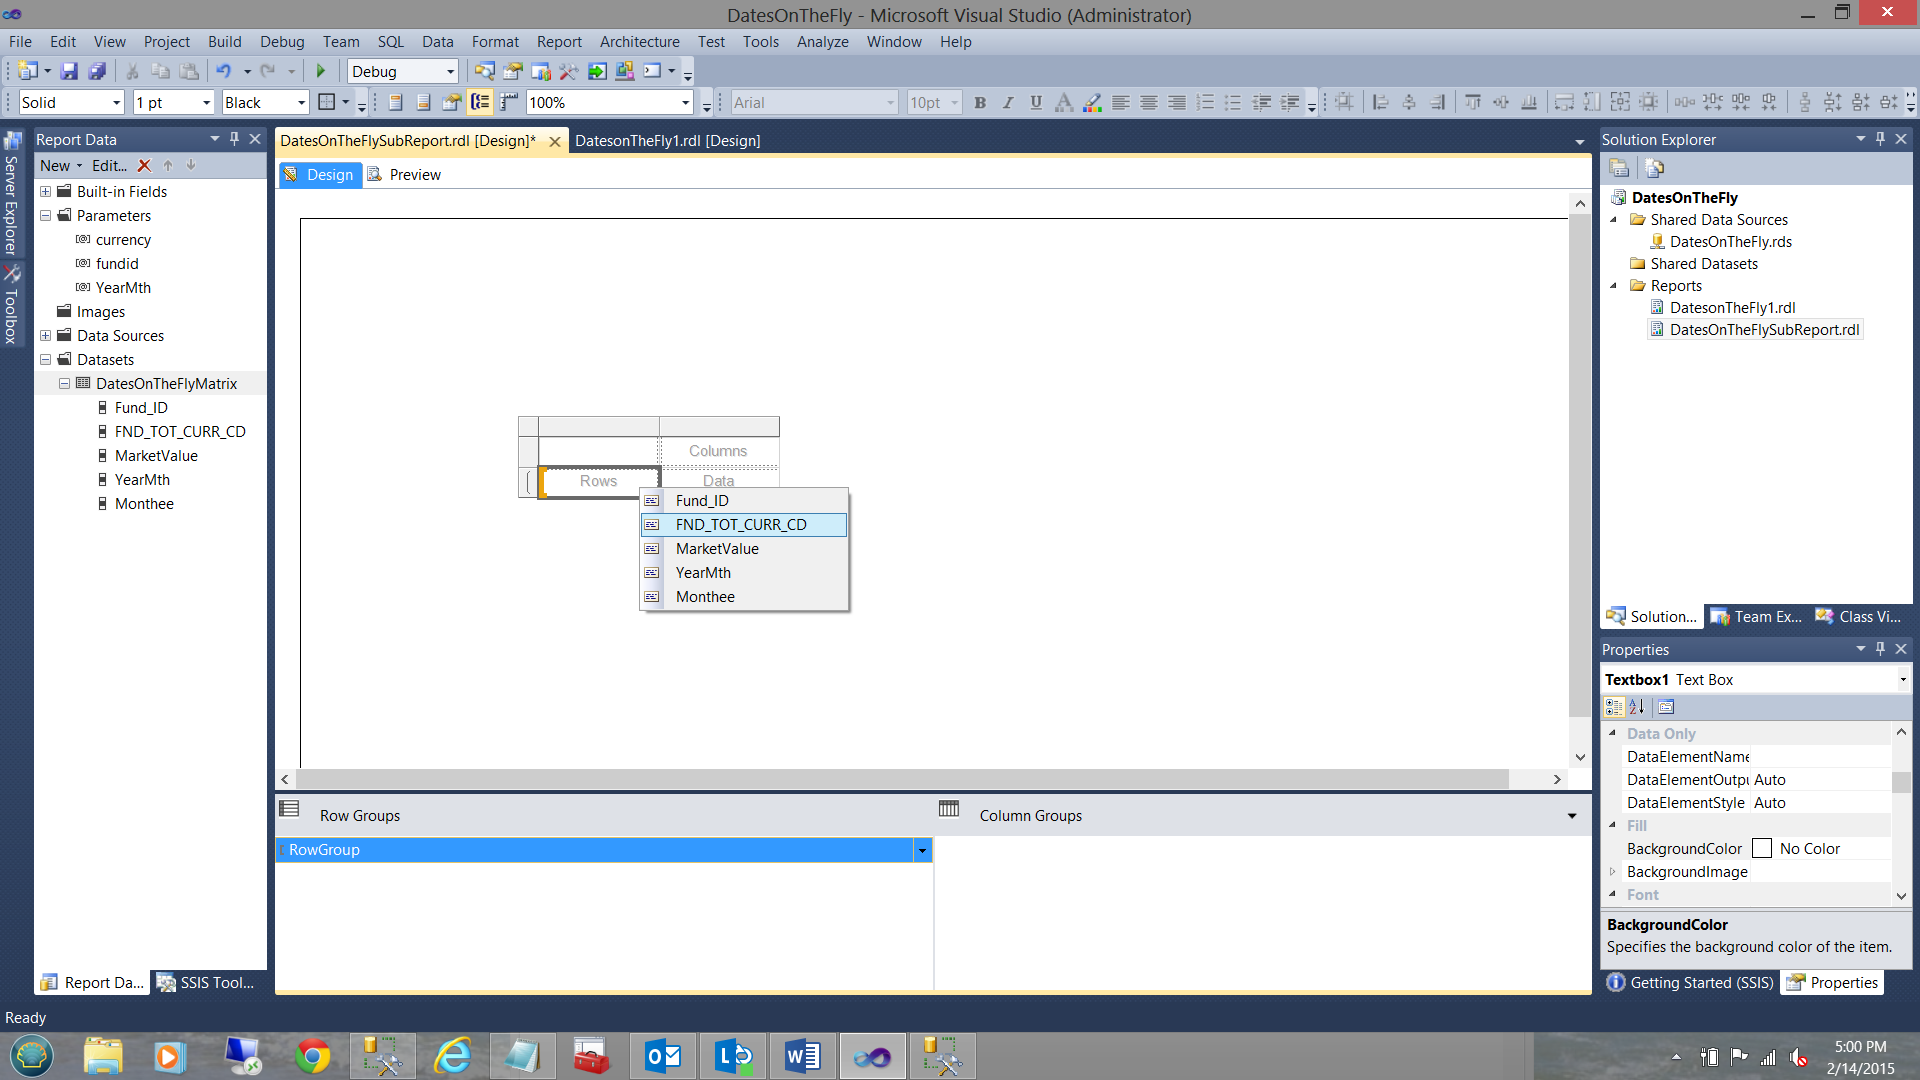
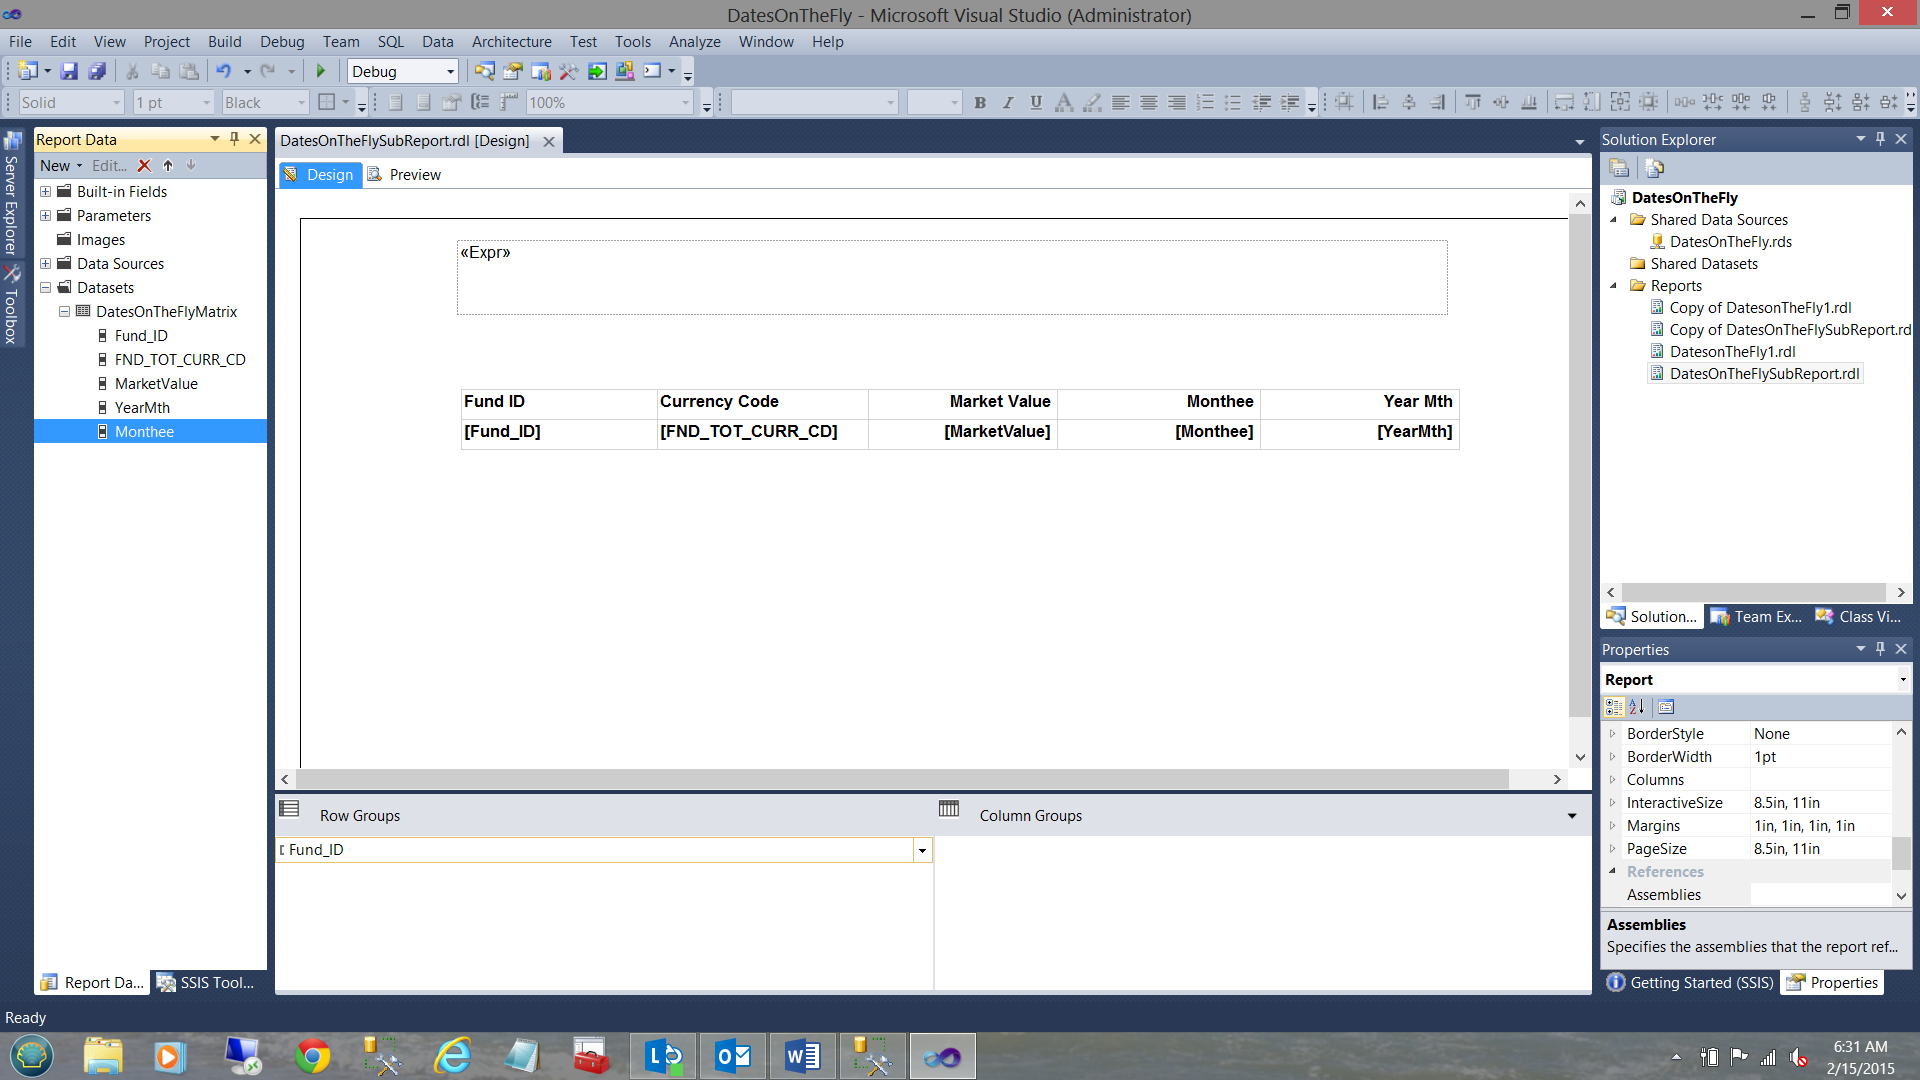
Clicking on the matrix we are able to bring up our list of fields (5 in total see above).
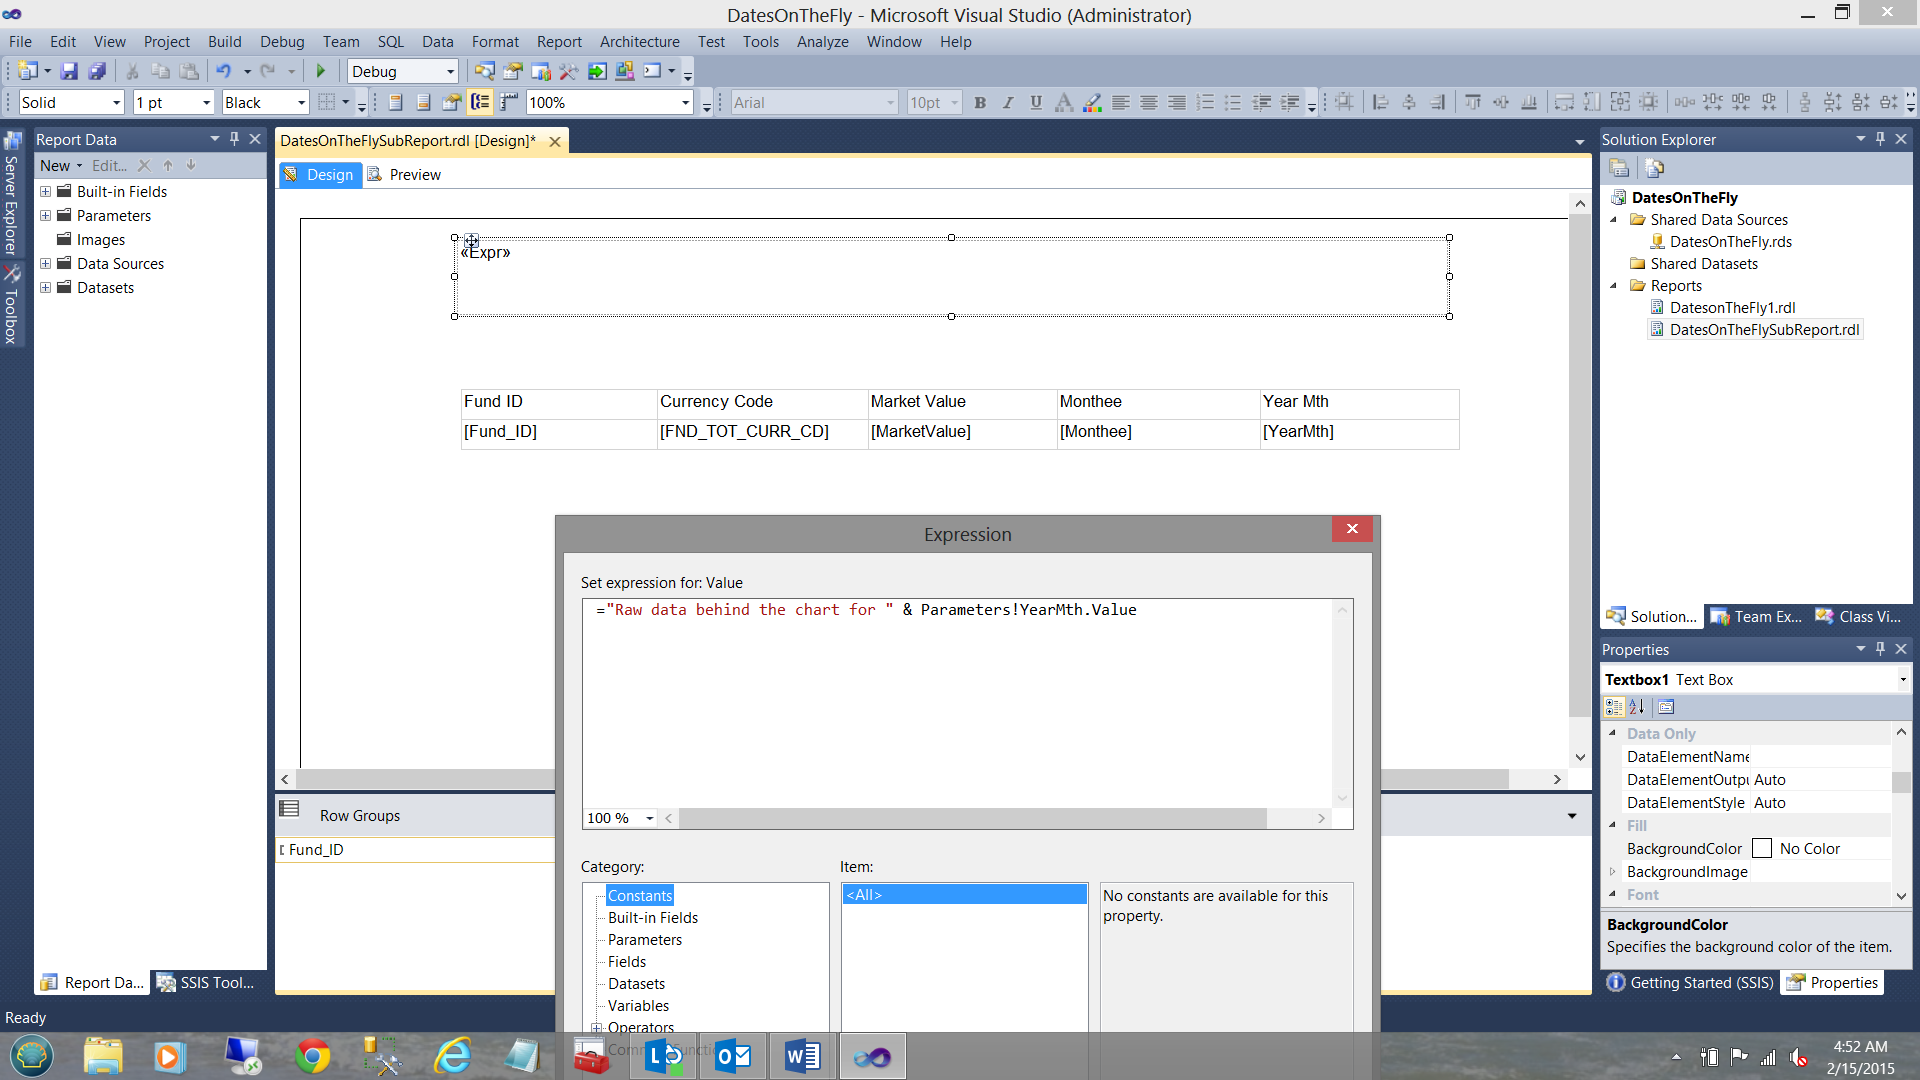
As the reader will note, each of the five fields has its own column. We have also placed a text box on the top of our report to inform the user that this is the raw data behind the chart for the given “YearMth” (see above).
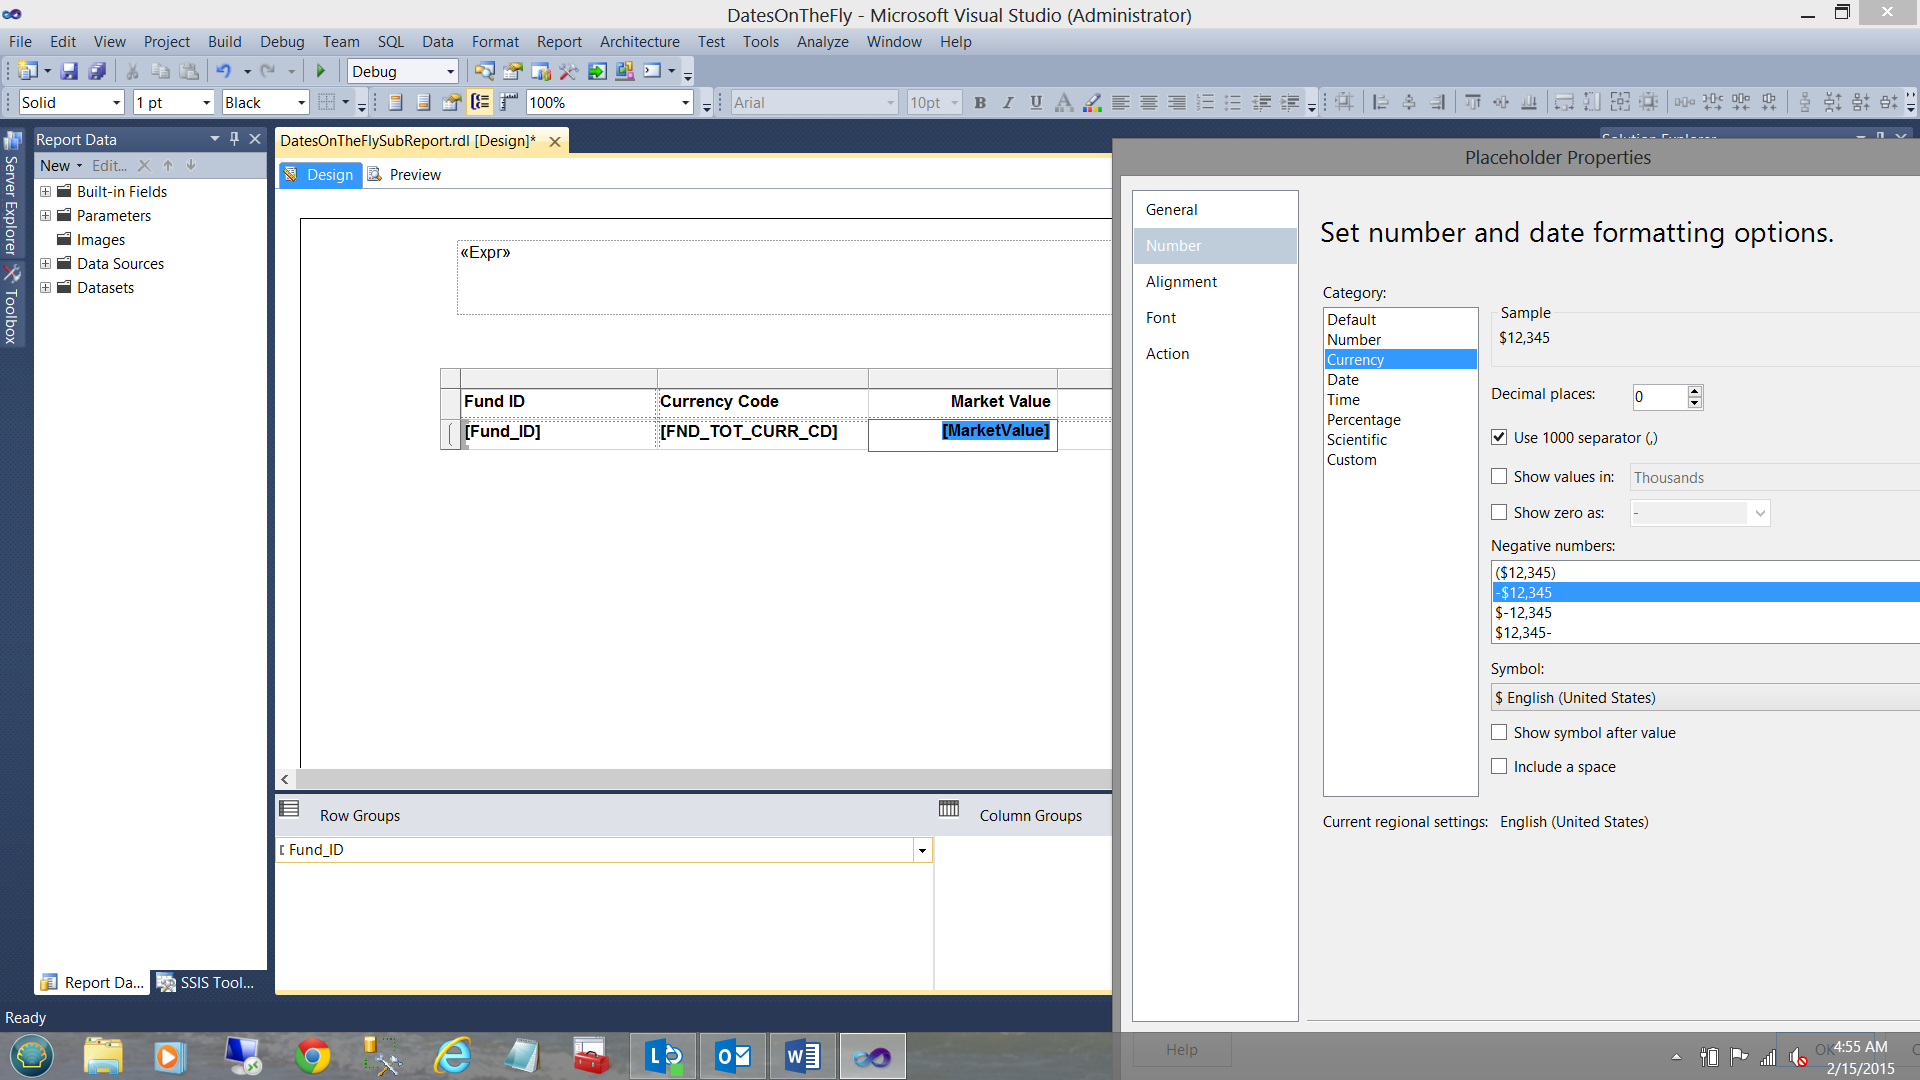
Further, we have formatted the “Market Value” field, right-oriented the figures (see above).
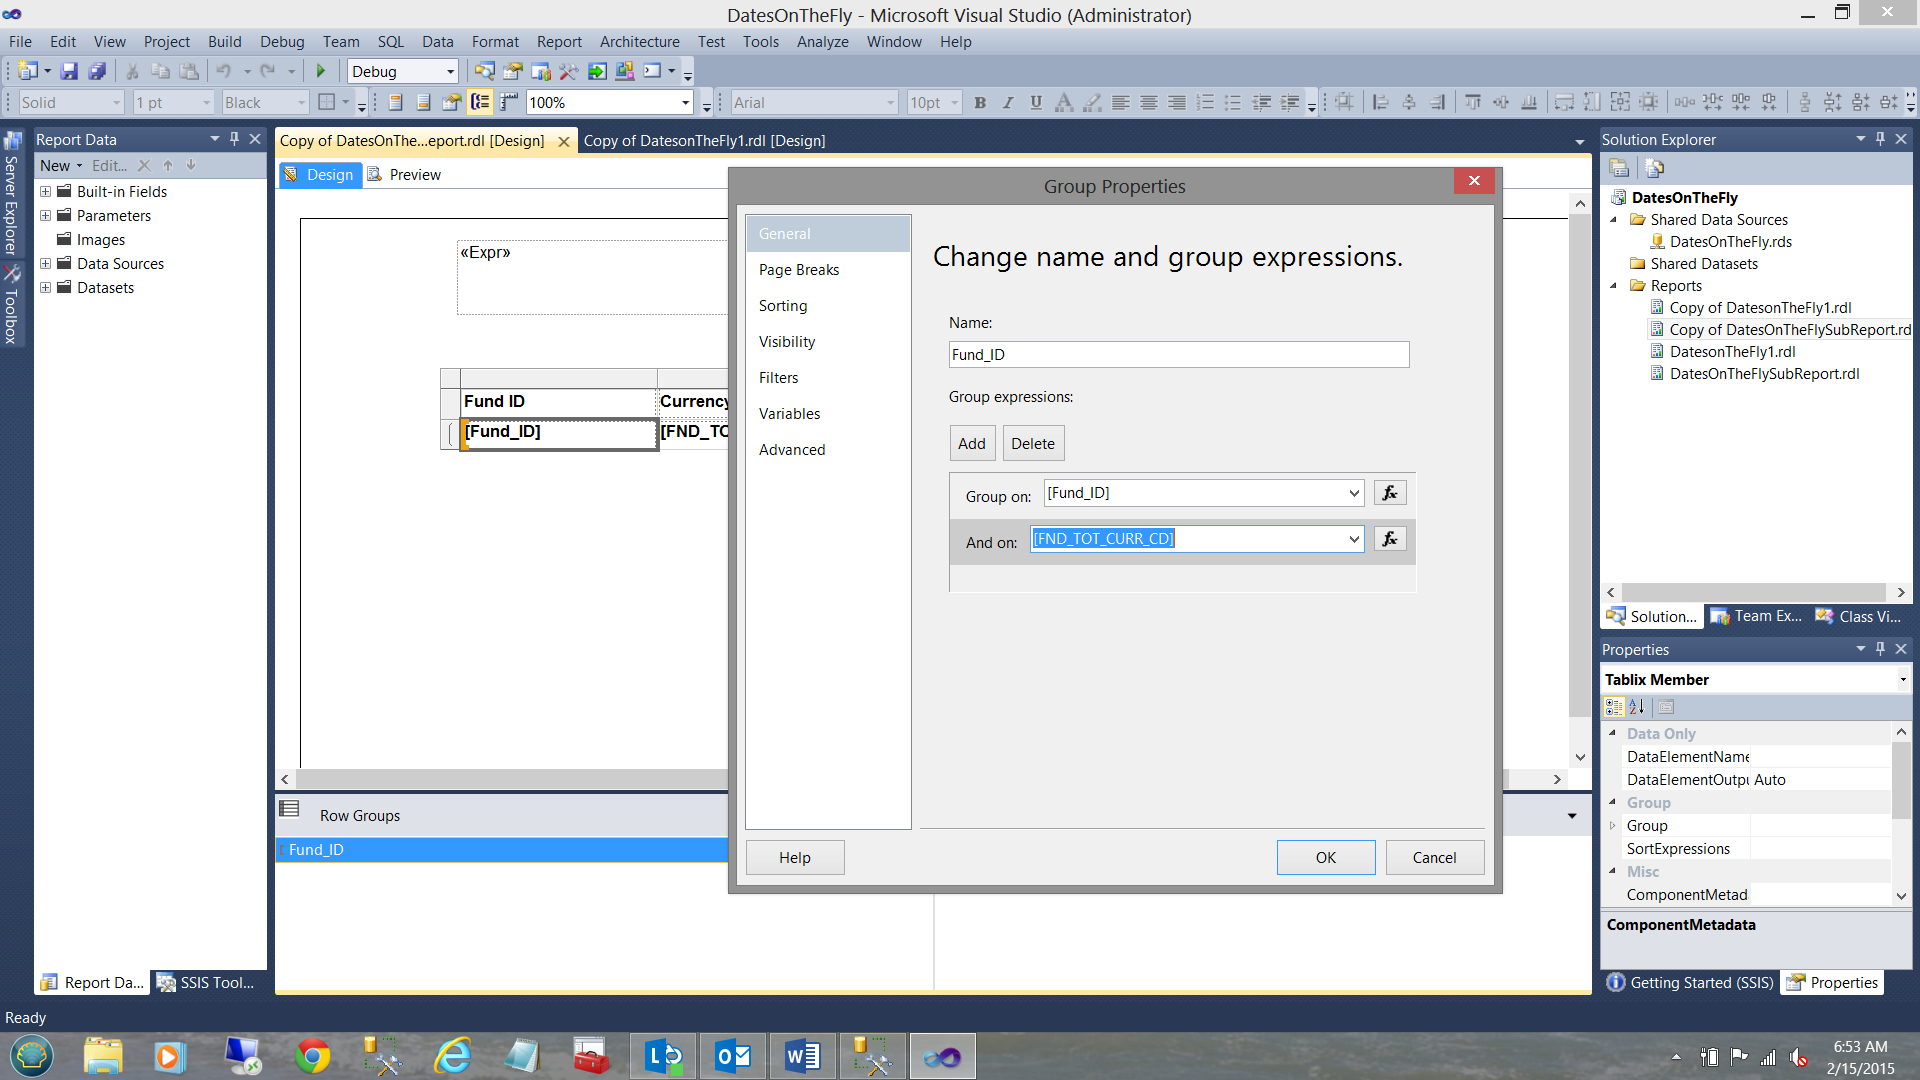
Last, but not least, we must modify the data grouping, to group not only on the fund but on the currency code as well (see below).
Back on our original chart
Having completed our matrix based subreport, we are now in a position to connect the pieces and complete our report.
By right-clicking on the “bars” of our vertical bar chart, we see the “Series Properties” option on the context menu (see below).
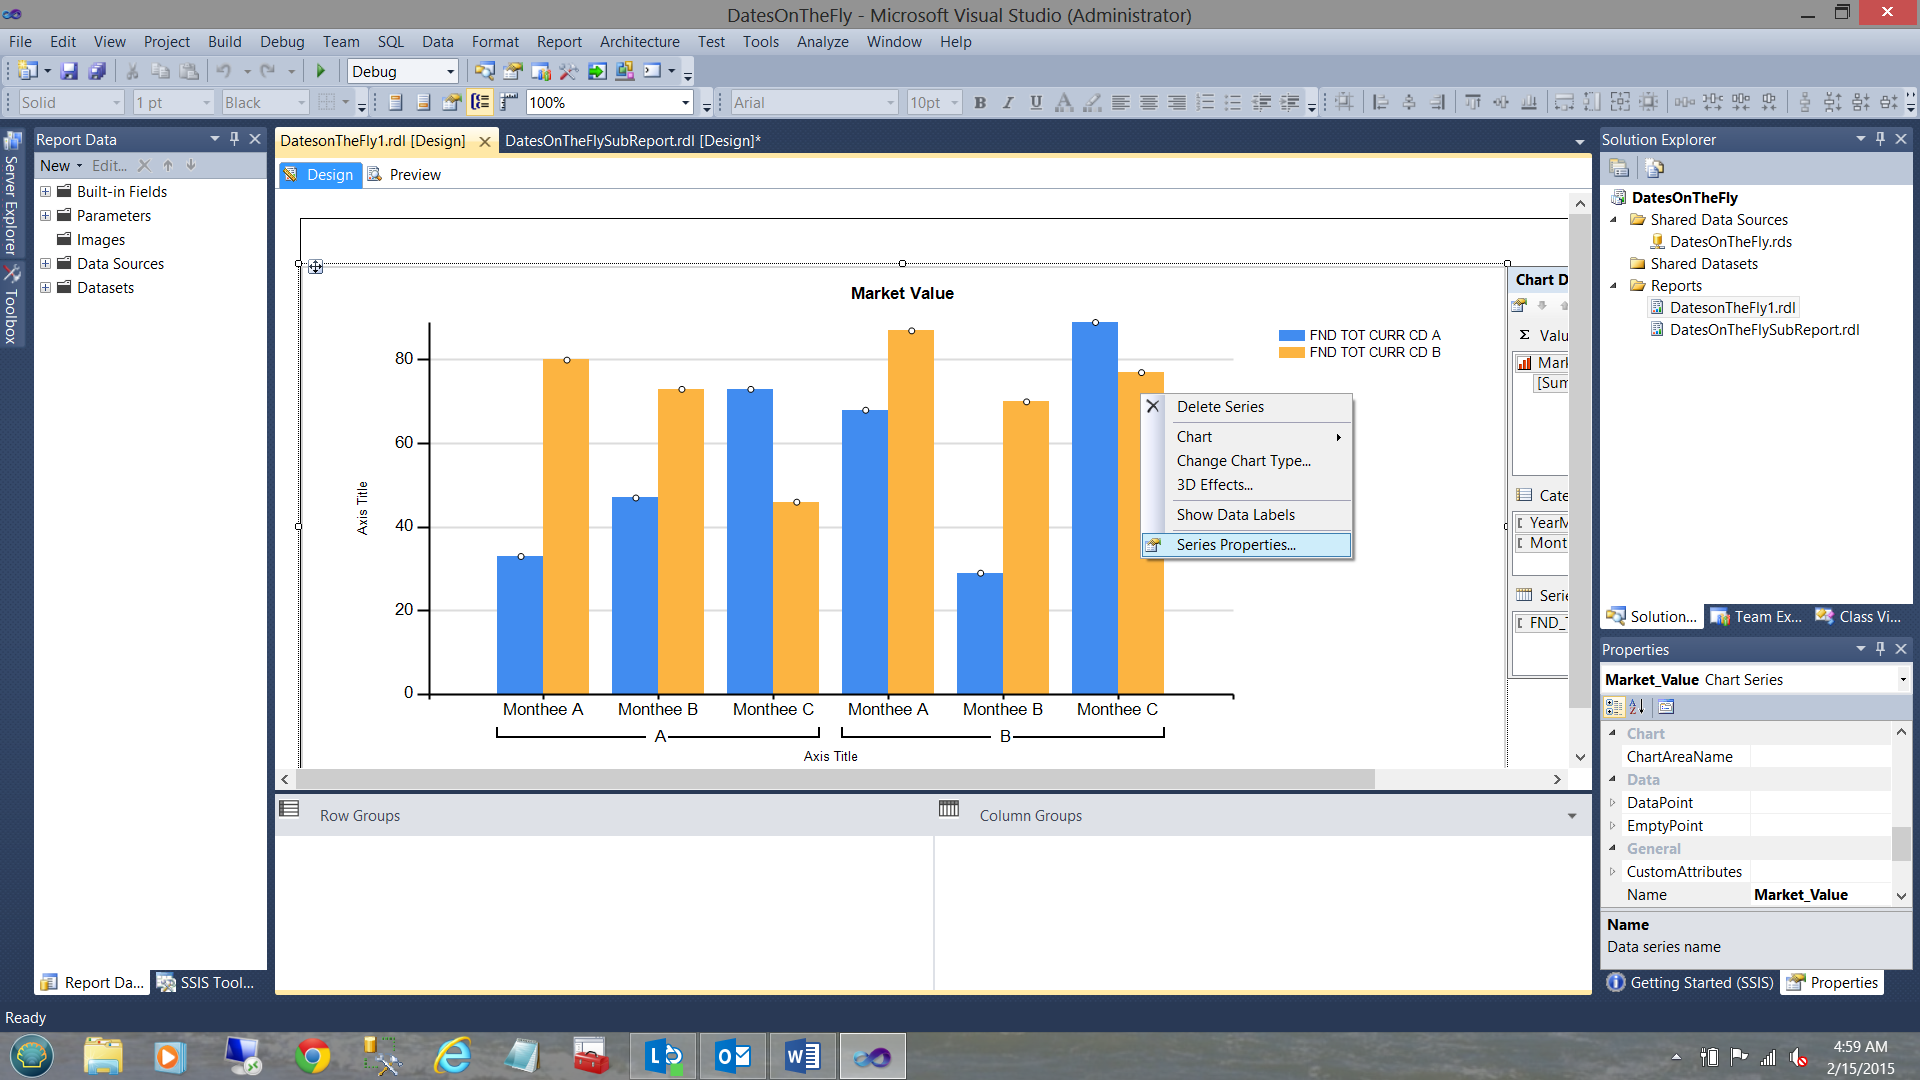
We select the “Series Properties” option.
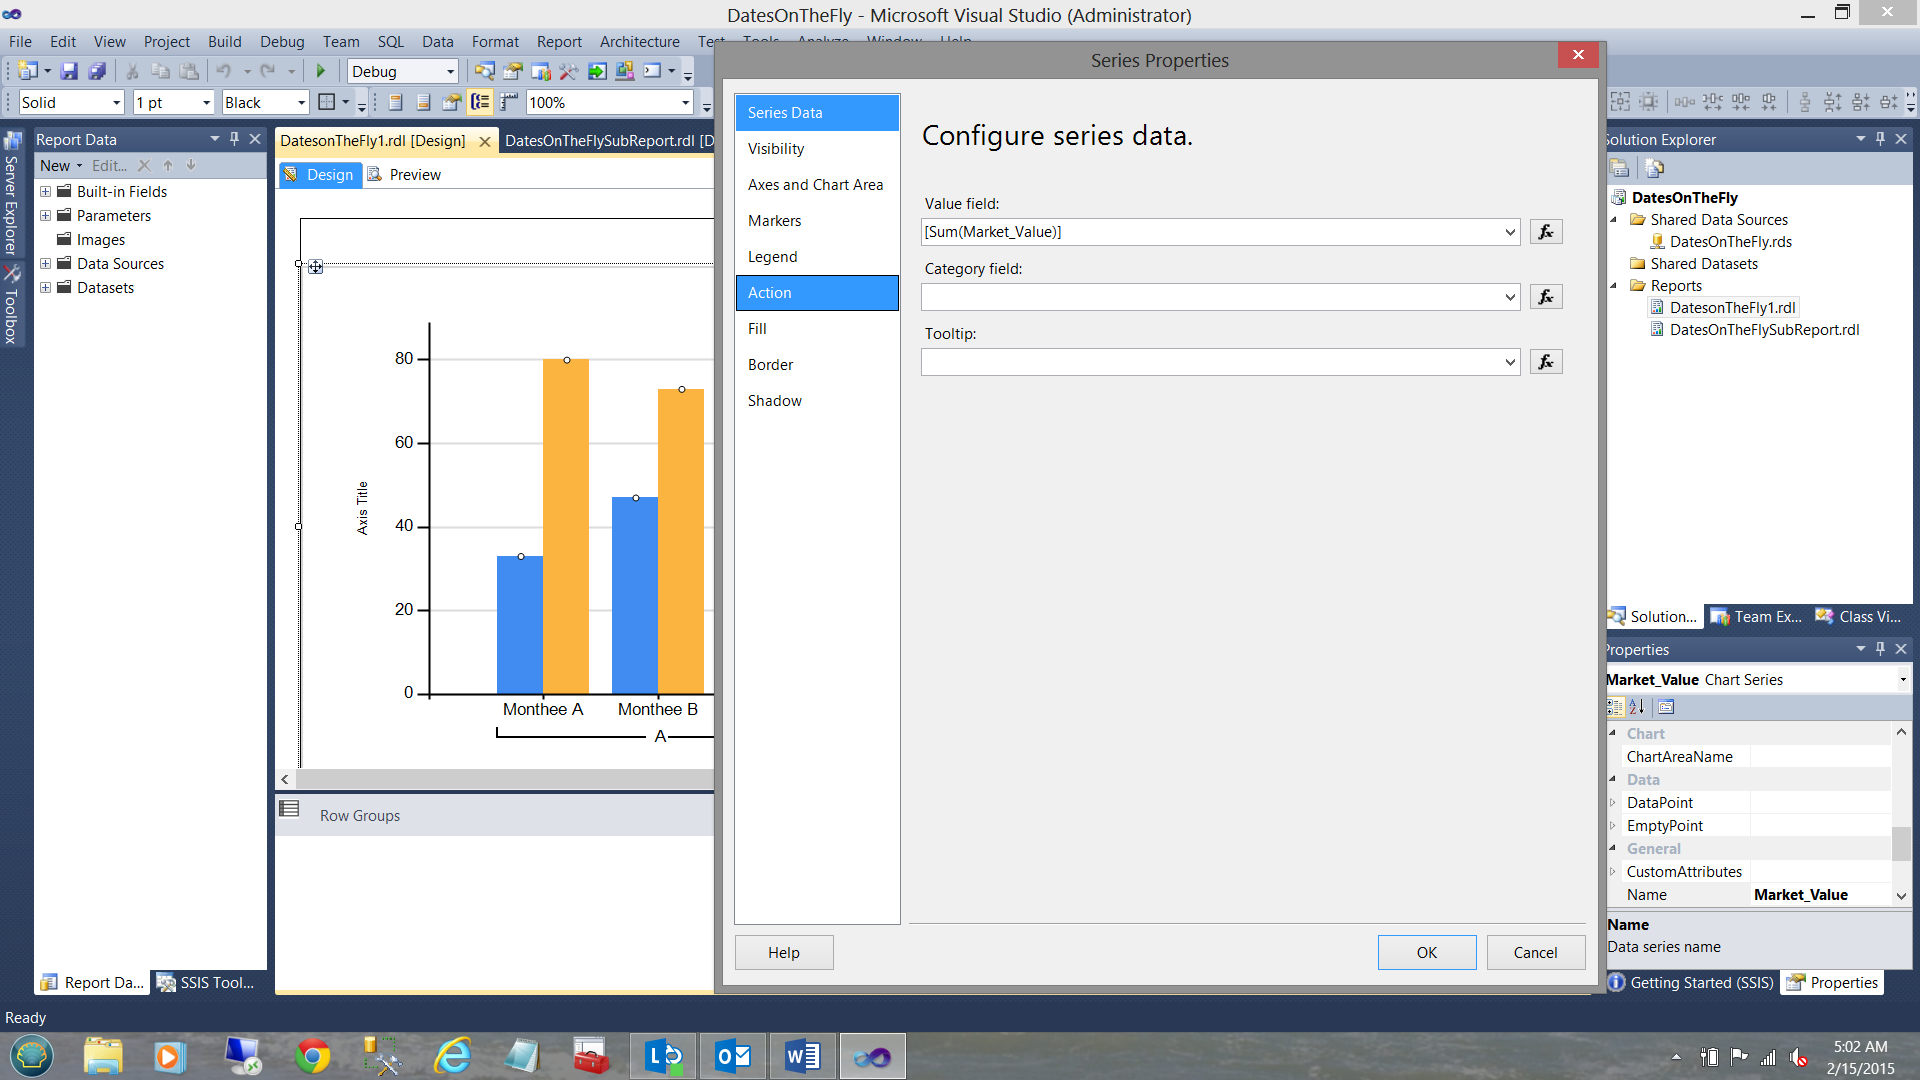
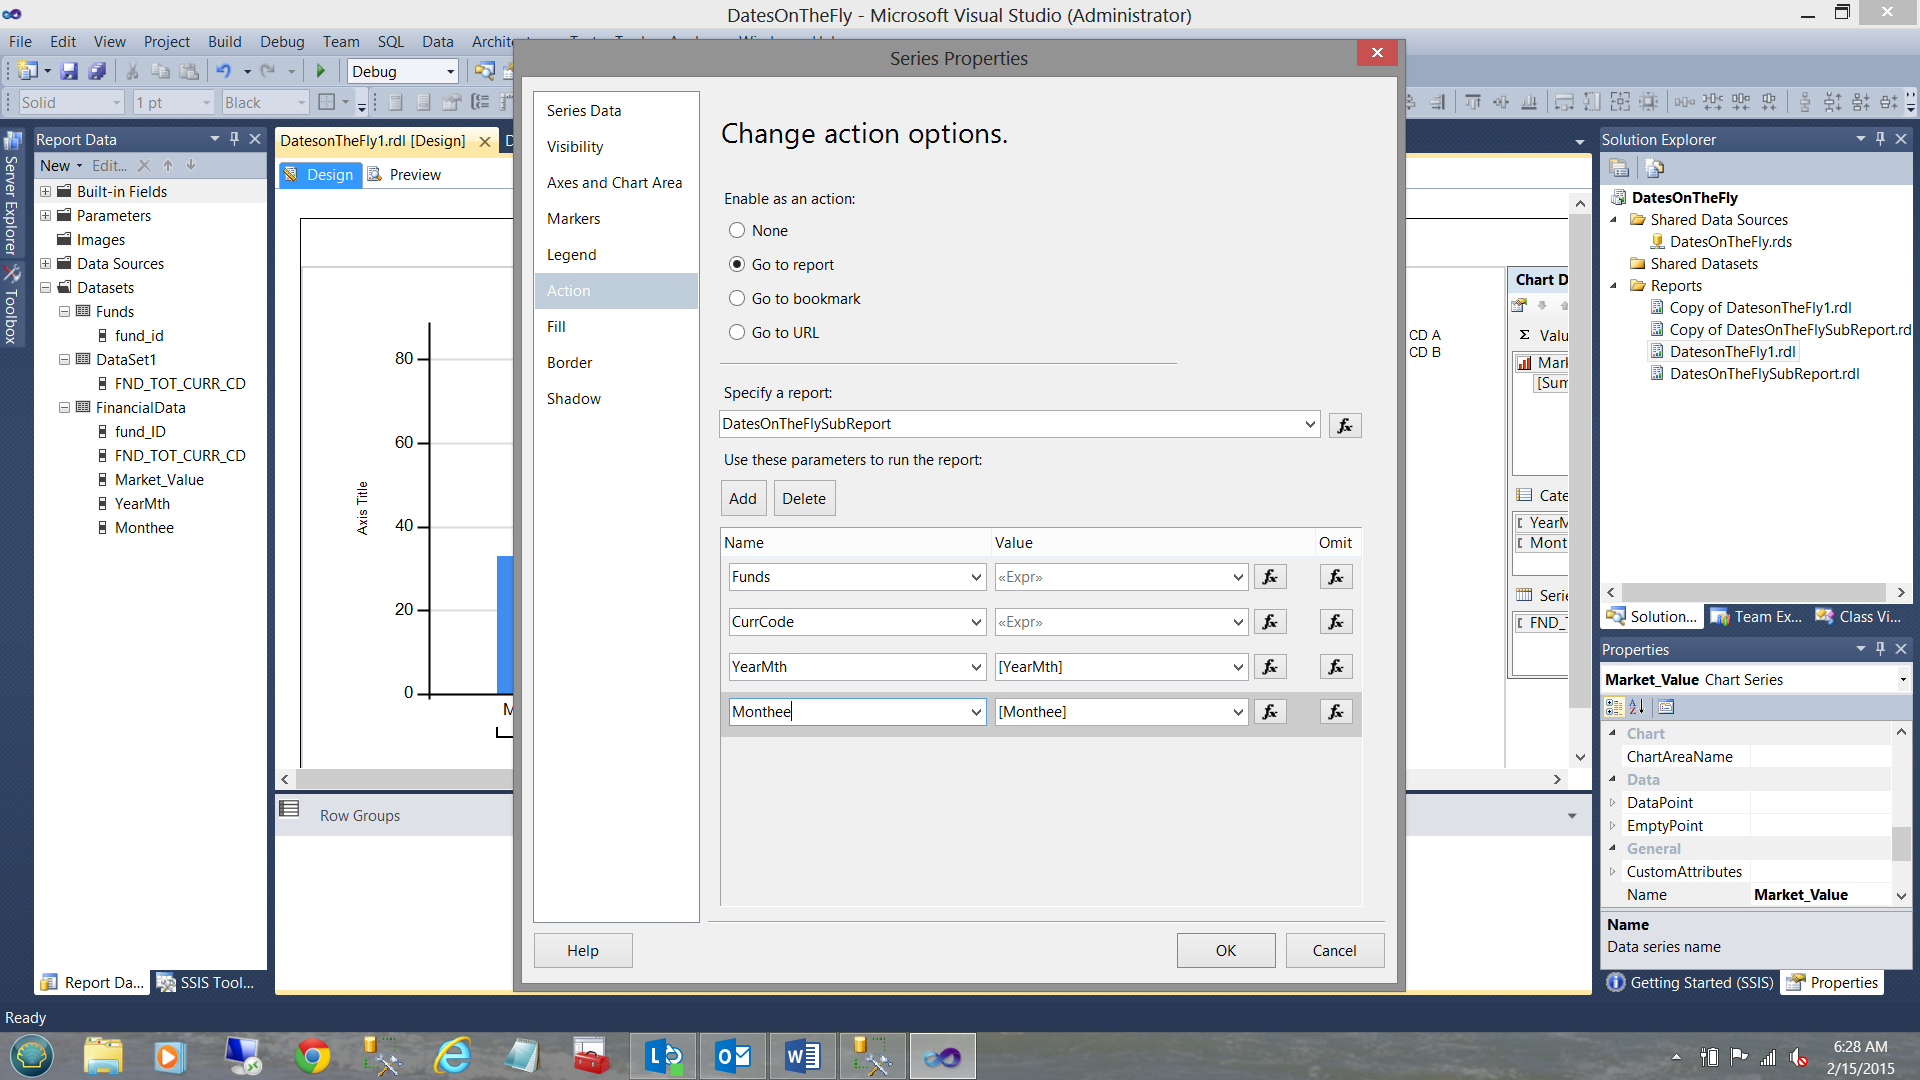
With the “Series Properties” dialog box open (see above) we select the “Action” tab (see above).
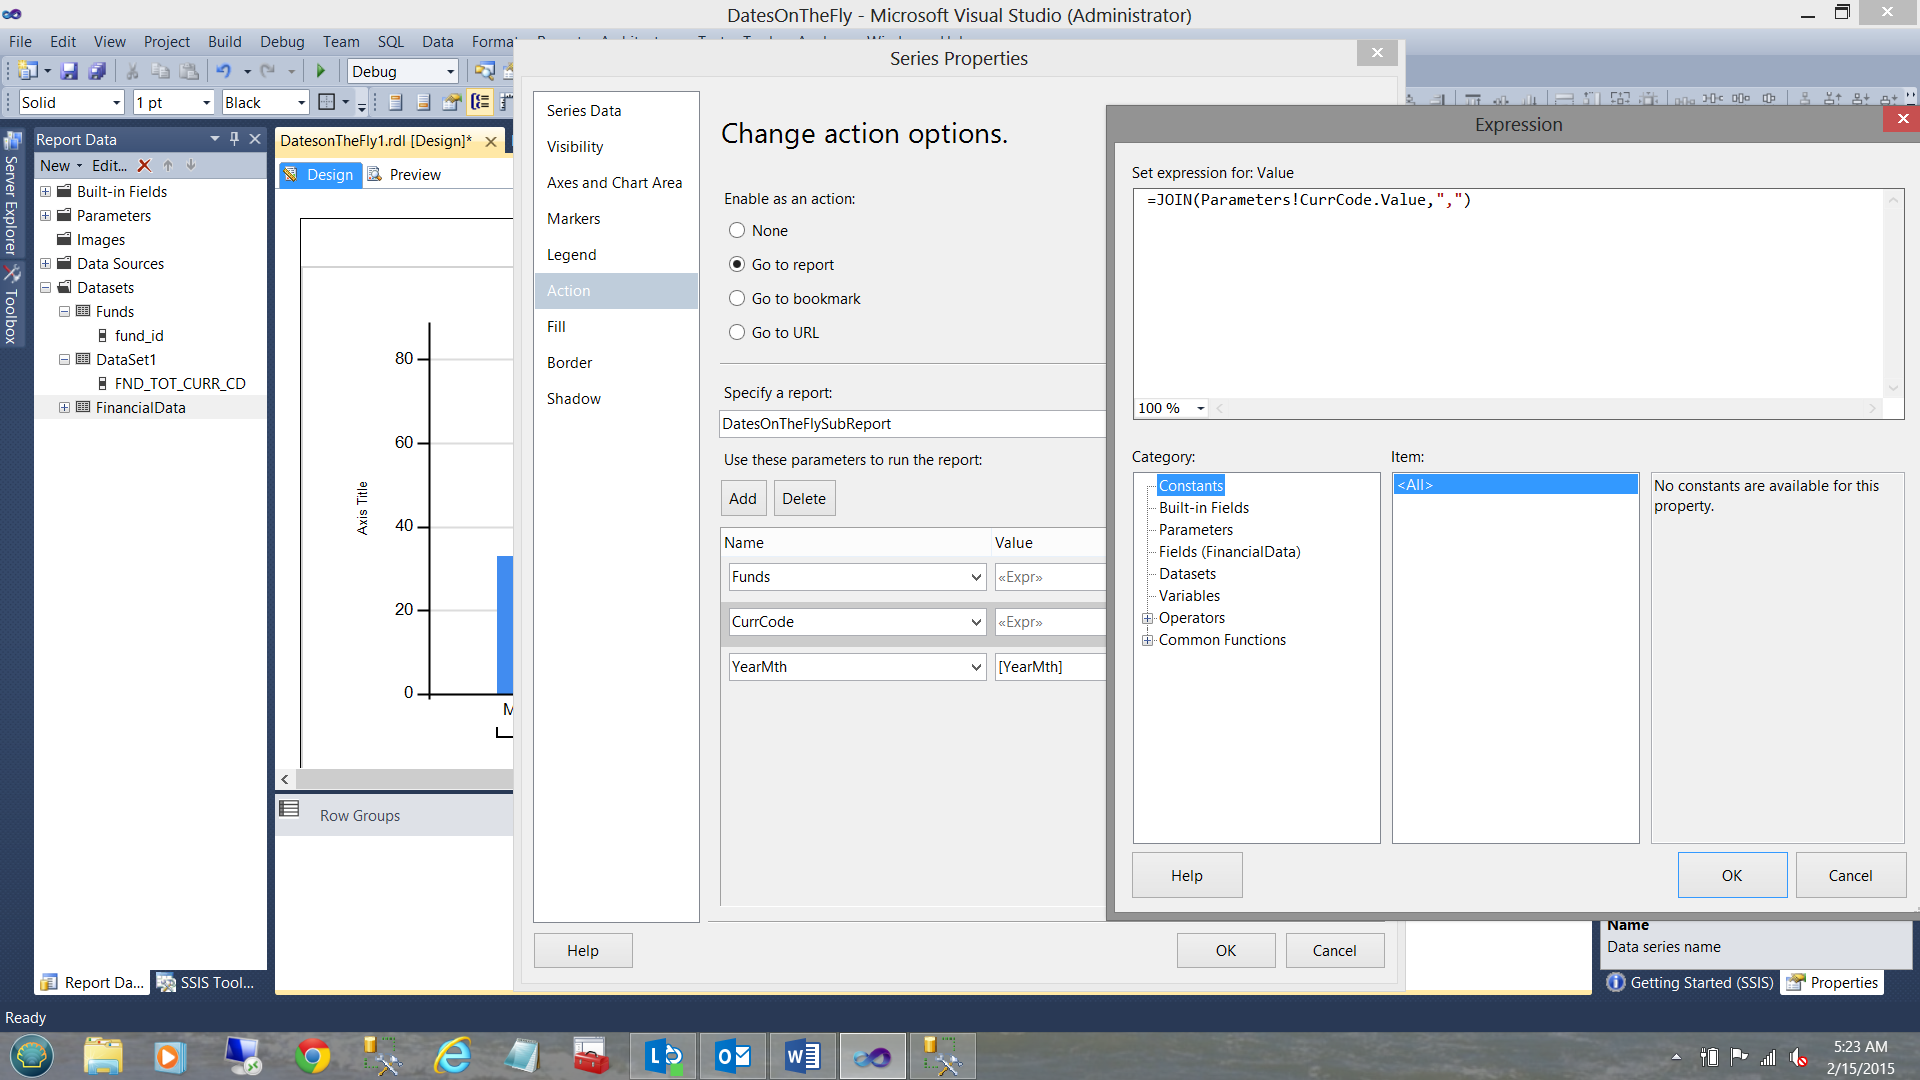
When the action tab opens we click the “Go to report” option and select the matrix based sub-report that we just created. Additionally we pass our three parameters “Funds”, “CurrCode” and the CHOSEN VALUE OF THE MONTH SELECTED generated by clicking on one of the vertical bars of the chart.
Parameter Passing By Reference
In order to understand what is actually transpiring, let us put our reports under a microscope and walk through what is actually transpiring.
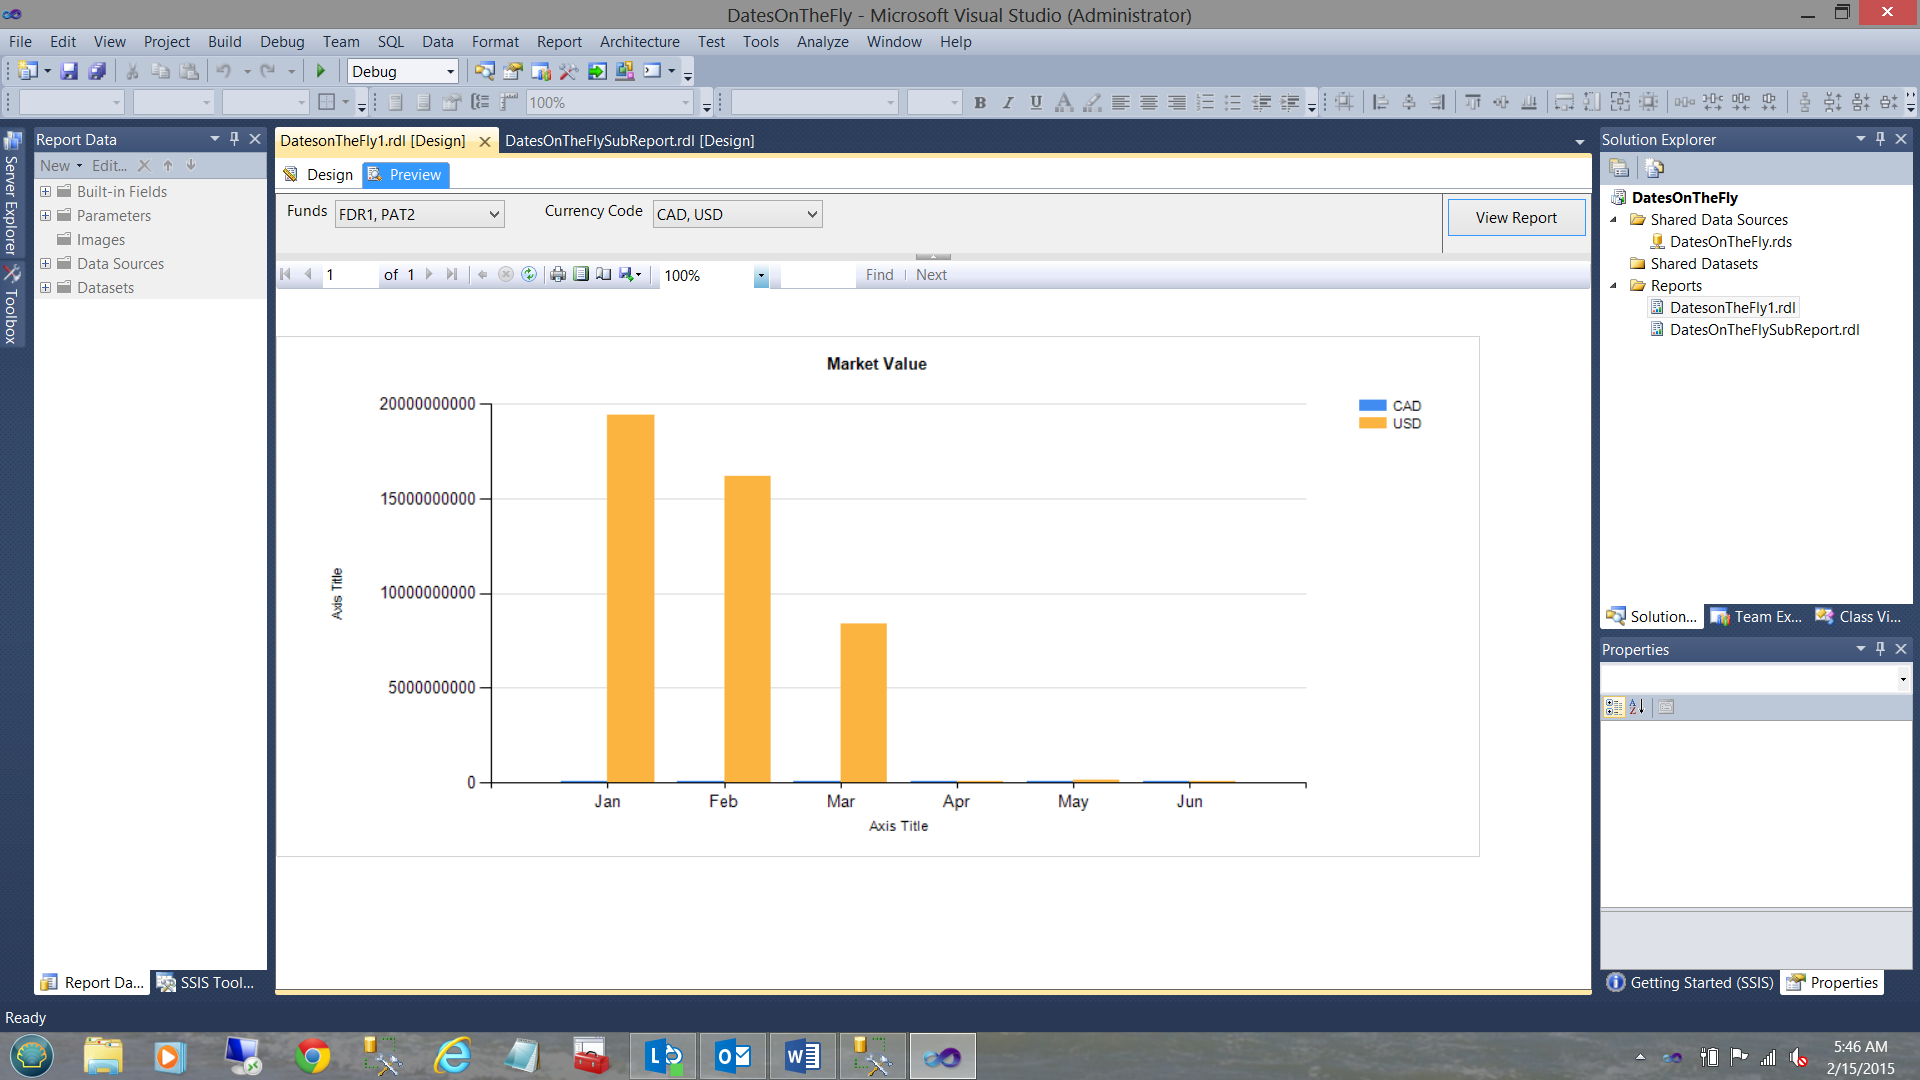
Running our “Mother” or main report, we choose funds “FDR1” and “PAT2”. We also tell the system that we wish to see transactions performed in US and Canadian dollars. We then click the “Feb” vertical bar (see above).
The sub-report is then passed the “Funds”, the “CurrCode” string PLUS THE VALUE OF YEARMTH FOR THAT VERTICAL BAR!
Once all three parameters are passed through, they are “given” to the dataset (see below).
Now that the dataset has acceptable arguments to pass through to our sub report stored procedure (see below), it accepts the data from the stored procedure when the stored procedure has completed processing (see the stored procedure below).

Let us see how this works in practice
The reader will note that within the sub-report in the parameters dropdowns, a crumb trail is shown. These are the arguments that we passed from the “mother” report. Normally these dropdowns are hidden from the user.
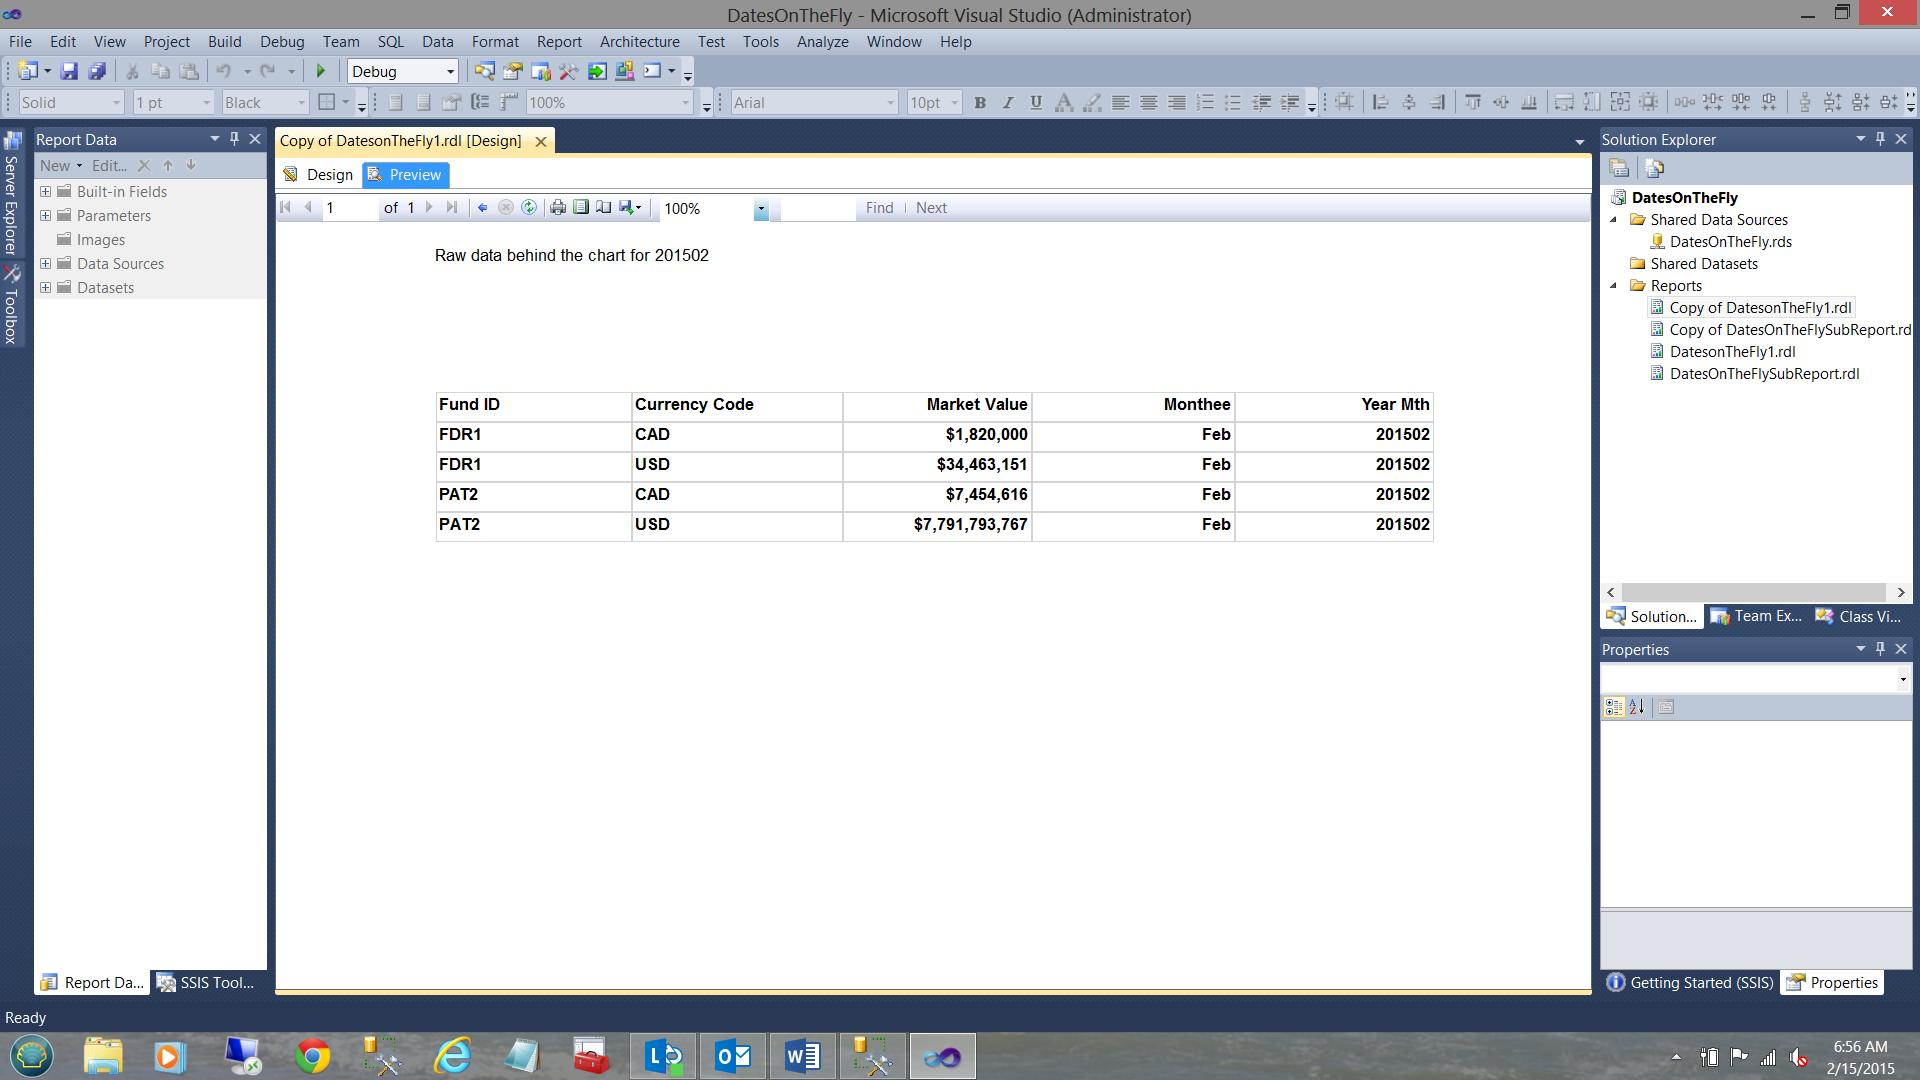
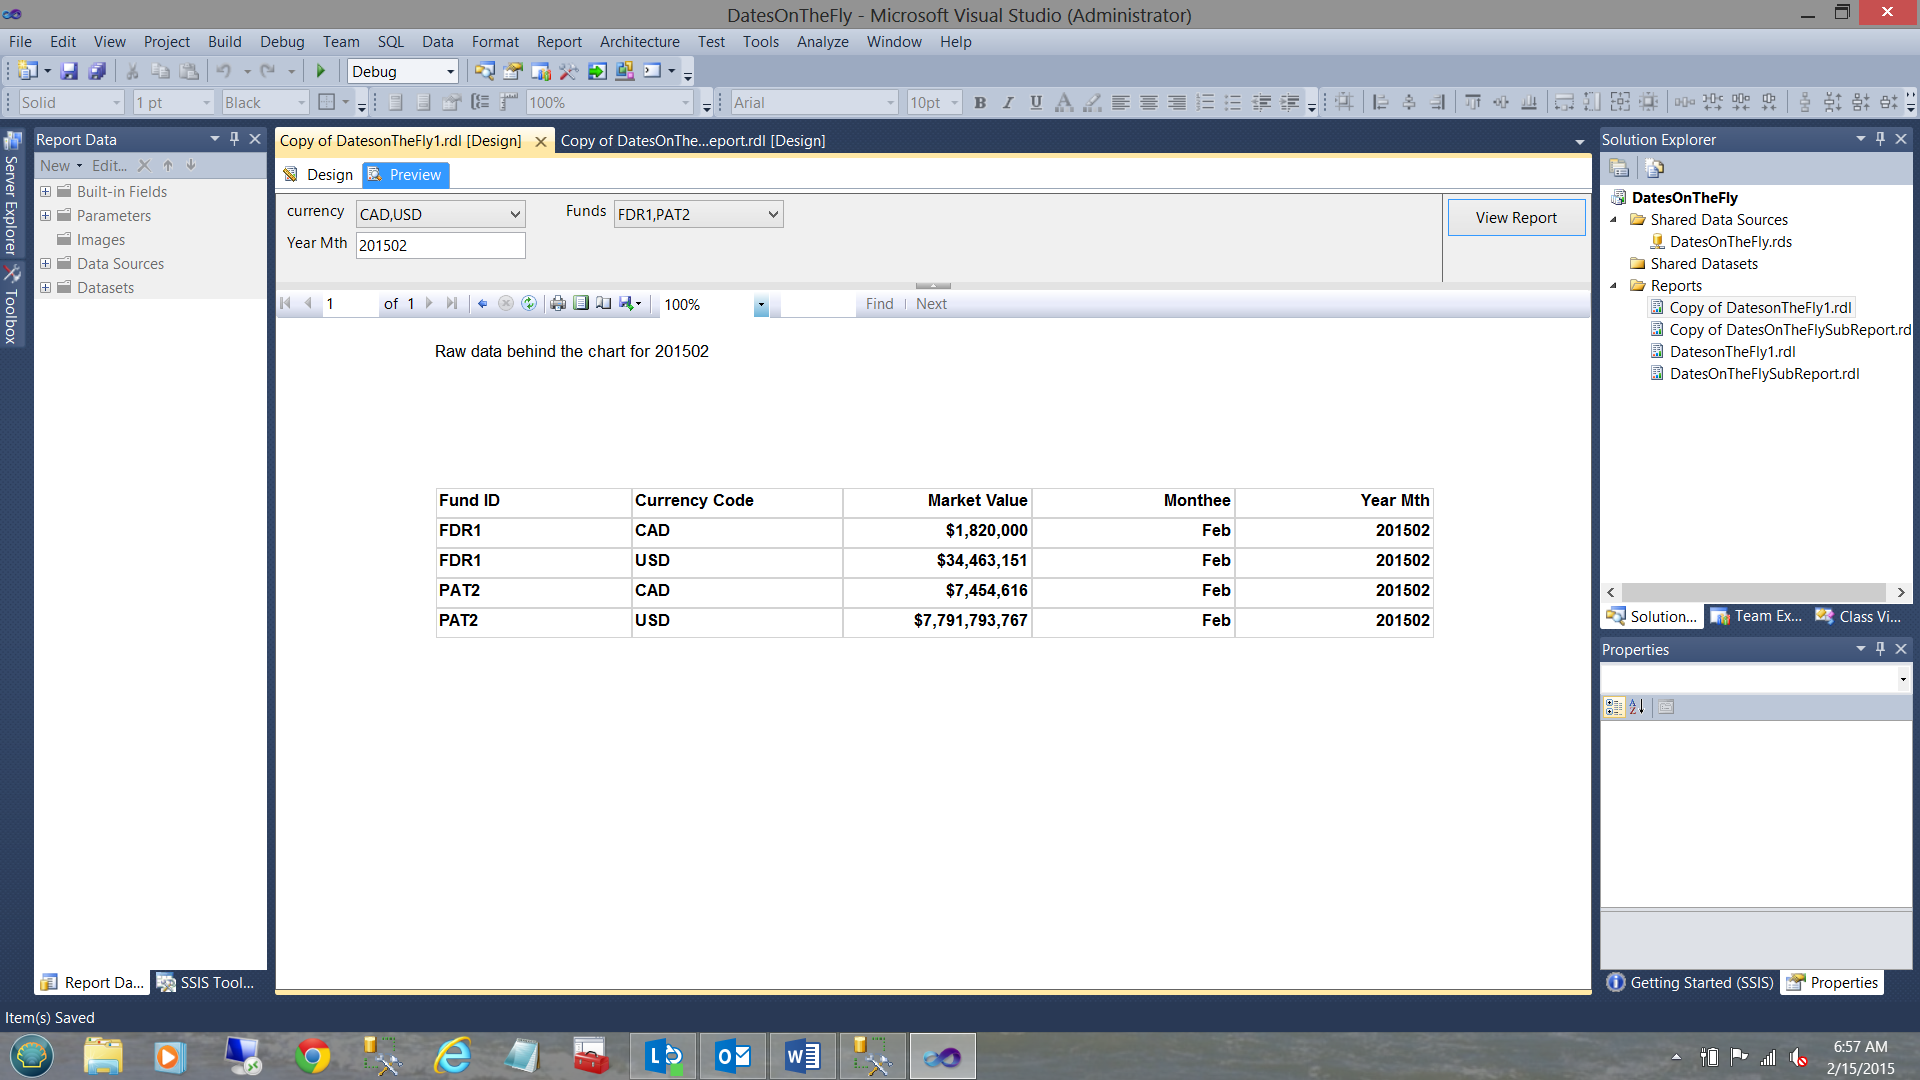
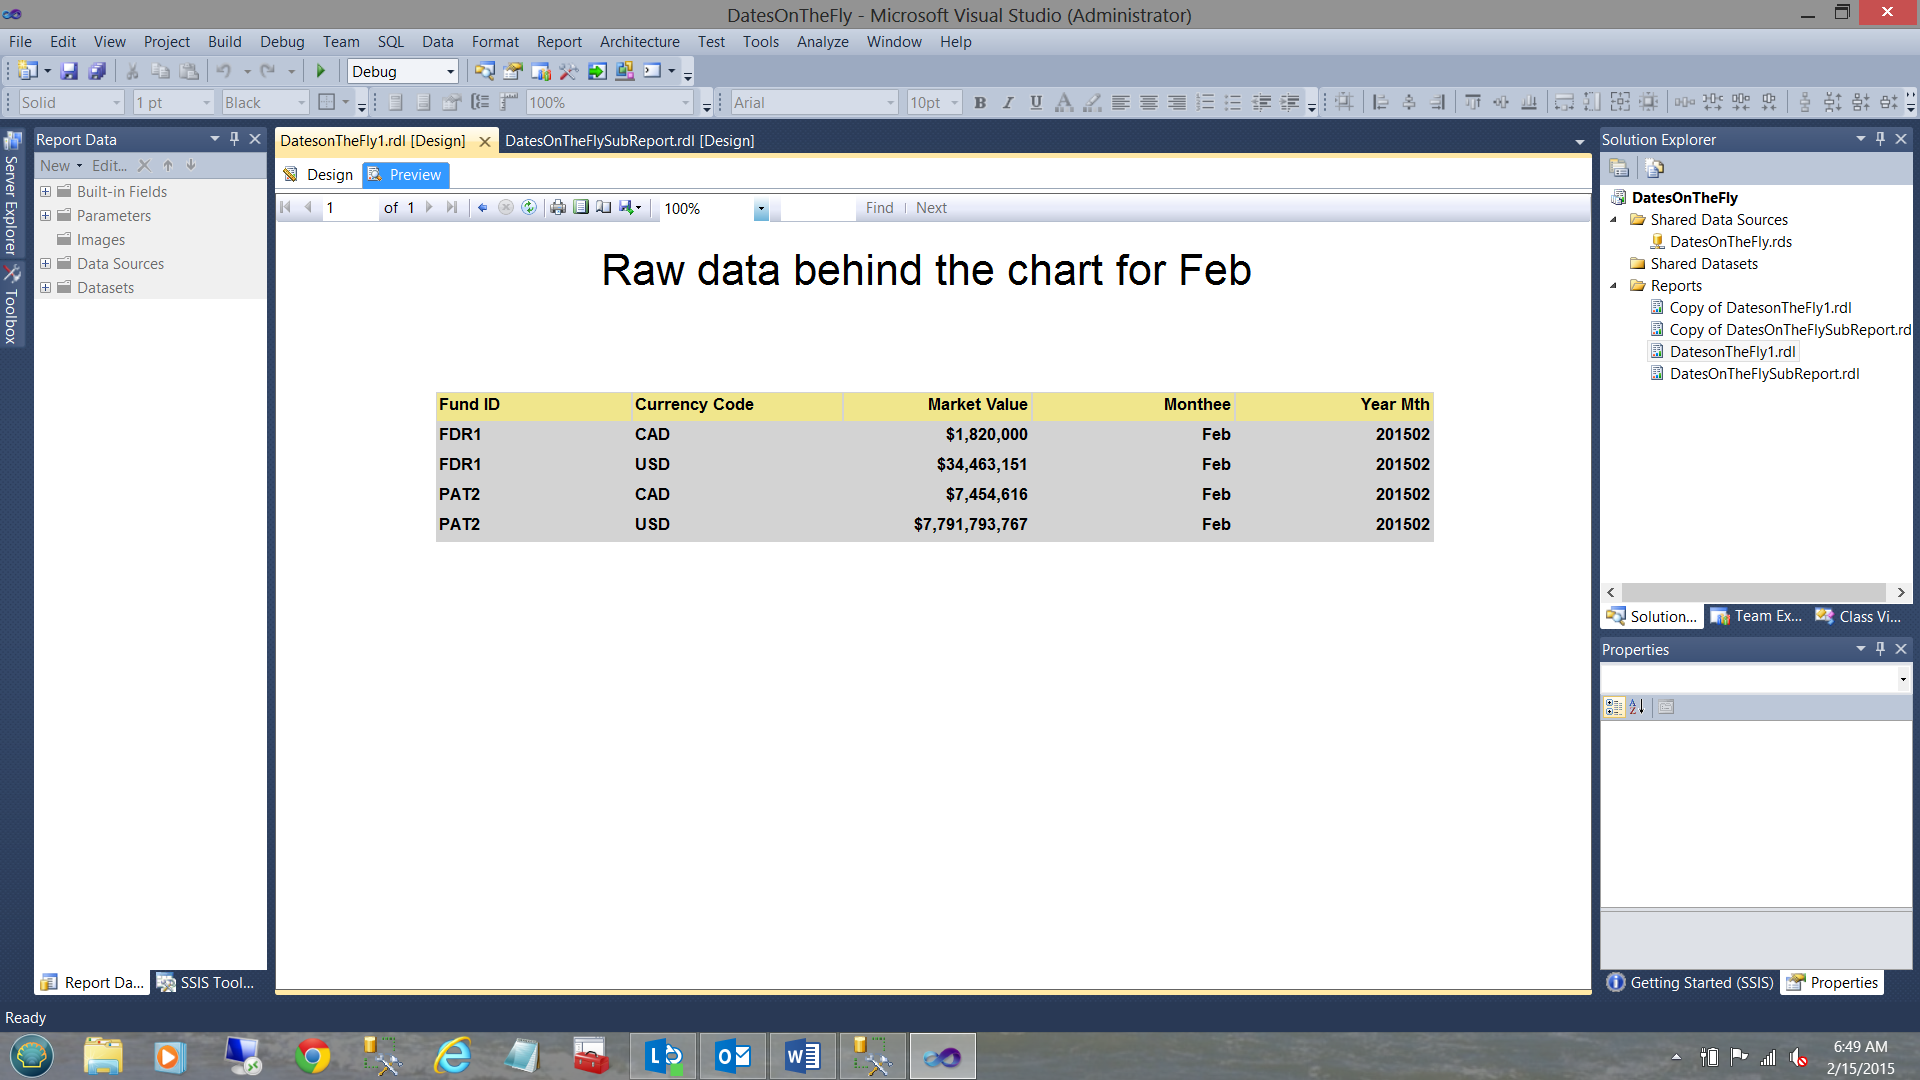
In fact when we hide the parameters, then our sub-report resembles the screenshot shown above. Also, note that the title of the report shows the “YearMth” selected (see above).
One last change that we perhaps would like to make, is to the title of sub-report. It currently says “Raw data behind the chart for 201502”. Let us make the title a bit more user-friendly and pass the name of the actual month.
To achieve this, we add the @monthee parameter to the call to the sub-report (see below).
We add the parameter “@monthee” to the parameters to be passed through to the sub-report stored procedure (see below).
and we refresh the sub-report dataset (see below).
We now change the “Title Box” expression to reflect the following (see below).
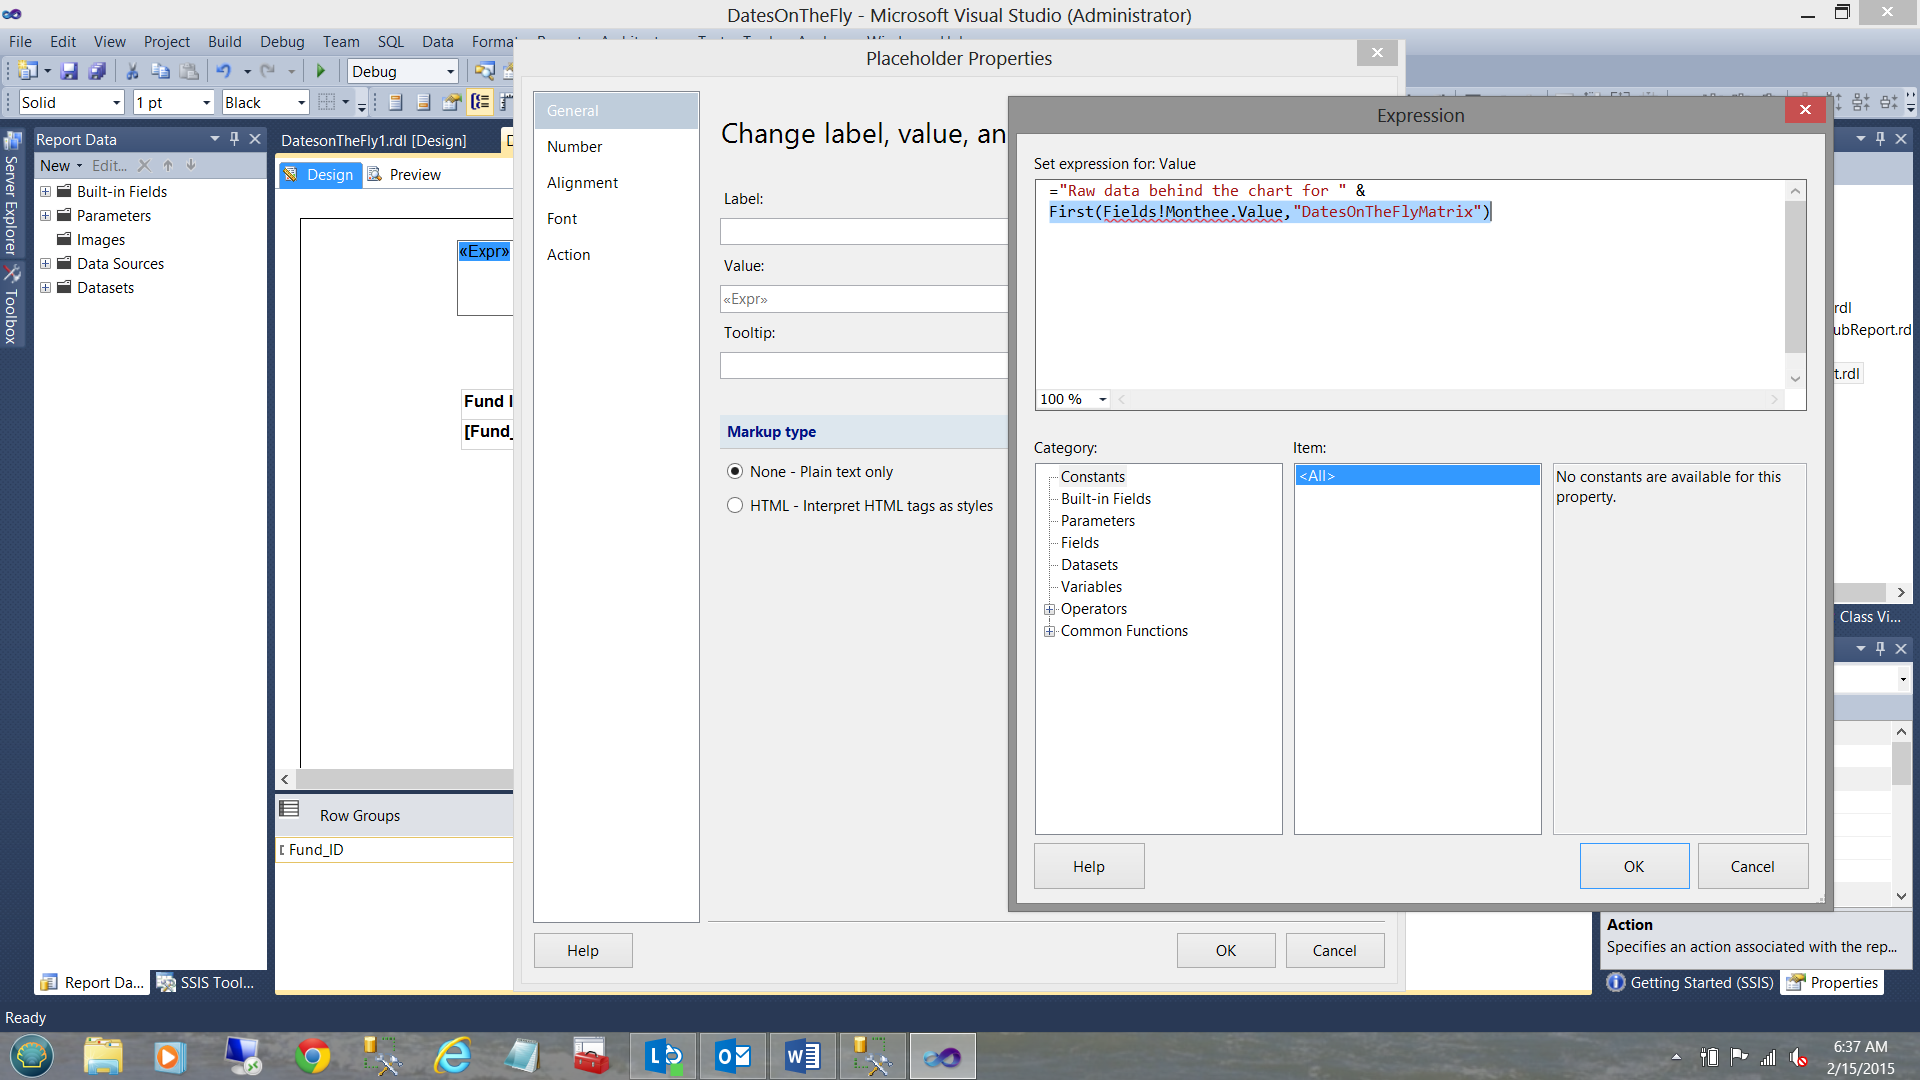
Note that the value that will now be displayed is the actual month name.
When tidied up and a bit of eye candy is added, our final subreport may be seen below:
Conclusions
As we once again come to the end of our “get together”, let us think back for a minute on what we have seen.
- We have created a matrix based sub-report which is called by the report that we created within a previous “get together”.
- We have seen how the parameters within the original report may be passed to the sub-report along with any values that the user may have selected from the main report.
- We have seen that these parameters and their related arguments may be passed to a sub-report based stored procedure and that the resulting dataset may be utilized for the matrix within the sub-report.
- Finally we have seen how to utilize parameter values within the “Report Title” along with being able to add the actual month name to the “Report Title” by utilizing the First() function.
As always, should you have any questions, please do contact the SQL Shack editor or me directly.
In the interim, happy programming!!
Addenda 1
|
1 2 3 4 5 6 7 8 9 10 11 12 13 14 15 16 17 18 19 20 21 22 23 24 25 26 27 28 29 30 31 32 33 34 35 36 37 38 39 40 41 42 43 44 45 46 47 48 49 50 51 52 53 54 55 56 57 58 59 60 61 62 63 64 65 66 67 68 69 70 71 72 73 74 75 76 77 78 79 80 81 82 83 84 85 86 87 88 89 90 91 92 93 94 95 96 97 98 99 100 101 102 103 104 105 106 107 108 109 110 111 112 113 114 115 116 117 118 119 120 121 122 123 124 125 126 127 128 129 130 131 132 133 134 135 136 137 138 139 140 141 142 143 144 145 146 147 148 149 150 151 152 153 154 155 156 |
USE [SQLShackFinancial] GO /****** Object: StoredProcedure [dbo].[SQLShackFiscalFiscalYearSubReport] Script Date: 2/15/2015 7:12:37 AM ******/ SET ANSI_NULLS ON GO SET QUOTED_IDENTIFIER ON GO --IF OBJECT_ID(N'tempdb..#Fund') IS NOT NULL --BEGIN -- DROP TABLE #Fund --END --IF OBJECT_ID(N'tempdb..#Currency') IS NOT NULL --BEGIN -- DROP TABLE #Currency --END --Go CREATE procedure [dbo].[SQLShackFiscalFiscalYearSubReport] ( @CurrCode varchar(2000), @Funds varchar(2000), @YearMth varchar(6) ,@Monthee varchar(3) ) as --Declare @CurrCode varchar(2000) --Declare @Funds varchar(2000) --Declare @YearMth varchar(6) --set @CurrCode = 'USD, CAD' --Set @Funds = 'Pat2, FDR1' --Set @YearMth = '201502' declare @beginFiscal date declare @endFiscal date declare @Yearr varchar(4) declare @decider int -- The guts of the code set @decider = datepart(Month,convert(date,getdate())) set @Yearr = datepart(YEAR,Convert(date,Getdate())) set @Yearr = case when @decider >= 7 then datepart(YEAR,Convert(date,Getdate())) else @Yearr -1 end set @Beginfiscal = convert(varchar(4),@Yearr) + '0701' set @Endfiscal = dateadd(d,-1,dateadd(Year,1,@beginFiscal)) declare @Comma CHAR(1) declare @Fund table ( fundid varchar(8) NOT NULL ) Set @Comma = ',' BEGIN DECLARE @Position INT DECLARE @Substringg VARCHAR(8000) SELECT @Position =1 IF (LEN(@Funds)<1) OR @Funds IS NULL RETURN WHILE @Position!=0 BEGIN SET @Position=CHARINDEX(@Comma,@Funds) IF @Position<>0 SET @Substringg=LEFT(@Funds,@Position-1) ELSE SET @Substringg=@Funds IF(LEN(@Substringg)>0) INSERT INTO @Fund(fundid) VALUES(RTRIM(LTRIM(@Substringg))) SET @Funds=RIGHT(@Funds,LEN(@Funds)-@Position) IF LEN(@Funds)=0 BREAK END select fundid as [fundid] Into #fund from @fund END Set @Position = 0 Set @Substringg = '' declare @CurrCode1 table ( Currency varchar(8) NOT NULL ) Set @Comma = ',' BEGIN --DECLARE @Position INT --DECLARE @Substringg VARCHAR(8000) SELECT @Position =1 IF (LEN(@CurrCode)<1) OR @CurrCode IS NULL RETURN WHILE @Position!=0 BEGIN SET @Position=CHARINDEX(@Comma,@CurrCode) IF @Position<>0 SET @Substringg=LEFT(@CurrCode,@Position-1) ELSE SET @Substringg=@CurrCode IF(LEN(@Substringg)>0) INSERT INTO @CurrCode1 (currency) VALUES(RTRIM(LTRIM(@Substringg))) SET @CurrCode =RIGHT(@CurrCode,LEN(@CurrCode)-@Position) IF LEN(@CurrCode)=0 BREAK END select currency as [currency] Into #currency from @CurrCode1 END Select fund_ID, FND_TOT_CURR_CD, sum(MKT_VAL_TOT_AMT) as [Market Value] , YearMth, @monthee, case when right(YearMth,2) = '01' then 'Jan' when right(YearMth,2) = '02' then 'Feb' when right(YearMth,2) = '03' then 'Mar' when right(YearMth,2) = '04' then 'Apr' when right(YearMth,2) = '05' then 'May' when right(YearMth,2) = '06' then 'Jun' when right(YearMth,2) = '07' then 'Jul' when right(YearMth,2) = '08' then 'Aug' when right(YearMth,2) = '09' then 'Sep' when right(YearMth,2) = '10' then 'Oct' when right(YearMth,2) = '11' then 'Nov' when right(YearMth,2) = '12' then 'Dec' else '99' end as Monthee from ( select FUND_ID, CAL_DT, FND_TOT_TYP_CD, FND_TOT_CURR_CD, MKT_VAL_TOT_AMT ,convert(varchar(4),datepart(year,Convert(date,Cal_dt))) + Convert(varchar(2),case when len(datepart(month,Convert(date,Cal_dt))) = 1 then '0' + convert(varchar(2),datepart(month,Convert(date,Cal_dt))) else convert(varchar(2),datepart(month,Convert(date,Cal_dt))) end) as YearMth from [dbo].[DateOnTheFly] DOTF inner join #Fund fund on DOTF.Fund_ID = fund.fundid Inner join #Currency currency on currency.currency = DOTF.FND_TOT_CURR_CD where cal_dt between @beginFiscal and @endFiscal )a where @YearMth = rtrim(ltrim(YearMth)) Group by FUND_ID, FND_TOT_TYP_CD, FND_TOT_CURR_CD,YearMth, case when right(YearMth,2) = '01' then 'Jan' when right(YearMth,2) = '02' then 'Feb' when right(YearMth,2) = '03' then 'Mar' when right(YearMth,2) = '04' then 'Apr' when right(YearMth,2) = '05' then 'May' when right(YearMth,2) = '06' then 'Jun' when right(YearMth,2) = '07' then 'Jul' when right(YearMth,2) = '08' then 'Aug' when right(YearMth,2) = '09' then 'Sep' when right(YearMth,2) = '10' then 'Oct' when right(YearMth,2) = '11' then 'Nov' when right(YearMth,2) = '12' then 'Dec' else '99' end order by YearMth desc GO |
Steve has presented papers at 8 PASS Summits and one at PASS Europe 2009 and 2010. He has recently presented a Master Data Services presentation at the PASS Amsterdam Rally.
Steve has presented 5 papers at the Information Builders' Summits. He is a PASS regional mentor.
View all posts by Steve Simon
- Reporting in SQL Server – Using calculated Expressions within reports - December 19, 2016
- How to use Expressions within SQL Server Reporting Services to create efficient reports - December 9, 2016
- How to use SQL Server Data Quality Services to ensure the correct aggregation of data - November 9, 2016