
In this post we are going to talk about one of the model assumptions, that was changed in the new cardinality estimation mechanism in SQL Server 2014 – Join Containment Assumption.
You may find some information about this assumption in the Ian Jose’s blog post: Query Processor Modelling Extensions in SQL Server 2005 SP1, there you may find the description of the so-called simple assumption and base assumption. Another source of available information is a white paper from Joseph Sack Optimizing Your Query Plans with the SQL Server 2014 Cardinality Estimator.
Let’s take a look at the example in action. We’ll use the AdventureWorks2012 database under the compatibility level of SQL Server 2014 and three identical queries, that demand customers from the particular territory and their orders for particular dates. The only exception is that the first query uses TF 9481 that forces the old cardinality estimation behavior, the second also uses the old CE but with the Modeling Extensions enabled (as they were described in the Ian Jose’s blog post mentioned above), the third one query uses the new CE. Let’s run them and look at the estimates.
|
1 2 3 4 5 6 7 8 9 10 11 12 13 14 15 16 17 18 19 20 21 22 23 24 25 26 27 28 29 30 31 32 33 34 35 36 37 38 39 40 41 42 43 44 45 46 47 48 |
alter database AdventureWorks2012 set compatibility_level = 120; go set statistics xml on go -- The Old Behavior declare @a int, @b int; select @a = soh.SalesOrderID, @b = c.CustomerID from Sales.SalesOrderHeader soh join Sales.Customer c on soh.CustomerID = c.CustomerID where soh.OrderDate between '20070101' and '20070201' and c.TerritoryID = 10 option(querytraceon 9481) go -- The Old Behavior with TF 2301 that enables Modelling Extensions declare @a int, @b int; select @a = soh.SalesOrderID, @b = c.CustomerID from Sales.SalesOrderHeader soh join Sales.Customer c on soh.CustomerID = c.CustomerID where soh.OrderDate between '20070101' and '20070201' and c.TerritoryID = 10 option(querytraceon 9481, querytraceon 2301) go -- The New Behavior declare @a int, @b int; select @a = soh.SalesOrderID, @b = c.CustomerID from Sales.SalesOrderHeader soh join Sales.Customer c on soh.CustomerID = c.CustomerID where soh.OrderDate between '20070101' and '20070201' and c.TerritoryID = 10 go set statistics xml off go |
The actual number of rows for the Join, for all the queries, is the same and equals 43, however, the estimates are different.

We see that the first query overestimated the number of rows more than 10 times! The other two are pretty close to the actual number of rows. There is a small difference between them, that is because some algorithm details have changed, however, they both use the same approach contradictory to the old model without any extensions. Of course, this query is too simple to result in different plans due to the different estimates, we’ll look at the more complex example later in this post. Now it is interesting to know – why does the first query overestimated the Join 10 times.
Join Simple and Base Containment Assumptions
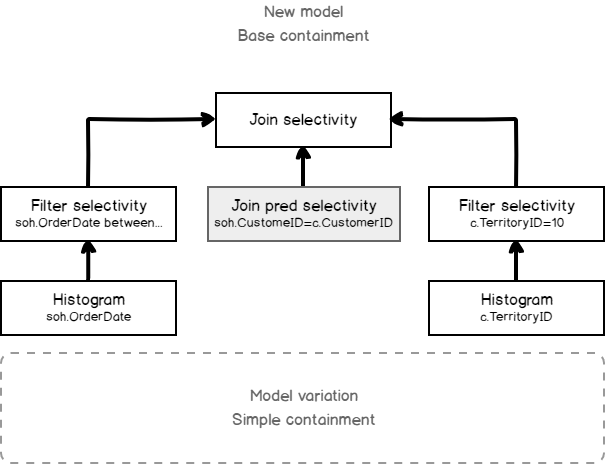
In the example query, we have two tables, two filters on each table and the Join. As we remember, the cardinality estimation process goes from bottom to top, using the child operator statistics as an input, to estimate its cardinality.
That means, that two tables are first filtered by TerrioryID and OrderDate, then the filter statistics collection is used by the join to estimate the join condition selectivity. We may depict this process using the following scheme:
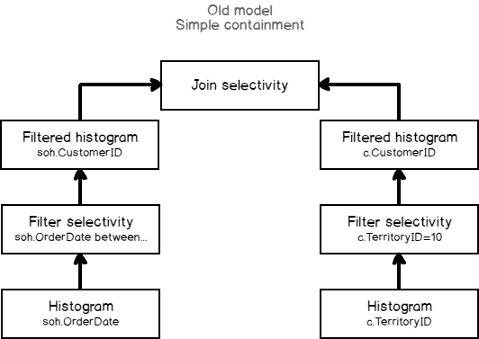
What does it mean, if we use filter statistics collection to estimate the Join predicate selectivity? That means, that join selectivity is dependant on the filters, that assumes some correlation between the join condition and the filtering predicates implying that these two filters are also correlated.
Often this is the wrong assumption. Often the filters from the two tables are independent. That means, that join selectivity should be estimated independently from filters. To estimate this way, the base table statistics and cardinality should be used. That is what Join Base Containment assumption is.
We may depict Join Base Containment Assumption as follows:

Of course, there are cases when the “simple assumption” is closer to the actual than the “base” one, but often the base assumption is closer to the truth. That is why Microsoft tells that there might be regressions, but you may expect the increased plan quality of the workload as a whole.
More Complex Example
Let’s add another table to view the actual differences in the query plans. Suppose we want to know the order detail information also, and join SalesOrderDatail table for that purpose.
|
1 2 3 4 5 6 7 8 9 10 11 12 13 14 15 16 17 18 19 20 21 22 23 24 25 26 27 28 29 30 |
set statistics xml on go declare @a int, @b int; select @a = soh.SalesOrderID, @b = c.CustomerID from Sales.SalesOrderHeader soh join Sales.Customer c on soh.CustomerID = c.CustomerID join Sales.SalesOrderDetail sod on soh.SalesOrderID = sod.SalesOrderID where soh.OrderDate between '20070101' and '20070201' and c.TerritoryID = 10 option(querytraceon 9481) go declare @a int, @b int; select @a = soh.SalesOrderID, @b = c.CustomerID from Sales.SalesOrderHeader soh join Sales.Customer c on soh.CustomerID = c.CustomerID join Sales.SalesOrderDetail sod on soh.SalesOrderID = sod.SalesOrderID where soh.OrderDate between '20070101' and '20070201' and c.TerritoryID = 10 go set statistics xml off go |
The plans would be the following (the old one first, and the new one next).
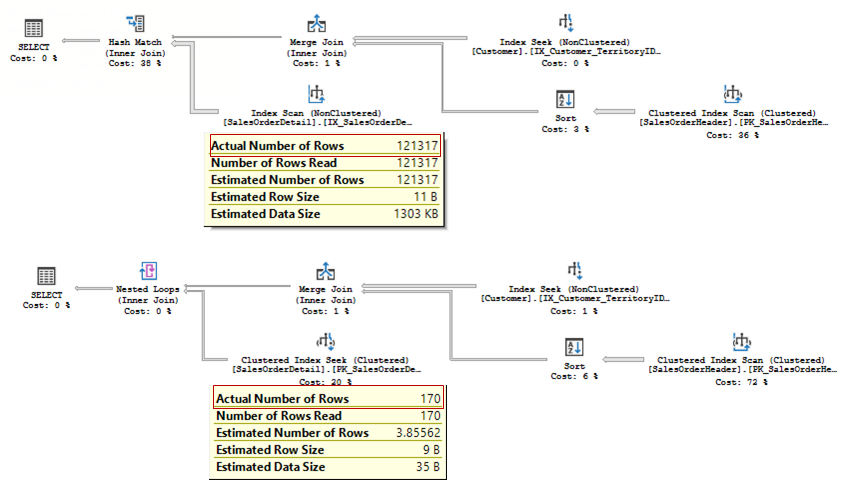
The actual number of rows is 170 for the both queries, but the first one, using the old CE overestimated the Join and used inefficient join type that lead to Index Scan and 121 317 rows to be read. Of course it is a very small database to see the timing difference, but you can imagine what may happen in a real-word database.
The old CE may produce the same plan as the new one if you use TF 2301 (mentioned above) to enable Join Base Containment Assumption, that is enabled in 2014 by default.
In the case when we query data filtered by territory and order date, indeed, these filters are hardly correlated. But, for the sake of truth, I should provide the opposite example. Let’s try to filter by the modified date. It is very likely, that when the order was placed on the table, in the same time, the order details were also saved. So filters are supposed to be correlated. I’ll also add a few more tables to demonstrate the difference, supposing we are looking for some special offers.
|
1 2 3 4 5 6 7 8 9 10 11 12 13 14 15 16 17 18 19 20 21 22 23 24 25 26 27 28 29 30 31 |
select distinct Type into Sales.SpecialOfferType from Sales.SpecialOffer; create clustered index cix_Type_TypeCategoryID on Sales.SpecialOfferType(Type); go set statistics xml on; go declare @a int, @b int, @c int; select @a = soh.SalesOrderID, @b = sod.SalesOrderDetailID from Sales.SalesOrderHeader soh join Sales.SalesOrderDetail sod on soh.SalesOrderID = sod.SalesOrderID where soh.ModifiedDate between '20070101' and '20070115' and sod.ModifiedDate between '20070101' and '20070115' and exists (select * from Sales.SpecialOffer so join Sales.SpecialOfferType sot on so.Type = sot.Type where so.SpecialOfferID = sod.SpecialOfferID and so.Category = 'Reseller') option(querytraceon 9481) go declare @a int, @b int, @c int; select @a = soh.SalesOrderID, @b = sod.SalesOrderDetailID from Sales.SalesOrderHeader soh join Sales.SalesOrderDetail sod on soh.SalesOrderID = sod.SalesOrderID where soh.ModifiedDate between '20070101' and '20070115' and sod.ModifiedDate between '20070101' and '20070115' and exists (select * from Sales.SpecialOffer so join Sales.SpecialOfferType sot on so.Type = sot.Type where so.SpecialOfferID = sod.SpecialOfferID and so.Category = 'Reseller') go set statistics xml off; |
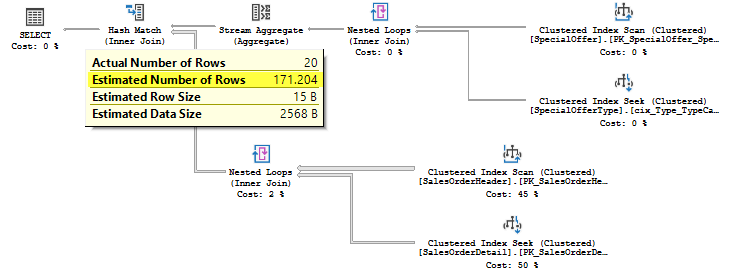
The plans would be the following (the old one and next the new one).
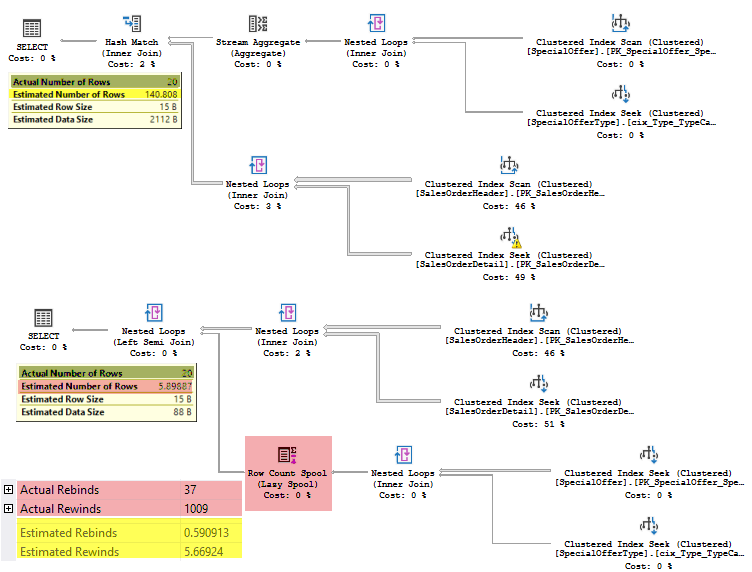
It may be a point of doubt which plan is more efficient, because the first one (using the old CE) is still overestimating the Join, but the second one, this time, underestimated the Join row count. The estimated number of rows is 6 while the actual is 20. The numbers are small as the database is small, but even here, the second plan uses the Spool to optimize rewinds (and I particularly don’t like the plans with a spool and underestimated rewinds – 5 estimated vs. 1000 actual).
What is worth remembering that the estimation algorithms are still based on the statistics, mathematical model, assumptions, and guesses, i.e. have statistical nature. The new model was modified to reflect the modern workload types and use the accumulated experience, so you may expect improvements, however, don’t expect miracles.
The Model Variation
Join Base Containment Assumption is used by default in the new CE framework, however, it is still possible to use Join Simple Containment Assumption and child operator input statistics (not base table statistics) for an estimation. To do it, you should run the query with the TF 9476.
Let’s run the previous query with this flag and gather the compiled plan:
|
1 2 3 4 5 6 7 8 9 10 11 12 |
declare @a int, @b int, @c int; select @a = soh.SalesOrderID, @b = sod.SalesOrderDetailID from Sales.SalesOrderHeader soh join Sales.SalesOrderDetail sod on soh.SalesOrderID = sod.SalesOrderID where soh.ModifiedDate between '20070101' and '20070115' and sod.ModifiedDate between '20070101' and '20070115' and exists (select * from Sales.SpecialOffer so join Sales.SpecialOfferType sot on so.Type = sot.Type where so.SpecialOfferID = sod.SpecialOfferID and so.Category = 'Reseller') option(querytraceon 9476) |
With this TF enabled, the estimate is pretty close to the old CE estimated 140 rows, and we have the same query plan:
Warning: Again, I should frighten each and everyone – this is a complete undocumented stuff, use it for the exploration in the test environments only, unless you are guided by official Microsoft support. All the information provided just for curiosity and is of my own, no warranty expected!
It is interesting to run the query with this trace flag combined with the flag for diagnostic output TF 2363, mentioned earlier. However, this query uses calculator CSelCalcExpressionComparedToExpression, which does not output the desired details, so we will run another query in a simple synthetic database opt, that I often use in the exploration and demonstration process. The query will use calculator CSelCalcSimpleJoinWithDistinctCounts, that shows the stuff of interest.
|
1 2 3 4 5 6 7 8 9 10 11 12 13 14 15 16 17 18 19 20 21 22 23 24 25 |
use opt; go -- using base cardinality declare @v1 int = 10, @v2 int = 10, @v3 int = 100; select * from t1 join t2 on t1.c = t2.d where t1.b < @v1 and t2.c between @v2 and @v3 option( querytraceon 3604, querytraceon 2363 ) go -- using input cardinality declare @v1 int = 10, @v2 int = 10, @v3 int = 100; select * from t1 join t2 on t1.c = t2.d where t1.b < @v1 and t2.c between @v2 and @v3 option( querytraceon 9476, querytraceon 3604, querytraceon 2363 ) go |
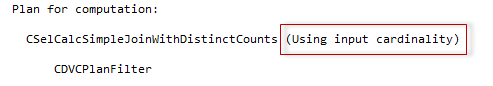
Let’s switch to the Message tab. If you inspect the CSelCalcSimpleJoinWithDistinctCounts output, among the other information you’ll see the following description.
The first one (default):
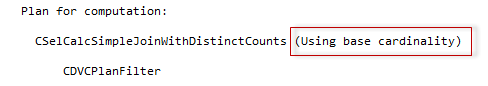
The second one (the model variation):
That’s all for that post!
The next time we are going to dive into another topic – Overpopulated Primary Key.
Table of contents
References
- Optimizing Your Query Plans with the SQL Server 2014 Cardinality Estimator
- Query Processor Modelling Extensions in SQL Server 2005 SP1
- Join containment assumption in the New Cardinality Estimator degrades query performance in SQL Server 2014 and later

Currently he works as a database developer lead, responsible for the development of production databases in a media research company. He is also an occasional speaker at various community events and tech conferences. His favorite topic to present is about the Query Processor and anything related to it. Dmitry is a Microsoft MVP for Data Platform since 2014.
View all posts by Dmitry Piliugin
- SQL Server 2017: Adaptive Join Internals - April 30, 2018
- SQL Server 2017: How to Get a Parallel Plan - April 28, 2018
- SQL Server 2017: Statistics to Compile a Query Plan - April 28, 2018