
While preparing the post about Adaptive Joins, I’d like to share a quick post about the hidden gem in SQL Server 2017 CTP 2.0, discovered recently. In this short post, we will look at how you can determine what statistics are used by the optimizer during a plan compilation in SQL Server 2017.
Prior to SQL Server 2017, there were two ways how you could do it, both undocumented and involving undocumented trace flags.
The first one I got to know from the Paul White’s (t).This method involves using two undocumented trace flags 9292 and 9204. To see their output, you should combine them with a trace flag 3604.
Here is an example, I use the sample DB AdventureWorksDW2016CTP3:
|
1 2 3 4 5 6 7 8 9 10 11 12 13 14 15 16 |
alter database [AdventureworksDW2016CTP3] set compatibility_level = 110; go set showplan_xml on; go select * from dbo.FactInternetSales fis join dbo.DimDate d on d.DateKey = fis.OrderDateKey where d.CalendarYear = 2015 and d.MonthNumberOfYear = 1 option(querytraceon 9292, querytraceon 9204, querytraceon 3604); go set showplan_xml off; go |
To see the output, switch to the Message Tab in SSMS:
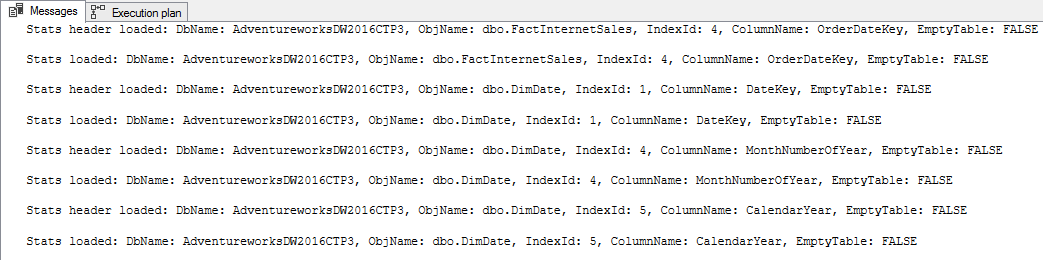
You may notice that I have to set a DB compatibility level to SQL Server 2012, which is because those trace flags work together with a legacy cardinality estimator (CE) and do not work with a modern version of CE, which was introduced in SQL Server 2014.
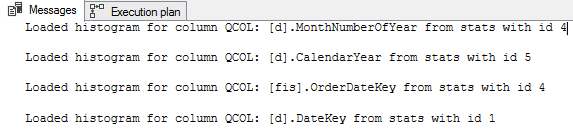
In 2014 and later we may use a trace flag 2363, which is also undocumented, and which outputs also selectivity computation information.
|
1 2 3 4 5 6 7 8 9 10 11 12 13 14 15 16 |
alter database [AdventureworksDW2016CTP3] set compatibility_level = 120; go set showplan_xml on; go select * from dbo.FactInternetSales fis join dbo.DimDate d on d.DateKey = fis.OrderDateKey where d.CalendarYear = 2015 and d.MonthNumberOfYear = 1 option(querytraceon 2363, querytraceon 3604); go set showplan_xml off; go |
The output is:
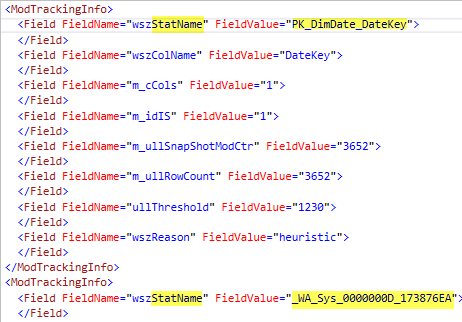
The second method also involves the undocumented trace flag, TF 8666. I got to know this method from the Fabiano Amorim’s (t) blog post Statistics used in a cached query plan. The difference with a previous one is that a statistic’s information is added to a query plan (together with some other undocumented properties).
Here is an example:
|
1 2 3 4 5 6 7 8 9 10 11 12 13 14 15 16 17 |
alter database [AdventureworksDW2016CTP3] set compatibility_level = 130; dbcc traceon(8666); go set showplan_xml on; go select * from dbo.FactInternetSales fis join dbo.DimDate d on d.DateKey = fis.OrderDateKey where d.CalendarYear = 2015 and d.MonthNumberOfYear = 1; go set showplan_xml off; go dbcc traceoff(8666); |
You may see the output if you open a plan as an XML:
This method works for both, legacy and modern version of CE.
SQL Server 2017
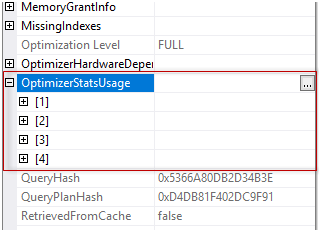
Now let’s see how we may find the statistics used by the optimizer in SQL Server 2017 CTP 2.0. For this purpose, we should only go to the root element of the plan. In our case, it is a SELECT element, and if you have SQL Server Management Studio 17.0 installed, you will see the following in the element properties:

We may see four statistics objects used in this plan (we saw this earlier with the other methods also). And if you expand one, you will see the following properties:
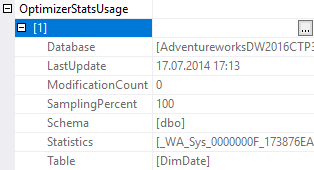
We see the statistic’s name, table, DB and schema name, as well as last update time, modification count of the statistics leading column and even sampling percent. Very easy, without extra movements!
This is also helpful if you decide to query your plan cache with XQuery to find out which statistics is used for the query compilation but is outdated.
I this this is very helpful and good improvement. I would like to thank Microsoft Team for keeping adding important query optimization details.
Thank you for reading!
Table of contents

Currently he works as a database developer lead, responsible for the development of production databases in a media research company. He is also an occasional speaker at various community events and tech conferences. His favorite topic to present is about the Query Processor and anything related to it. Dmitry is a Microsoft MVP for Data Platform since 2014.
View all posts by Dmitry Piliugin
- SQL Server 2017: Adaptive Join Internals - April 30, 2018
- SQL Server 2017: How to Get a Parallel Plan - April 28, 2018
- SQL Server 2017: Statistics to Compile a Query Plan - April 28, 2018