
In this blog post, we are going to view some interesting model variation, that I’ve found while exploring the new CE.
A model variation is a new concept in the cardinality estimation framework 2014, that allows easily turn on and off some model assumptions and cardinality estimation algorithms. Model variations are based on a mechanism of pluggable heuristics and may be used in special cases. I think they are left for Microsoft support to be able to address some client’s CE issues pointwise.
Today we are going to view some interesting model variation, that creates filtered statistics on-the-fly. I should give a disclaimer here.
Warning: All the information below is presented for purely educational and curiosity purposes. This is completely undocumented and unsupported and should not ever be used in production systems unless Microsoft support will recommend you. More to the point, the usage of this model variation may affect the overall server performance in a negative way. This should be used for experiments and in the test environment only.
Now, when I frightened everyone, let’s consider an example, in the AdventureWorks2012 database under compatibility level of SQL Server 2014.
|
1 2 3 4 5 6 7 8 9 |
alter database AdventureWorks2012 set compatibility_level = 120; go select count_big(*) from Sales.Customer c join Person.Person p on c.PersonID = p.BusinessEntityID where c.TerritoryID = 3 |
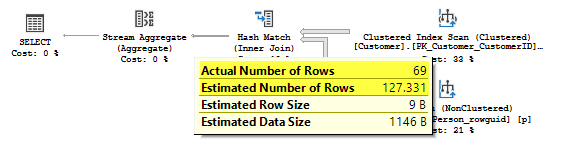
The join estimate is 127.331 rows, the actual number of rows is 69. This difference appears because the filter by TerritoryID column leverages the histogram of the join column PersonID in the estimation process, which is done in the bottom-up way, as we remember from the earlier posts.
Now, let’s manually create filtered statistics, re-run the query and then drop filtered statistics.
|
1 2 3 4 5 6 7 8 9 10 11 12 13 |
create statistics s_PersonID_TerritoryID_Equals3 on Sales.Customer(PersonID) where TerritoryID = 3; go dbcc freeproccache; go select count_big(*) from Sales.Customer c join Person.Person p on c.PersonID = p.BusinessEntityID where c.TerritoryID = 3 go drop statistics Sales.Customer.s_PersonID_TerritoryID_Equals3; |
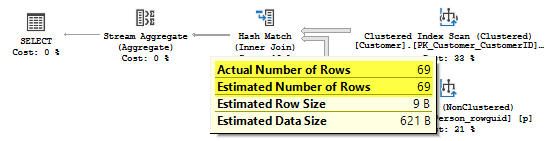
The estimate now is 69 rows, which equals the actual number of rows.
Interesting, that SQL Server 2014 Cardinality Estimation Framework has an ability to do this operation on the fly, when it is considered to be beneficial and the model variation is forced to be used.
To force this model variation we will use the undocumented TF 9483, we will also use TF 2363 to view diagnostic output, and use Profiler (or you may use xEvents) to watch the events: Performance: Auto Stats, Showplan XML Statistics Profile and SP:StmtCompleted.
Let’s run our query once again with all that stuff enabled.
|
1 2 3 4 5 6 7 8 9 10 11 12 13 |
select count_big(*) from Sales.Customer c join Person.Person p on c.PersonID = p.BusinessEntityID where c.TerritoryID = 3 option( recompile, querytraceon 3604, querytraceon 2363, querytraceon 9483 ) |
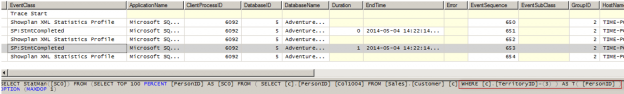
First, let’s look at the profile output, we’ll see a very interesting picture there:
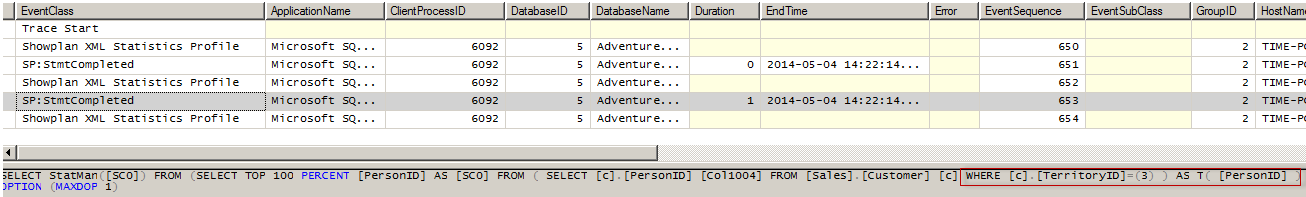
Two filtered statistics on the fly were created, before the query plan was built, one of them is in the PersonID column, that we used in the Join.
Now, if we look at the TF 2363 diagnostic output, among the other information, we’ll see:
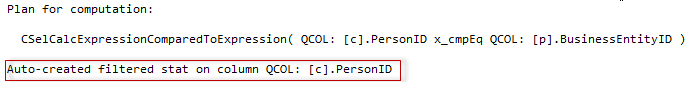
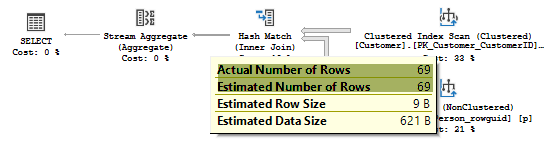
Now, if we look at the join estimates, we’ll see that this statistic was used to estimate the join like the one we created manually on the previous step, and the estimate is 69 rows, which is equal to the actual number of rows.
If you try to find the created statistics in the sys.stats DMW – you will not find it there. It is created on the fly, during the query optimization and is not persisted in the sys.stats, that is why we didn’t see the Auto Stats event in the Profiler.
I think it is a very curious model variation, though it is quite resource intensive, to build the statistics each time you optimize a query, maybe there are certain scenarios and special cases where it will be beneficial and Microsoft decided to implement it as a model variation.
That’s all for today. Next, we will talk about some other changes in the new Cardinality Estimation Framework.
Table of Contents
References

Currently he works as a database developer lead, responsible for the development of production databases in a media research company. He is also an occasional speaker at various community events and tech conferences. His favorite topic to present is about the Query Processor and anything related to it. Dmitry is a Microsoft MVP for Data Platform since 2014.
View all posts by Dmitry Piliugin
- SQL Server 2017: Adaptive Join Internals - April 30, 2018
- SQL Server 2017: How to Get a Parallel Plan - April 28, 2018
- SQL Server 2017: Statistics to Compile a Query Plan - April 28, 2018