In the previous article, we described, in detail, the different stages that a submitted SQL Server query goes through and how it processed by the SQL Server Relational Engine. The SQL Server Relational Engine generates the Execution Plan and the SQL Server Storage Engine performs the requested data retrieval or modification process. In this article, we will discuss the different types and formats for SQL Server Execution Plans.
Execution Plans types
The SQL Server Execution Plan is the graphical representation of the execution roadmap of the submitted query that will be followed by the SQL Server Query Optimizer, with the cost of executing every part of the query code. SQL Server provides us with two main types of execution plans.
- The first type is the Estimated Execution Plan. It is the plan that is generated by parsing the submitted query as an estimate of how the query will be executed, without being executed.
- The second type is the Actual Execution Plan, that is generated by executing the submitted query, displaying the actual steps that followed while executing the query.
The Actual Execution Plans are preferred most of the time by database administrators as it shows more information about query execution statistics. You can benefit from the Estimated Execution Plan in troubleshooting complex queries that take a long time to run, where you will be able to generate the execution plan without the need to execute it. But in some cases, the Estimated and the Actual Execution Plans can differ greatly, due to the difference between actual table data and statistics. Frequent data insertion and modification operations can also make the statistics less accurate.
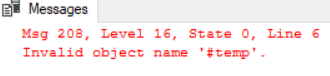
This issue can be fixed by updating the table’s or index’s statistics. In some situations, the Estimated Execution Plan will not be able to be generated when the query has a temporary table that has not been created yet, as the query is not executed to create the table, causing an error message like the below:
The Estimated Execution Plan can be viewed in different ways:
-
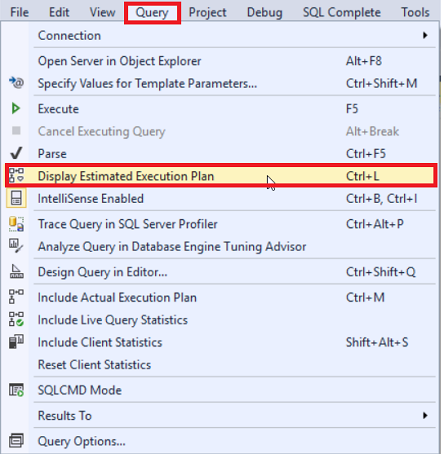
Choose the Display Estimated Execution Plan option from the Query menu, as shown below:

-
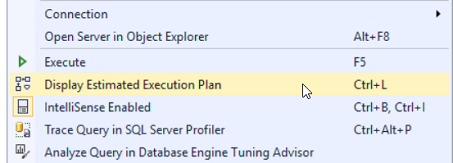
Click on the Display Estimated Execution Plan icon from the taskbar, as follows:
-
Right-click on the query editor and choose the Display Estimated Execution Plan option, as shown below:
-
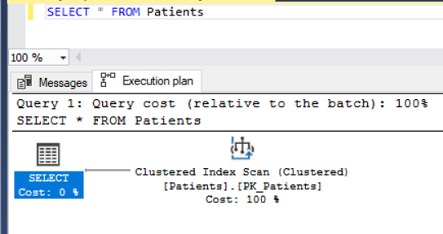
Type the Ctrl+L keyboard shortcut, and the Estimated Execution Plan for the submitted query will be displayed without the need to execute it, as in the snapshot below:
The Actual Execution Plan, unlike the Estimated Execution Plan, cannot be displayed directly. It requires the submitted query to be executed in order to be displayed. The Actual Execution Plan can be included in the query using different ways:
-
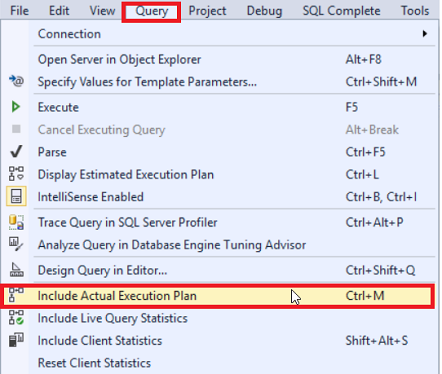
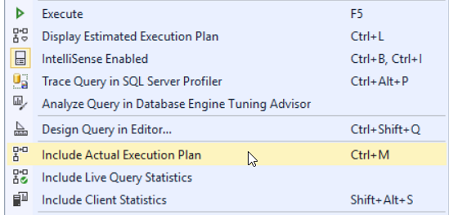
Choose the Include Actual Execution Plan option from the Query menu, as shown below:
-
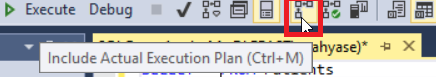
Click on the Include Actual Execution Plan icon from the taskbar, as follows:
-
Right-click on the query editor and choose the Include Actual Execution Plan option, as shown below:
-
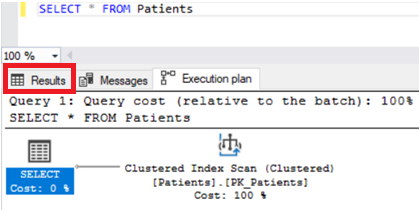
Type the Ctrl+M keyboard shortcut, and the Actual Execution Plan for the submitted query will be Included. In other words, the Actual Execution Plan option will be turned ON for that query, or any query executed in that window. When you execute the query, the Actual Execution Plan will be displayed, as in the snapshot below:
For more information about the Actual and Estimated Execution Plans, check SQL Server Estimated Vs Actual Execution Plans.
In SQL Server 2016, Microsoft introduced a new feature that provides us with the ability to monitor run-time statistics, also called the Live Execution Statistics, for each operator in the execution plan and track the flow of the data between the different operators during the query execution process. The execution statistics include the number of processed rows, the time consumed by each operator and the overall progress of the query execution.
Live Query Statistics can be included in different ways:
-
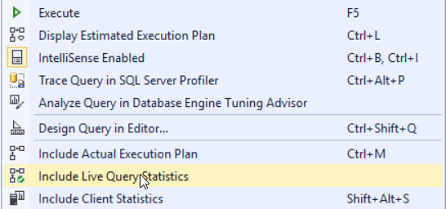
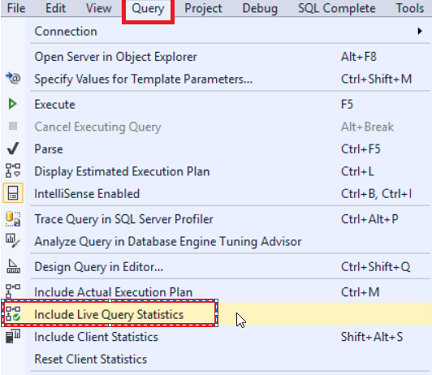
Choose the Include Live Query Statistics option from the Query menu, as shown below:
-
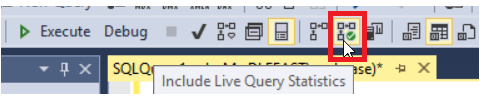
Click on the Include Live Query Statistics icon from the taskbar, as follows:
-
Right-click on the query editor and choose the Include Live Query Statistics option, as shown below:
-
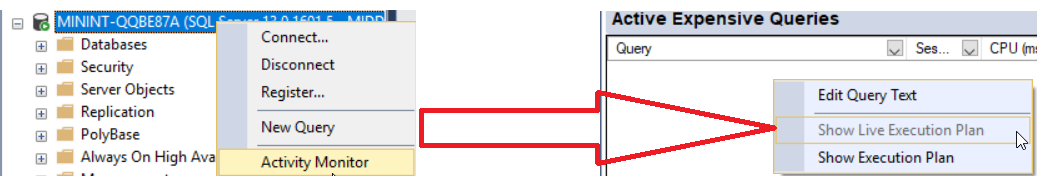
Open the Activity Monitor window and right-click on the target query from the Active Expensive Queries section then choose the Show Live Execution Plan option as shown below:
After including the Live Query Statistics, run the query and monitor the run-time execution statistics of the query and how the data flows between the operators, as shown below:
For more information about the new Live Query Statistics feature, see Troubleshoot SQL query performance using SQL Server 2016 Live Execution Statistics.
Execution Plans Formats
In SQL Server, the Execution Plan that is generated for each query can be viewed in three different ways, depending on the level of detail you manage to view, and the plan generation method. The three Execution Plan formats are:
Graphical Format:
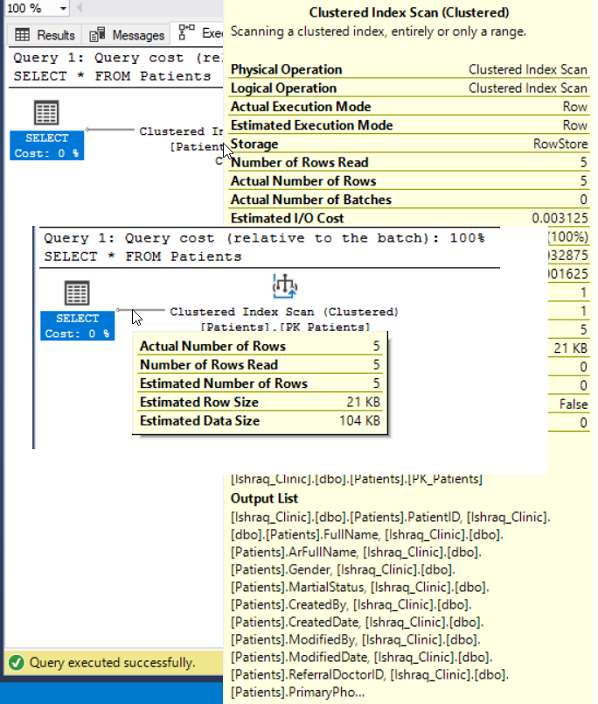
The graphical view of the SQL Server Execution Plan is the most common and friendly plan format, that provides us with a quick and easy way to read the plan and analyze it. The graphical views include the Actual, Estimated and Live Query Statistics plans discussed earlier in this article. The only dark point of the graphical format of the execution plan is that the execution details are hidden behind the plan arrows and operators’ properties, as shown below:
Text Format:
The text plan provides us immediately with the least details about the query execution, in a flat text view, making it quite difficult to analyze and not preferred by the database administrators.
The text plan comes in three formats:
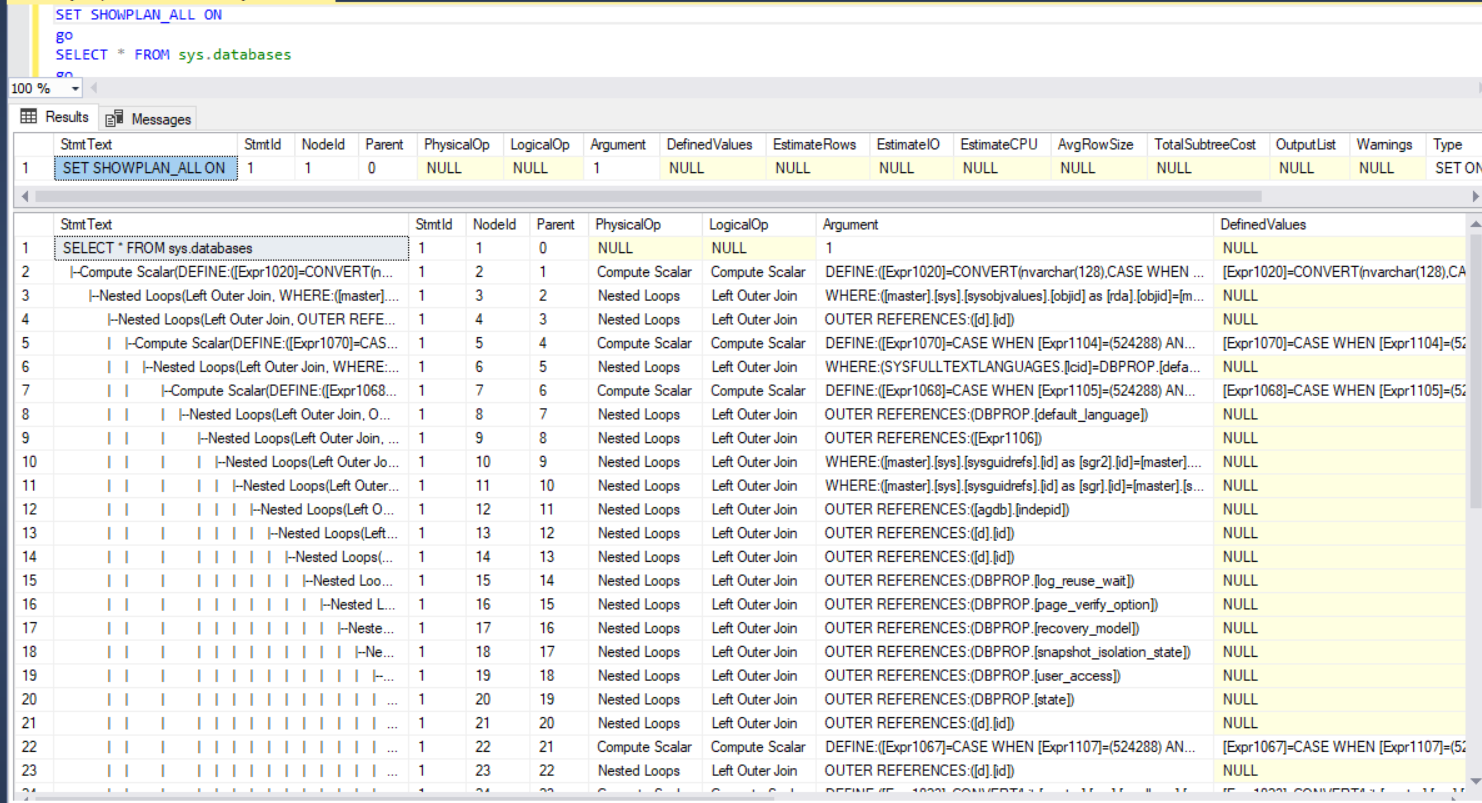
SHOWPLAN_ALL: Displays the Estimated Plan of the query with complete set of information about the query execution, as shown below:
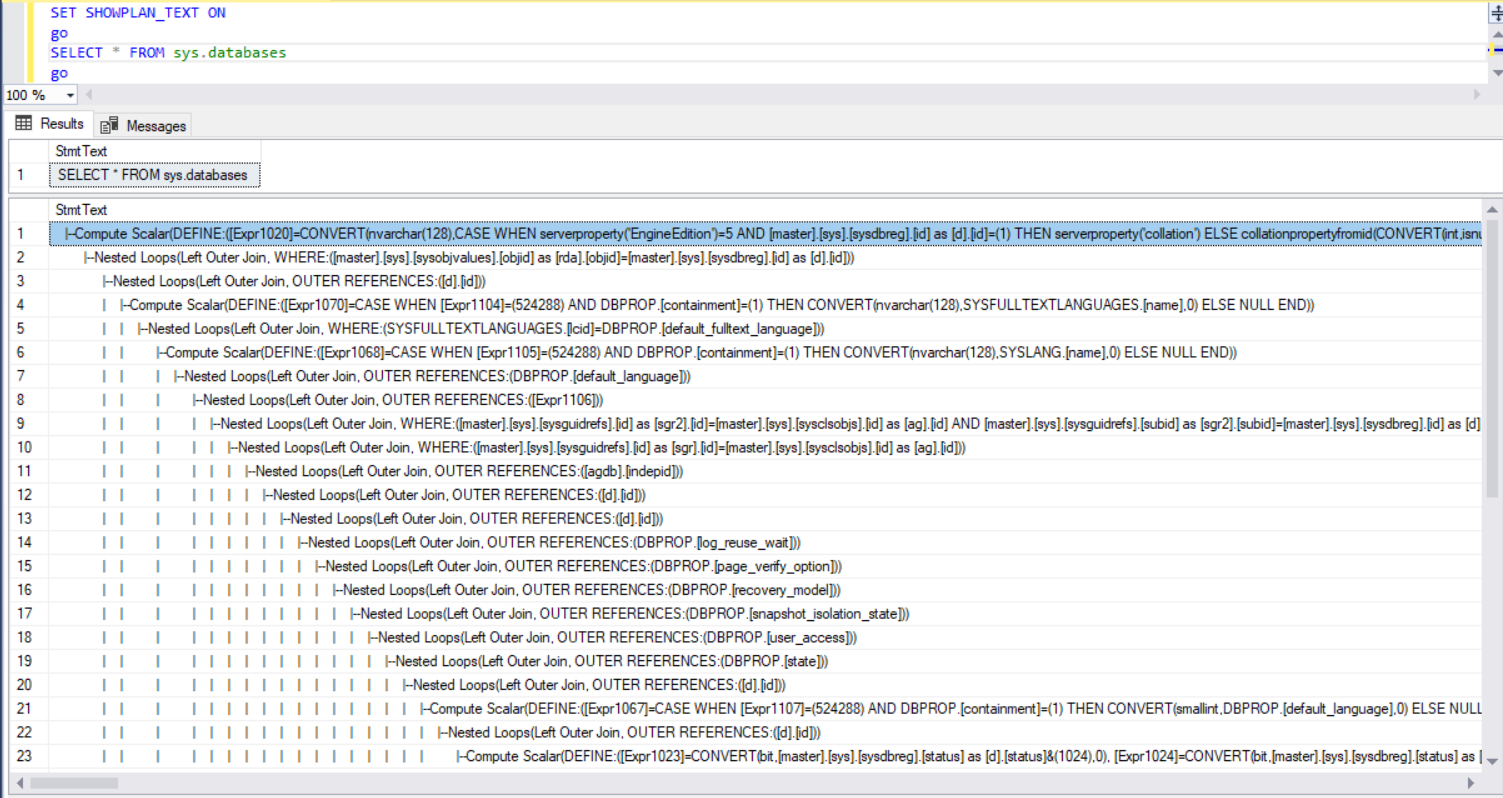
SHOWPLAN_TEXT: Displays the Estimated Plan of the query with very limited set of information about the query execution, as shown below:
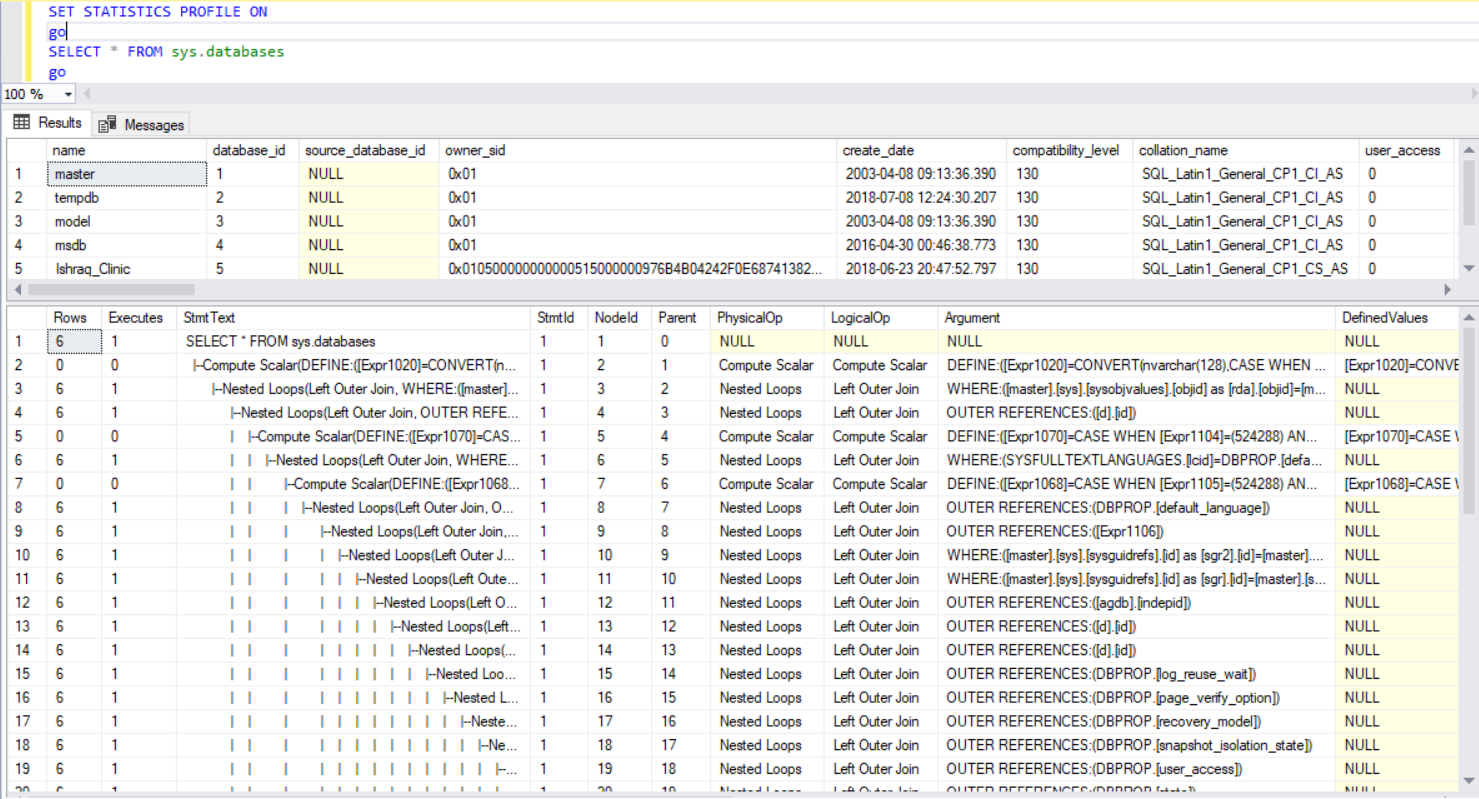
STATISTICS PROFILE: Displays the Actual Execution Plan of the query with complete set of details, as shown below (see how the query results are shown):
XML Format:
The XML plan provides us with a complete set of information about the query execution viewed in XML structure, that is difficult to be read and analyzed and easy to be shared with other experts for troubleshooting purposes.
The XML Execution Plan comes in two formats:
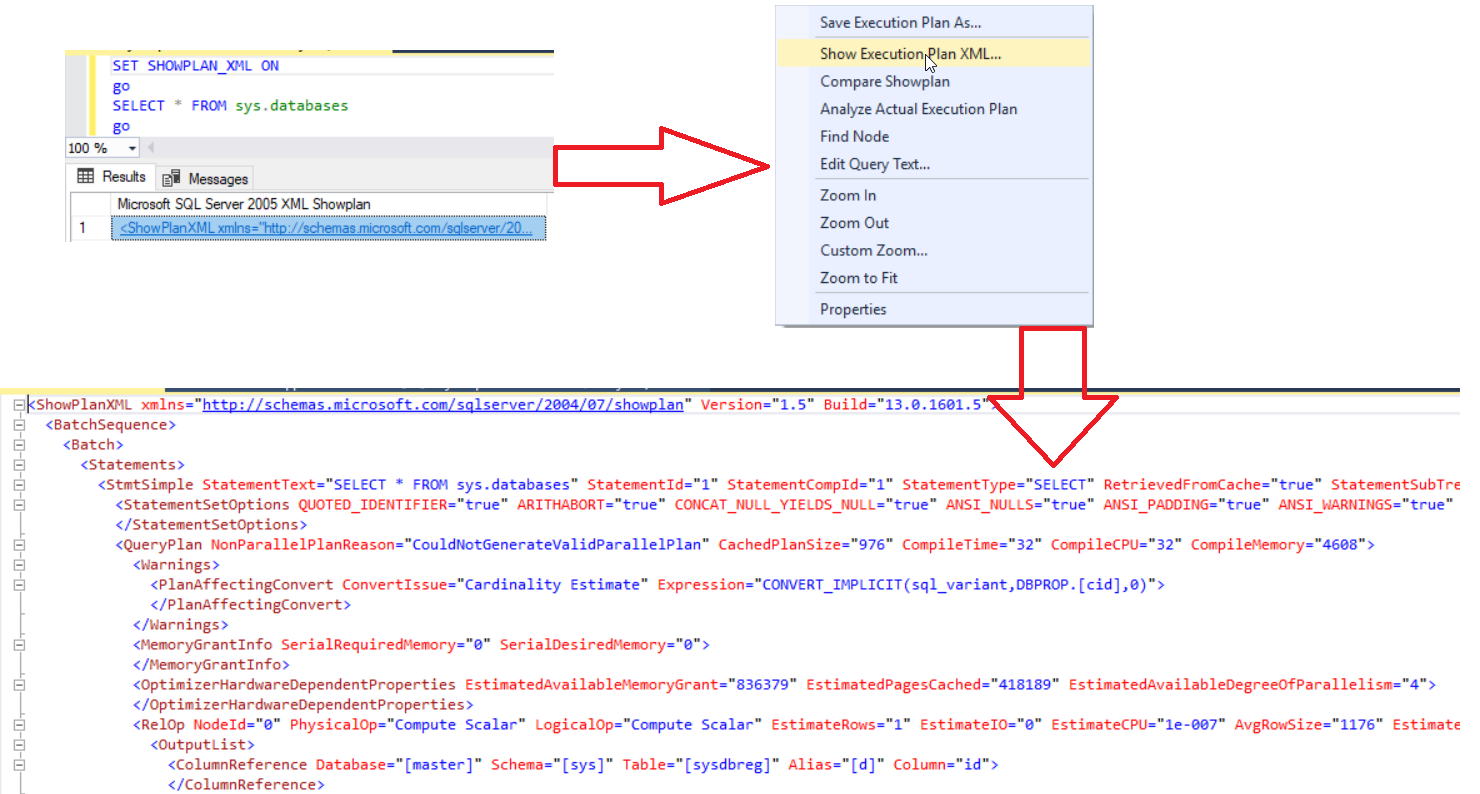
SHOWPLAN_XML: Displays the Estimated Execution Plan of the query, as shown below (Recall that you can easily reach the XML plan from the graphical plan using the Show Execution Plan XML option):
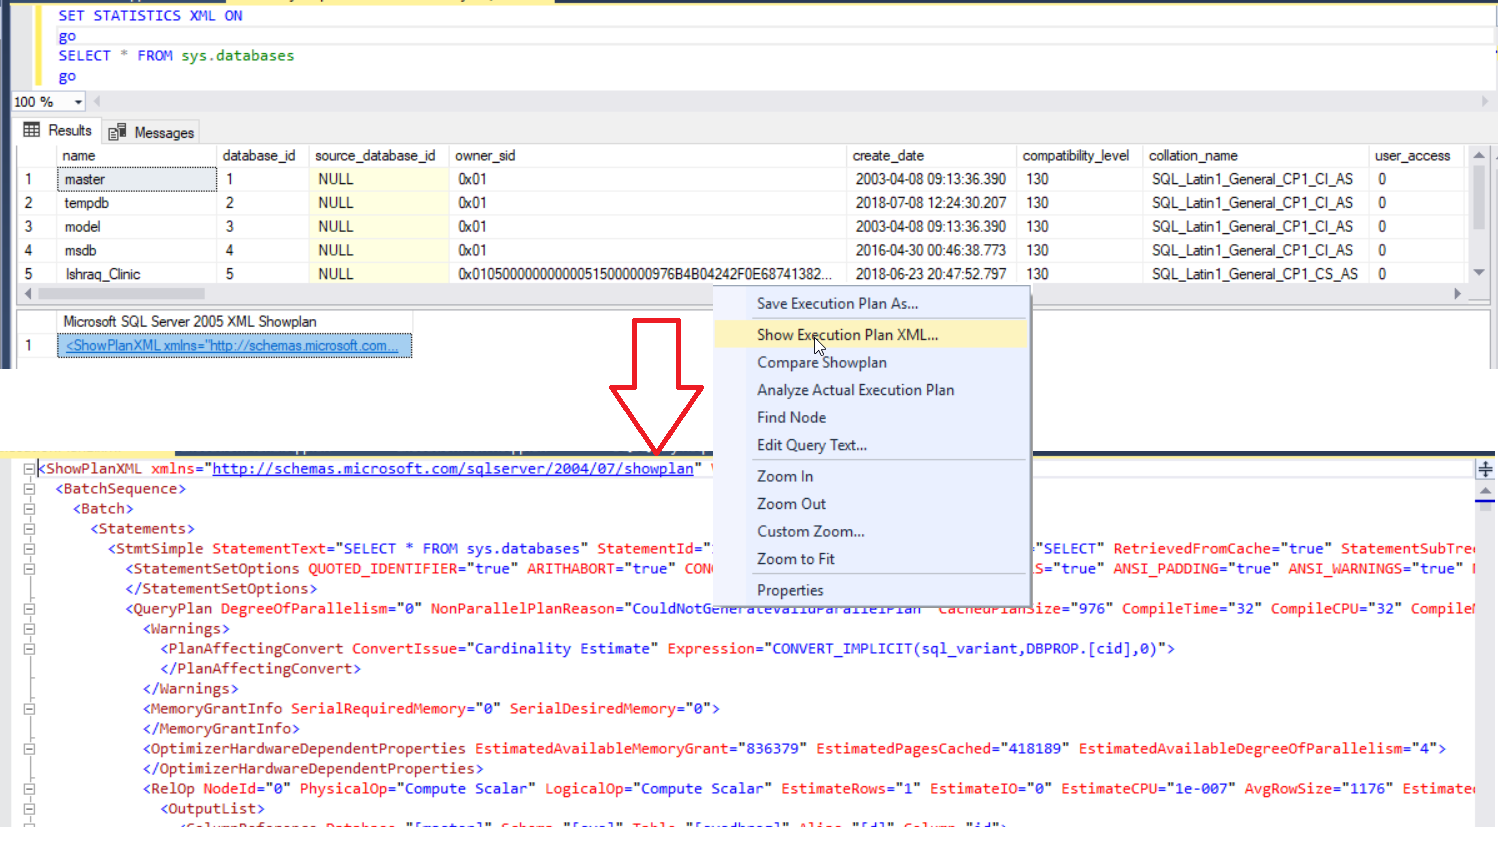
STATISTICS XML: Displays the Actual Execution Plan of the query, as shown below:
Till this point, we became familiar with the different types and formats of the SQL Server Execution Plans, the differences between these types and formats and how we can take benefits from these types. Stay tuned for the next article, in which we will discuss the different components of the Execution Plan and how to analyze it.
Table of contents
References
- SET SHOWPLAN_TEXT (Transact-SQL)
- SET SHOWPLAN_ALL (Transact – SQL)
- SET SHOWPLAN_XML (Transact – SQL)
- SQL Server Estimated Vs Actual Execution Plans
- Force query execution plan using SQL Server 2016 Query store
- Troubleshoot SQL query performance using SQL Server 2016 Live Execution Statistics
- Displaying Graphical Execution Plans (SQL Server Management Studio)
Ahmad Yaseen is a Microsoft Big Data engineer with deep knowledge and experience in SQL BI, SQL Server Database Administration and Development fields.
He is a Microsoft Certified Solution Expert in Data Management and Analytics, Microsoft Certified Solution Associate in SQL Database Administration and Development, Azure Developer Associate and Microsoft Certified Trainer.
Also, he is contributing with his SQL tips in many blogs.
View all posts by Ahmad YaseenLatest posts by Ahmad Yaseen (see all)- Azure Data Factory Interview Questions and Answers - February 11, 2021
- How to monitor Azure Data Factory - January 15, 2021
- Using Source Control in Azure Data Factory - January 12, 2021
-