
A SQL Server execution plan is the most efficient and least cost road map that is generated by the Query Optimizer’s algorithms calculations to execute the submitted T-SQL query. Execution plans are used by the database administrators to troubleshoot the performance of poorly performing queries to isolate the part of the query that is at the root of the performance issue.
When a T-SQL query is submitted to the SQL Server database engine, a specific number of processes will be assigned to work on that query, concurrently, in order to execute it in the minimum time with the least resources.
In the first step, the SQL Server Relational Engine will check that the T-SQL query is written correctly in a process called query Parsing. A parsing tree will be generated from the parser that contains the steps that are required to execute the submitted query. For DML queries, the parsing tree will be processed by the Algebrizer that is responsible for resolving the name of the database objects that are used in the query. The query processor tree that is generated by the algebrizer will be passed to the SQL Server Query Optimizer.
What the Query Optimizer does is specify the best way to execute the submitted query, by choosing the most efficient plan with the lowest CPU, memory, and I/O cost between different execution plans. The query Optimizer uses the query processor tree and SQL Server Statistics, which are the metadata that describe the data distribution and uniqueness within the database tables and indexes, to create the best plan, taking into consideration that the Optimization Level that is used is the Full optimization level. The Query Optimizer keeps testing and trying different indexes and orders for the query execution steps, calculating the estimated cost for each step and accumulating the overall plan cost until it reaches the fastest execution plan. When the plan is generated by the Query Optimizer, it will be stored in a special memory storage called the Plan Cache for reuse in future. Finally, the plan will be used by the SQL Server Storage Engine to execute the query and insert, retrieve or update the requested data.
The least execution time with the minimum resources consumption describes the optimal and most efficient execution plan expected from the Query Optimizer. But it is an expensive process that the query optimizer skips it if it can reuse the plans saved in the plan cache. Another situation when the submitted query is a simple SELECT query with no aggregations or complex calculations, the Query Optimizer prefers to create a basic plan to execute that query rather than spending the time in creating the most optimal plan.
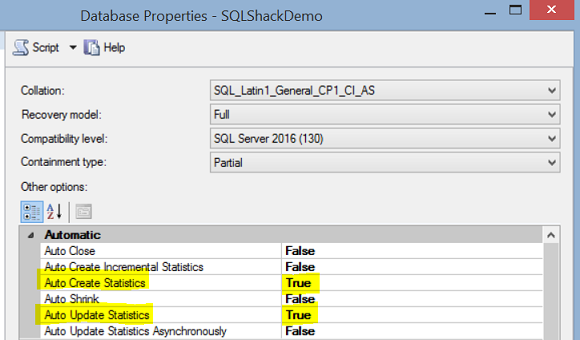
In order to have accurate calculations, the Query Optimizer depends on SQL Server Statistics in formulating the best plan decision. These statistics describe the data distribution and occurrence within the database tables and indexes. The quality of these statistics is very important in creating the optimal execution plan. If the statistics become out of date or changed after creating the plan, the execution plan will be dropped from the plan cache and replaced by more efficient one. By default, the statistics are created and updated automatically for all tables and indexes which can be configured from the Database Properties window as follows:
Execution plans are not stored in the plan cache forever, an internal process that is responsible for clearing the caches, the lazywriter, will remove the plan from the plan cache if the system requires more memory or the plan age, a special measurement for the plan usage, is equal to zero. The plan cache can be flushed manually using the DBCC command below:
|
1 2 3 |
DBCC FREEPROCCACHE |
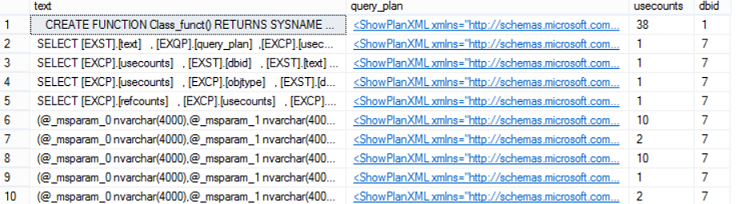
Also the content of the plan cache can be viewed using the sys.dm_exec_cached_plans DMV combined with other DMVs to show the query text and the graphical execution plan as follows:
|
1 2 3 4 5 6 7 8 9 |
SELECT [EXST].[text] , [EXQP].[query_plan] ,[EXCP].[usecounts] , [EXST].[dbid] FROM sys.dm_exec_cached_plans EXCP CROSS APPLY sys.dm_exec_sql_text ( EXCP.plan_handle ) EXST CROSS APPLY sys.dm_exec_query_plan ( EXCP.plan_handle ) EXQP ; |
The result will be like:
There are mainly two types of execution plans that can be displayed from SQL Server Management Studio; the Actual Execution Plan that shows the real calculations and steps followed by the SQL Server Storage Engine while executing the submitted query, which requires executing the submitted query in order to generate the actual plan. The Estimated Execution Plan shows the approximate calculation and the estimated steps that may be followed by the SQL Server Storage Engine to execute the submitted query after parsing the query without the need to execute it in order to generate that logical execution plans type. And these type of plans that are generated by the Query Optimizer and stored in the plan cache.
Actual execution plans are usually used to troubleshoot query performance issues, as it gives us accurate information about the query execution. But the actual execution plan for complex queries may take long time to be generated, so that, it is better to use the estimated execution plans for that complex queries.
Execution plans can be viewed as text, XML, or graphically. Use SET SHOWPLAN_TEXT ON to view the execution plan as text, SET SHOWPLAN_XML ON to view the execution plan as XML. The graphical estimated execution plan can be generated directly when you click on the below button in the SQL Server Management Studio without executing the query:

To include the actual execution plan, click on the below button in the SQL Server Management Studio before executing your query:

An alternative way to do that is right-clicking on the query and choose including the actual plan or displaying the estimated one as follows:
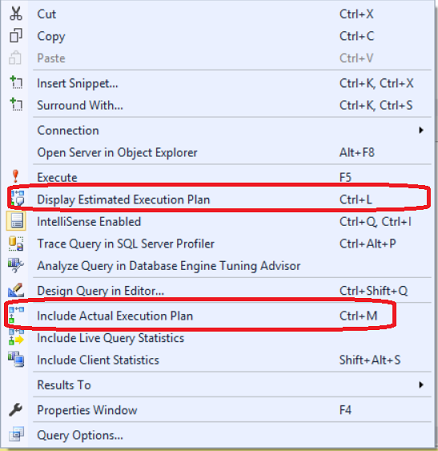
As you can see from the previous image, you can just use the Ctrl+L keyboard shortcut to display the estimated plan and Ctrl+M keyboard shortcut to include the actual one. You should be granted ShowPlan permission in the database that the query will be tested on in order to see the generated execution plan.
Usually the estimated and the actual execution plans are similar, but in some cases, you may notice a difference between them. The main reason for this difference is the difference between the database statistics and the actual data. This is normal behavior that may occur when you insert into and delete from your tables and indexes or change the table or the index schema.
You may ask then, in such cases, whether the automatic update statistics is enabled and working. The answer for that is that the way the automatic update statistics works, and how it takes a subset of the data as samples to update the old statistics in order to reduce the cost of the update process. Also statistics will only be updated automatically if 20% of the rows is changed, which can an issue for very large tables, in that this may result in performance issues. Which means that the statistics will differ from the actual data with time, generating bad execution plans that rely on these inaccurate statistics. Updating the statistics manually, out of peak time to avoid the aforementioned performance issues, will reduce the difference between the real data and the statistics.
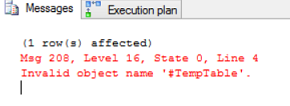
Other circumstances in which the estimated execution plan differs from the actual execution plan is when the estimated execution plan is invalid, where the execution plan can’t be generated due to an error. A good example for this when the query contains SELECT … INTO temp tables statement as the temp table or variable table is not created yet such as the below example:
|
1 2 3 4 5 6 7 |
USE SQLShackDemo GO SELECT EmpID INTO #TempTable FROM [dbo].[Employees] SELECT * FROM #TempTable DROP TABLE #TempTable |
An error message will be displayed showing that there is no table with that name:
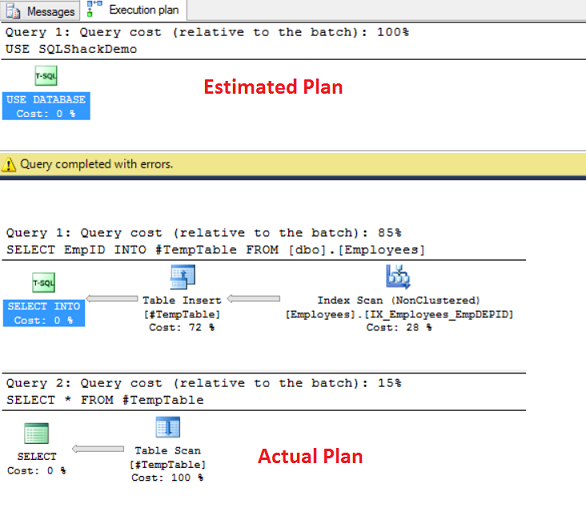
And the result will show us the difference between the estimated and the actual plans as below:
You may also notice a difference between the estimated and the actual plans when parallelism is required or not for that query. Two execution plans will be created for the submitted query if the plan cost meets the parallelism threshold, then the SQL Server Engine, depending on the current situation, will choose to use or not the parallel plan. So that, it may occur that the actual plan is the created parallel plan and the actual one use the serial plan or visa versa.
Let’s look at the below example and check the estimated and actual execution plans for that query. Assume that we need to troubleshoot the below query first with the estimated execution plan:
|
1 2 3 4 5 6 7 8 9 10 |
USE SQLShackDemo GO SELECT EM.EmpName , EM.EmpAddress ,EMD.DepName ,EMF.Emp_Salary from [dbo].[Employee_Financial] EMF inner join [dbo].[Employees] EM ON EM.EmpID =EMF.Emp_ID inner join [dbo].[Employee_Department] EMD ON EMD.DepID =EM.EmpDEPID |
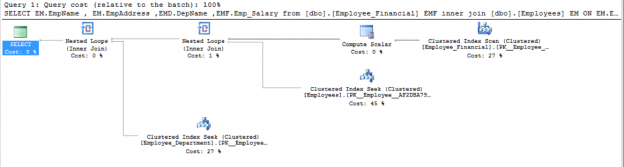
Displaying the estimated execution plan:
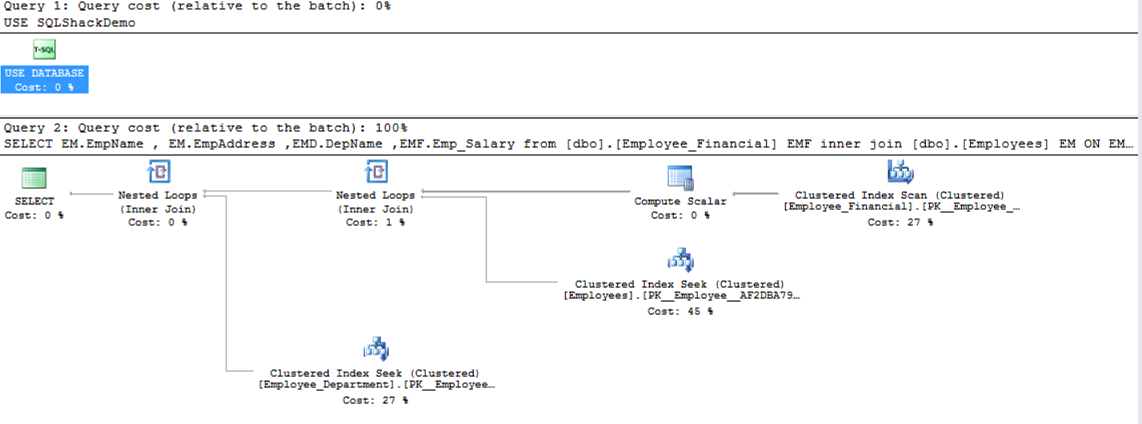
If we include the actual execution plan and run the query:

The two identical results, which you will find most of time, indicates that the statistics on these queried tables are up to date. We are safe this time and you can use the estimated or the actual execution plans to do your troubleshooting work. But for me, I prefer using the actual execution plan for troubleshooting the queries as it will always give us an accurate result.
Conclusion
In this article, we mentioned two types of execution plans; the estimated execution plan that is generated by the Query Optimizer and stored in the plan cache memory storage after parsing the query without the need to execute the query, and the actual execution plan that is generated after executing the query. The actual and estimated execution plans should be the same except in some cases where the statistics are out of date, some schema changes performed on the underlying table, the estimated execution plan can’t be generated due to temp or variable tables that are not created yet or due to parallelism that may or may not be used when executing that query.

He is a Microsoft Certified Solution Expert in Data Management and Analytics, Microsoft Certified Solution Associate in SQL Database Administration and Development, Azure Developer Associate and Microsoft Certified Trainer.
Also, he is contributing with his SQL tips in many blogs.
View all posts by Ahmad Yaseen
- Azure Data Factory Interview Questions and Answers - February 11, 2021
- How to monitor Azure Data Factory - January 15, 2021
- Using Source Control in Azure Data Factory - January 12, 2021